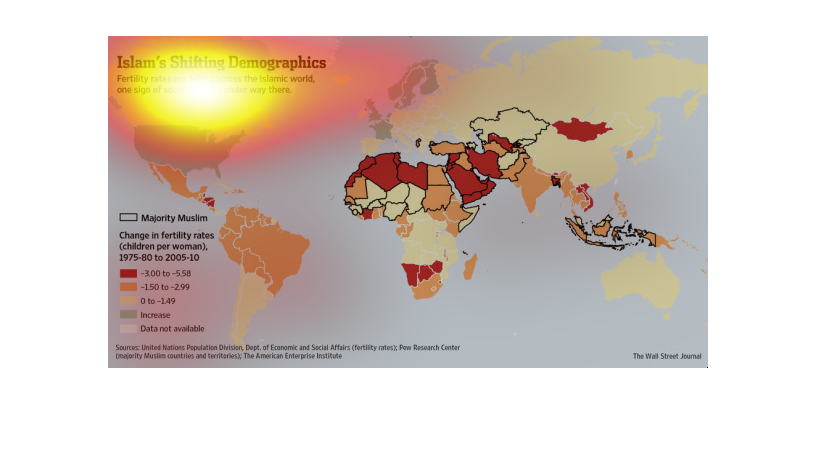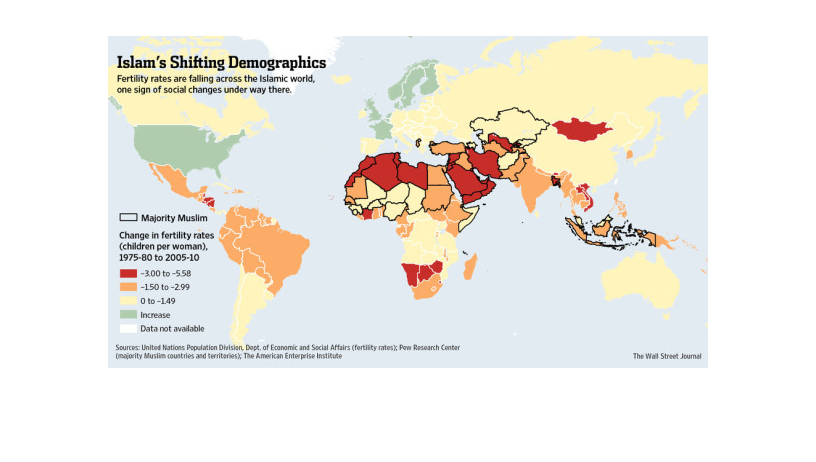
This chart describes Islam's shifting demographics. Specifically, fertility rates are falling
across the Islamic world, one sign of social changes under way there.
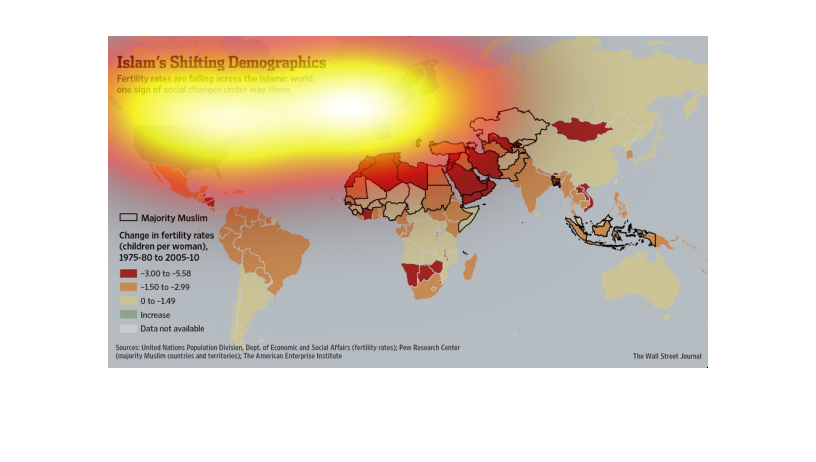
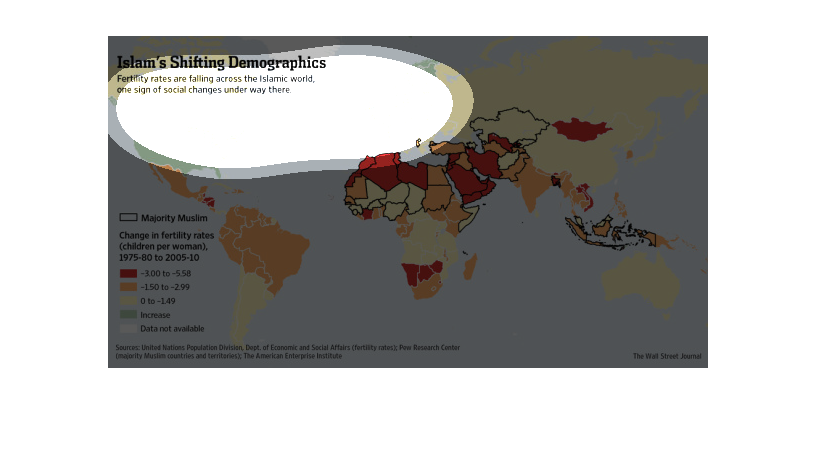
A map infographic of the shifting demographics of Islamic countries.  It shows a major change
in fertility rates across the muslim world showing less children
This is a color coded world map depicting the social changes occurring in the Islamic world
as reflected in declining fertility rates within the demographic.
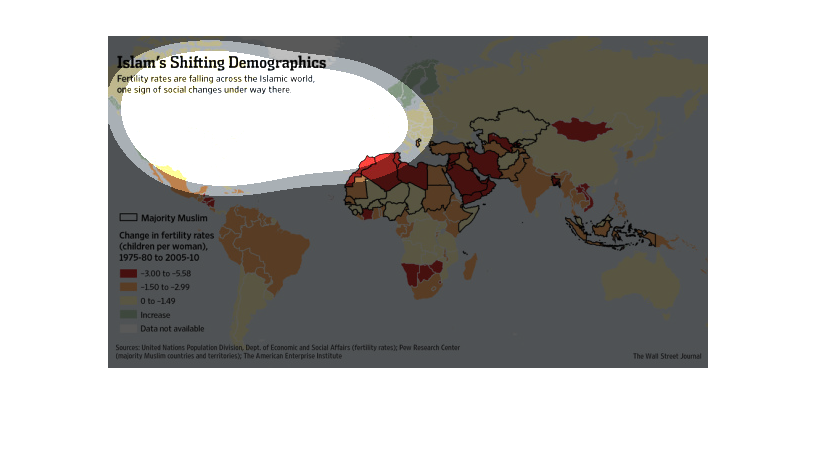
This is a map showing that the fertility rate across the Islamic world is falling greatly,
which could be an indication of some social change occurring there.
The image is of a map that shows fertility rates in the Muslim world. It compares 1975-80
rates to 2005-10 rates. Muslim fertility rates in Europe and US are increasing, while they
are going down in other countries.
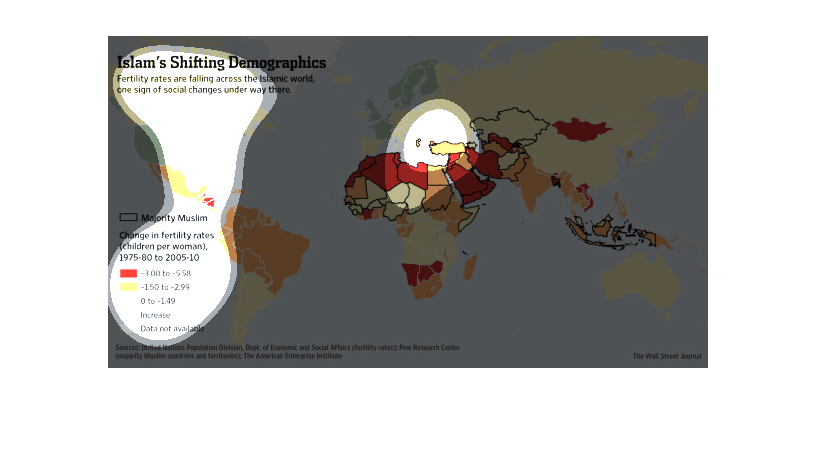
The graph and chart to my left has a world map that is titled "Islam Shifting Demographics"
and it shows how so much has changed in the demographics of Islam
This chart describes Islam's shifting demographics. Specifically, fertility rates are falling
across the Islamic world, one sign of social changes under way there.
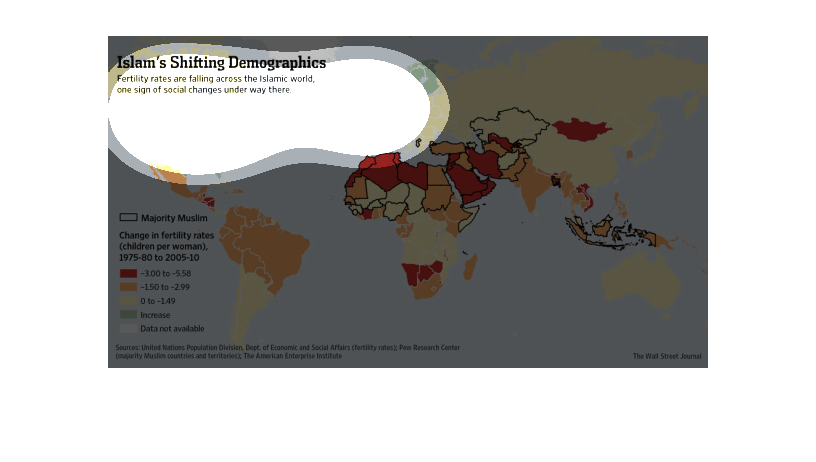
The image depicts Islams shifting demographics by citing fertilization rates falling across
the Islamic world. Fertilization rates appear highest in the middle east.
The image depicts Islam's shifting demographics, citing fertility rates decreasing among the
whole of the Islamic world. Muslims in the US and Western European have increased fertility
rate increases, while the rest of the Islamic world appears to have fallen across the board.
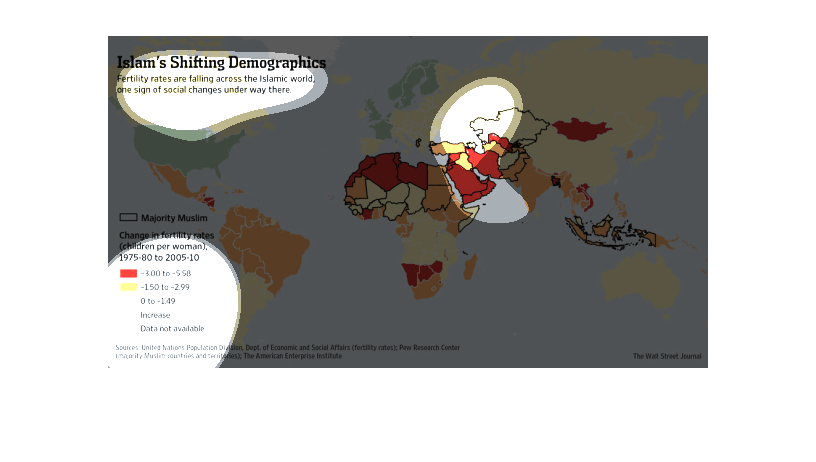
Islam's shifting demographics as displayed in a color coded world map. Fertility rates are
falling across the Islamic world, a sign of social changes on the way. This is mostly seen
in Africa and the Middle East, to a lesser extent in South America, and even less in America
and Europe where muslim fertility has actually increased.
This is a map showing the demographics of Islam based on color. Each color shows whether the
countries have an increase or decrease of Islam population.
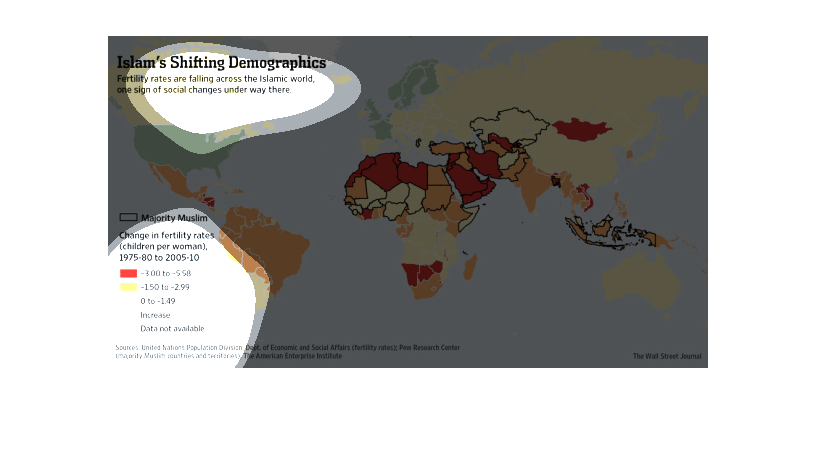
This world map shows shifting demographic of islam across the world, denoted by colored countries
and charting the fall in fertility rates since 1975.
It is a graph of all the areas and countries in the world where Islam is shifting to. There
seems to be a big shift in places in Africa, especially in North africa