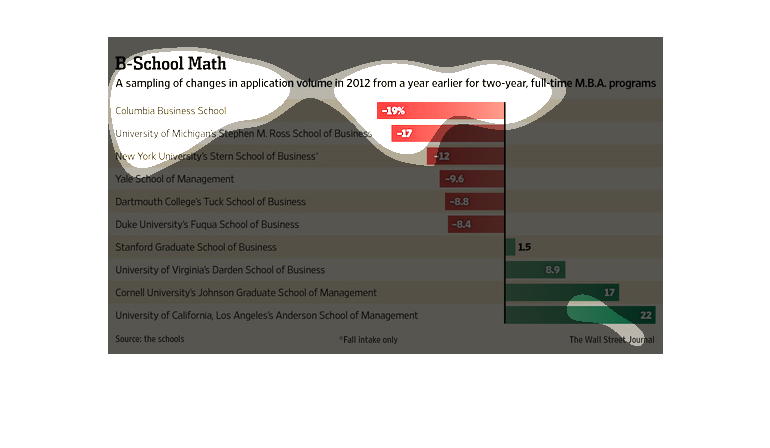
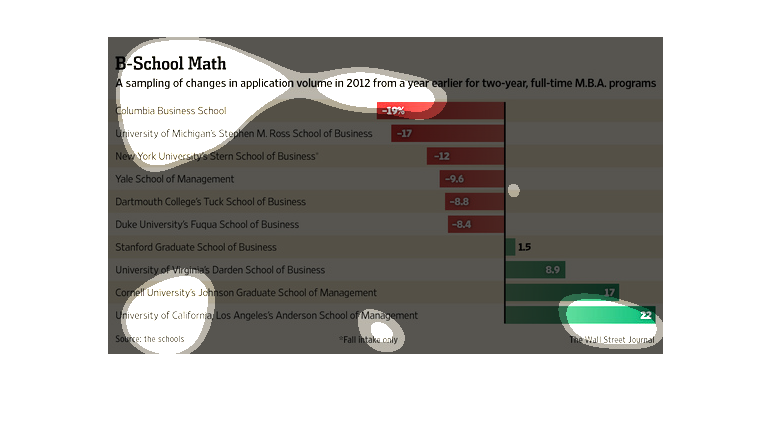
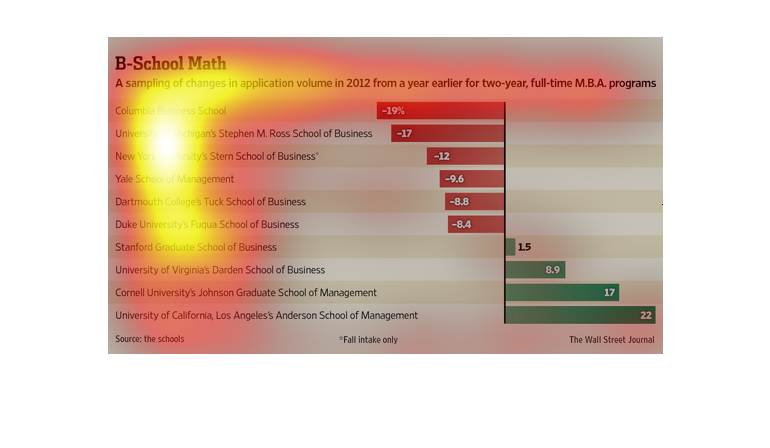
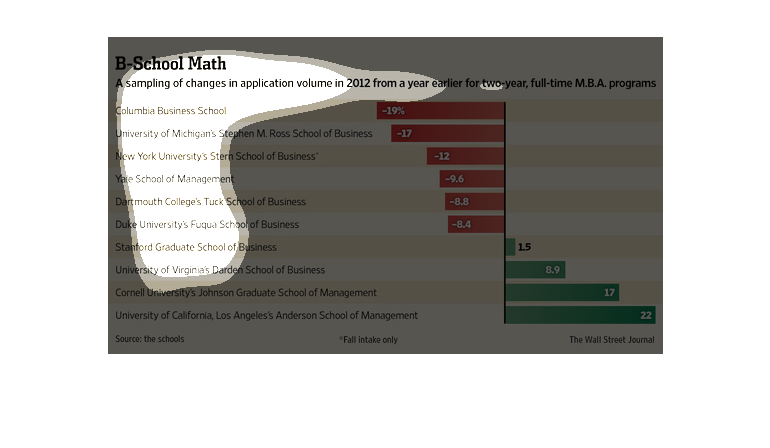
This chart illustrates changes in application volume in 2012 from a year earlier for two year
full time MBA programs.  UCLS had the highest growth rate.
This graph show the changes in volume of student applications from 2011 in 2 year full time
MBA applicants from various schools.  Each school shows their change, either positive or negative,
in percentage.
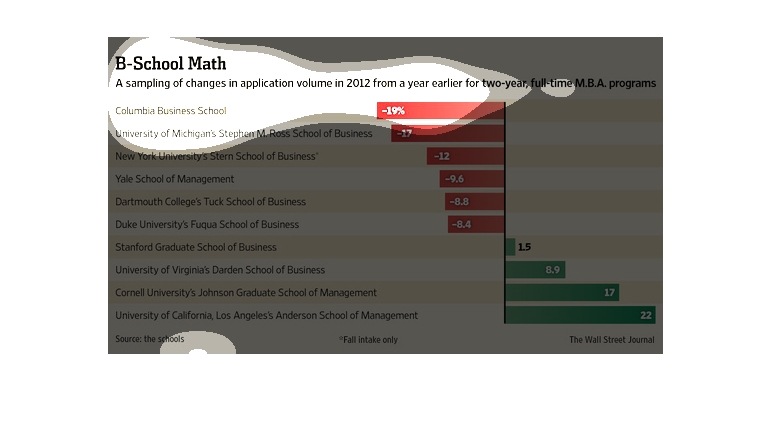
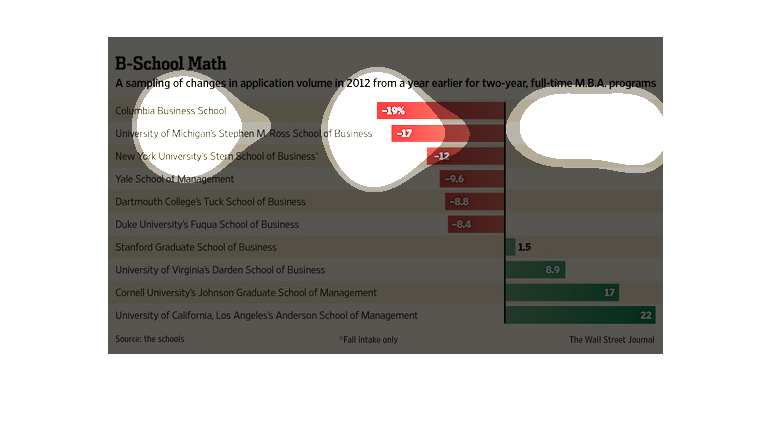
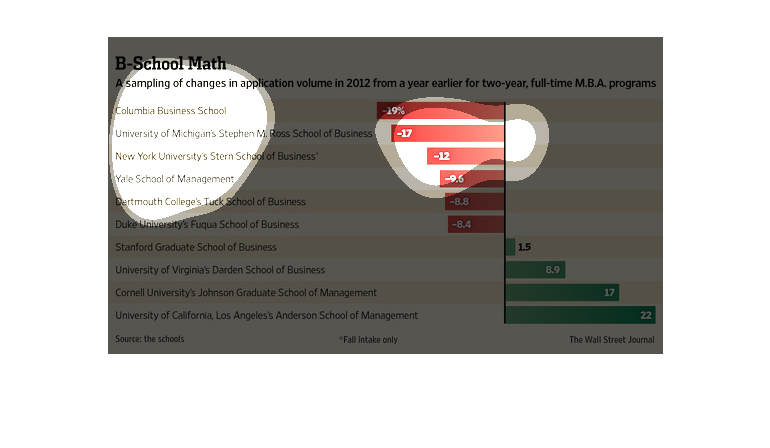
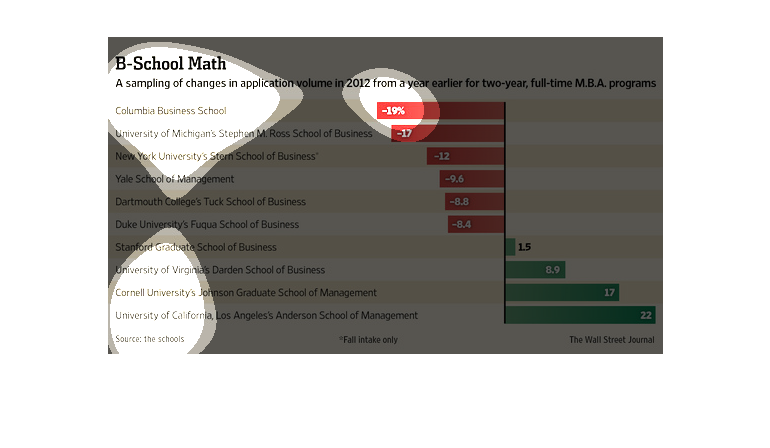
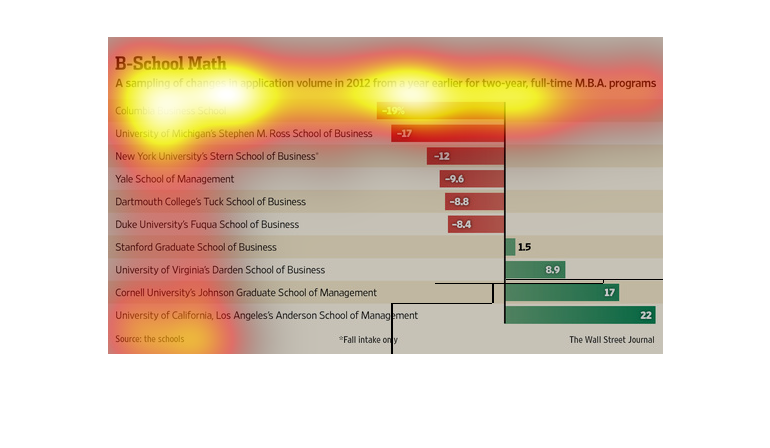
This is a series of bar graphs depicting a sampling a changes in application volume in 2012
from a year ealier for two-year, full time M.B.A. programs.
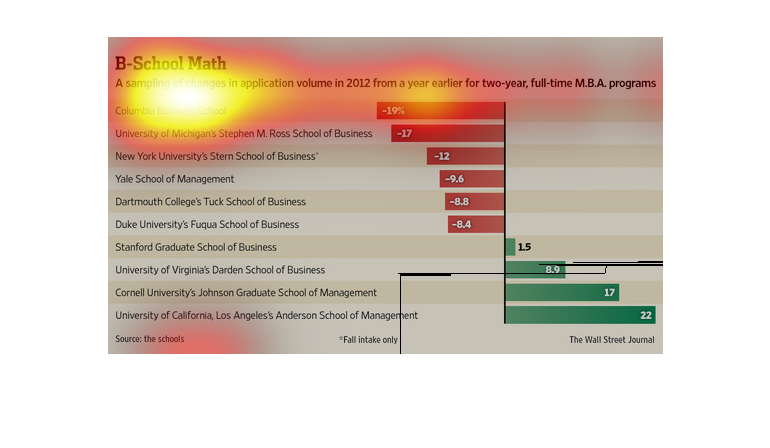
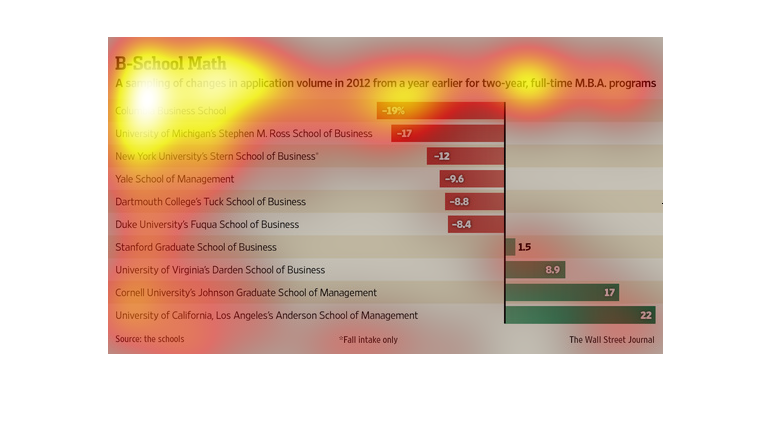
This graph examines changes in math application volume in 2012 from a year earlier across
major M.B.A. programs across the United States. Most are falling, with only 4 rising.
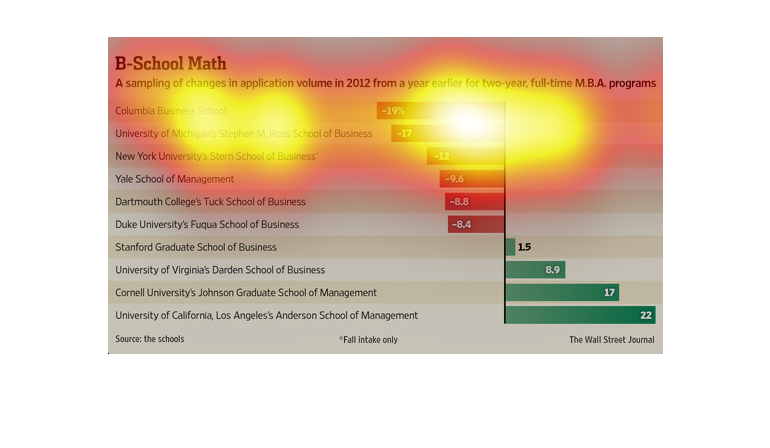
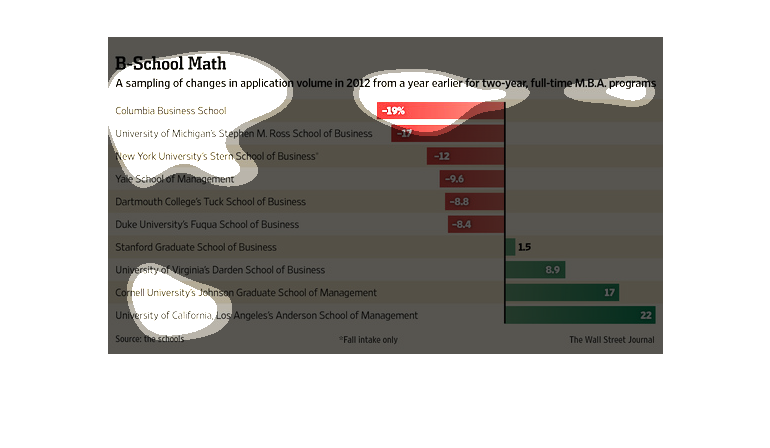
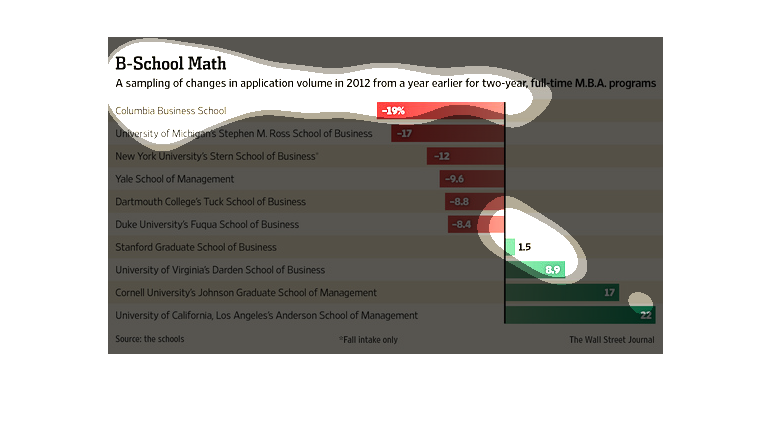
The graph shows the changes in the application rates for 2 year MBA programs at several universities.
 Columbia Business school has had the largest decrease at 19%, followed by a 17% decline at
Michigan State, New York University dropped 12%, -9.6% for Yale, -8.8% for Dartmouth, -8.4%
for Duke.  Conversely had and increase of 1.5%, University if Virginia gained 8.9%, Cornell
was up 17%, and the largest increase was University of California at a 22% increase.
A chart of the changes in application volume for many high end universities within the U.S.
The graph shows a sharp decline for the majority of colleges but a great increase for a few.
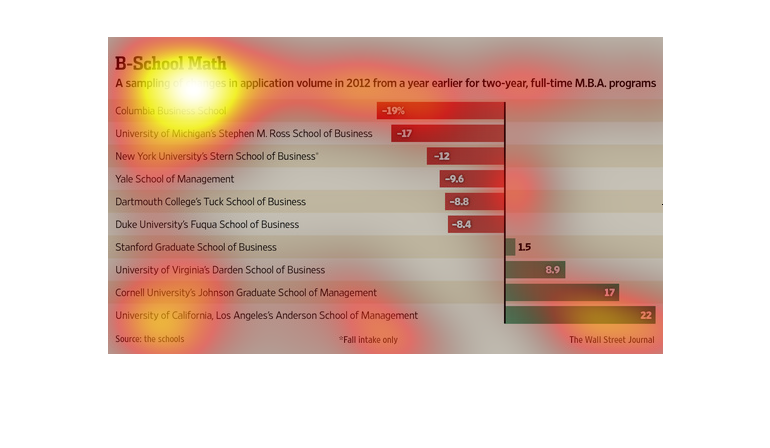
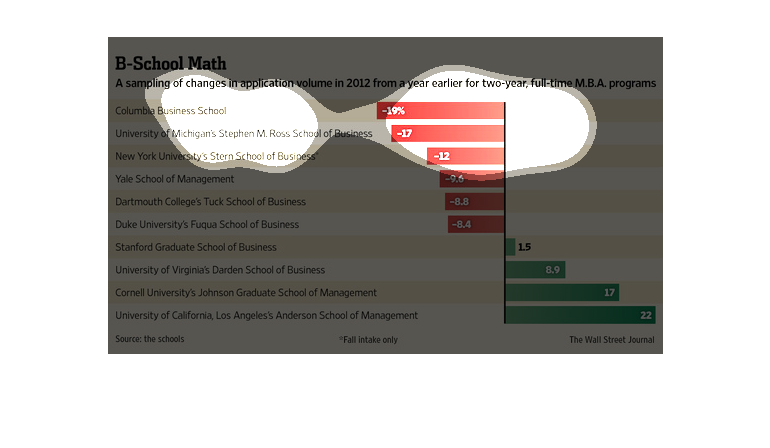
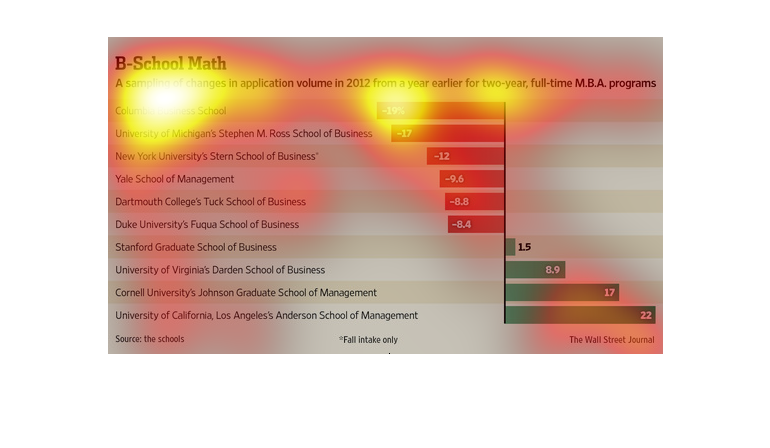
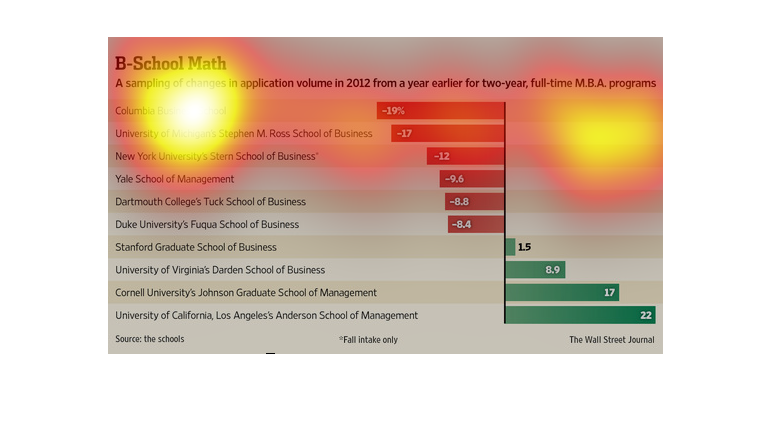
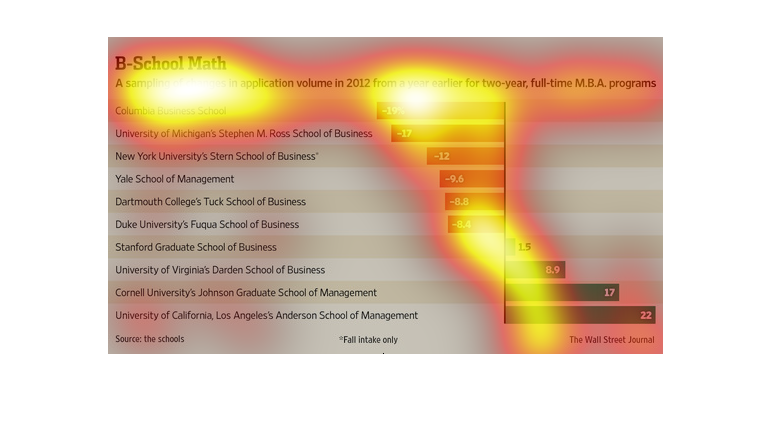
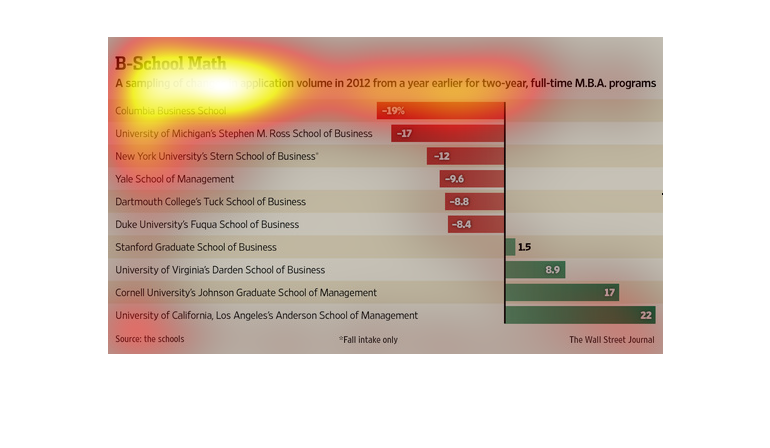
The graph shows fall applications to two year M.B.A programs to 10 universities. 6 Universities
have had an 8.4 to 19% drop in applications. 4 have had  a 1.4 to 22% increase.
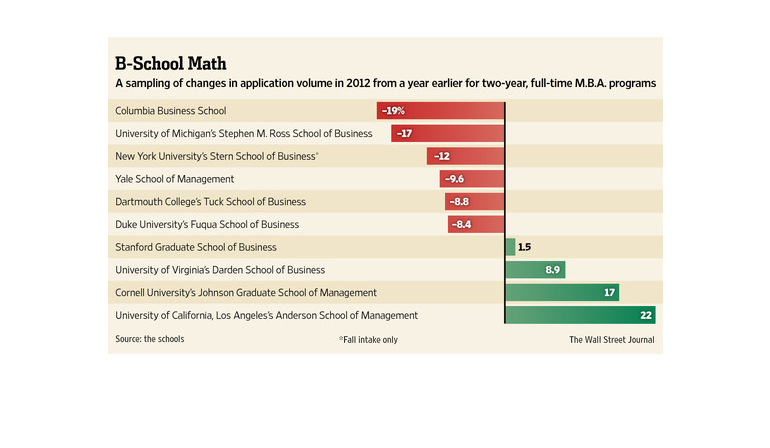
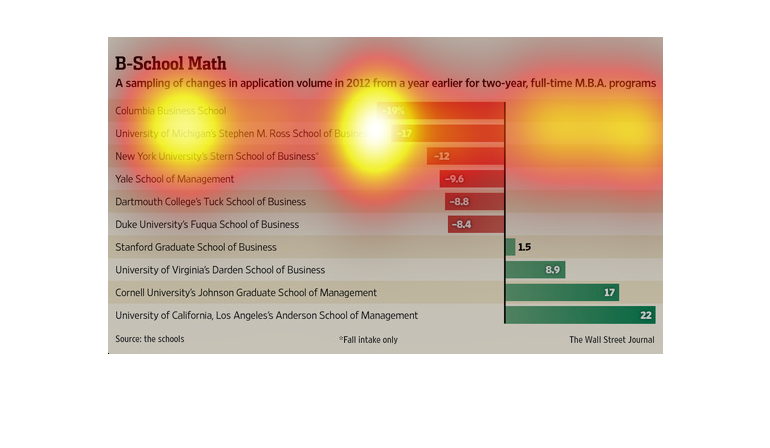
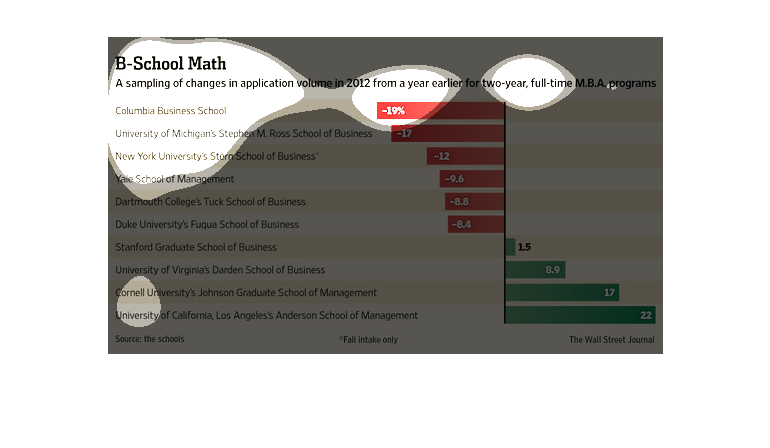
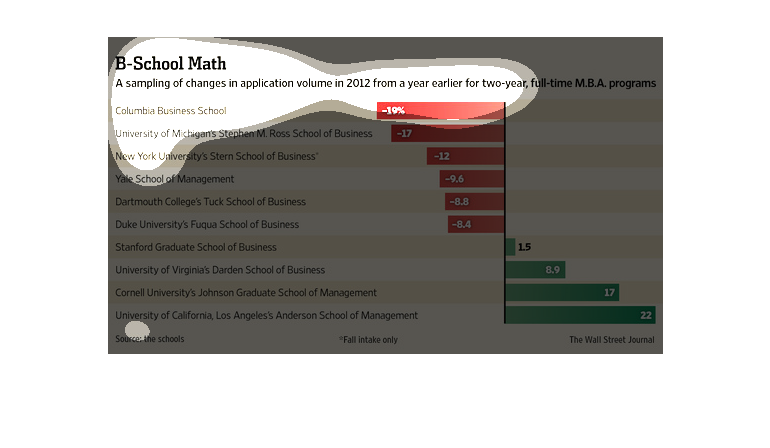
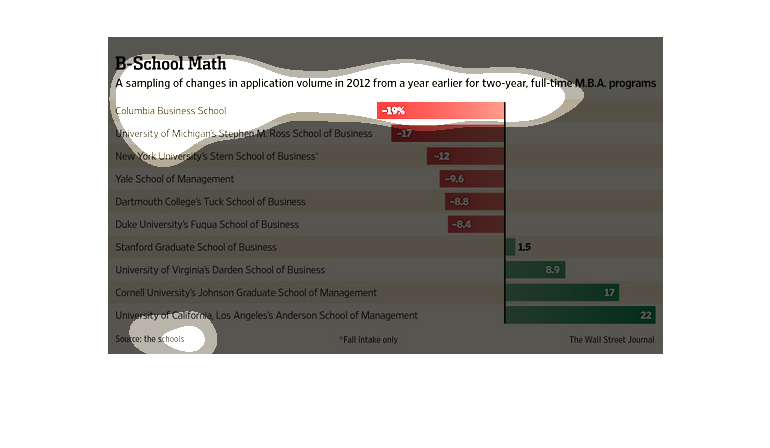
This chart describes B school math. Specifically, a sampling of changes in application volume
in 2012 from a year earlier for two-year, full time M.B.A. programs.
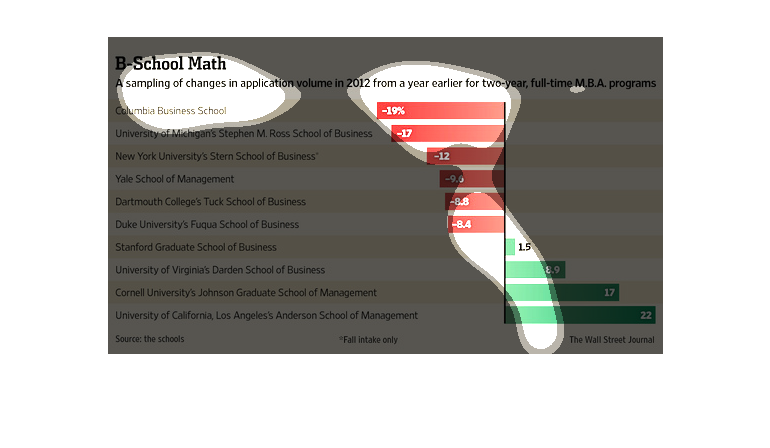
A sampling of students in a math group from graduate schools across the country regarding
changes in application rates during the 2012 school year to the next year. Negative were in
red, positive in green.
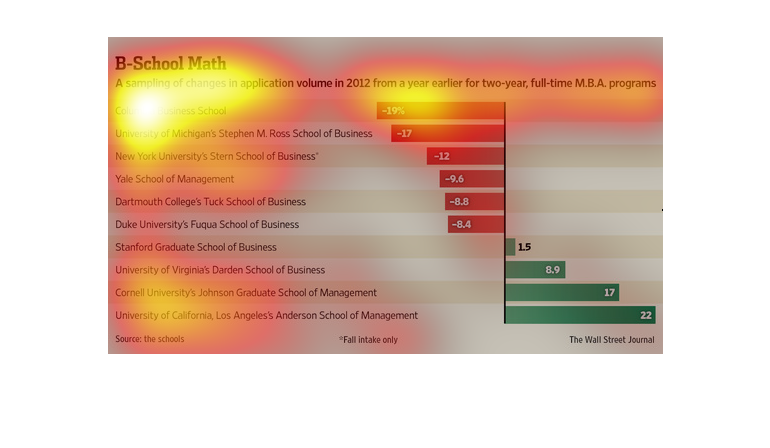
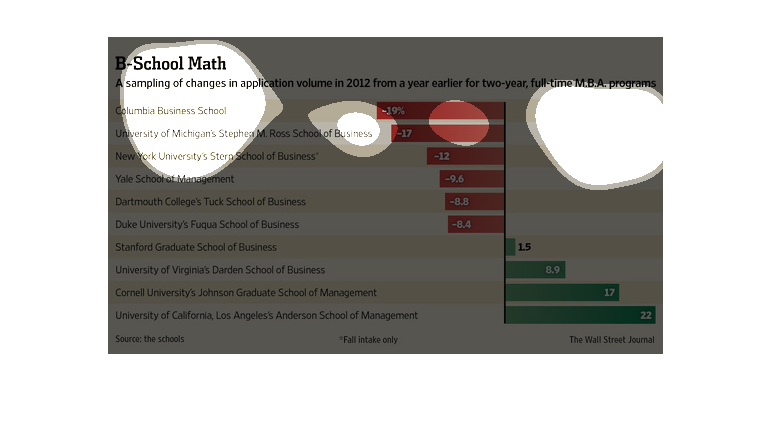
The image depicts a sample of changes in application volume in 2012 from a year earlier for
two years, full-time MBA programs. A slight majority of academic institutions have seen a
decrease, with a slight minority seeing an increase.
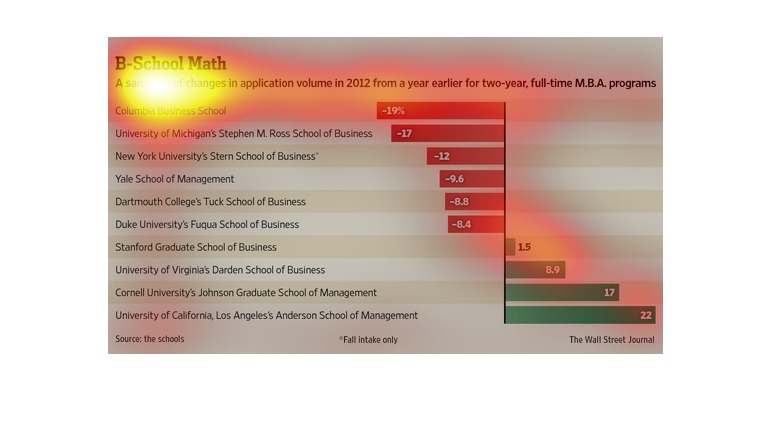
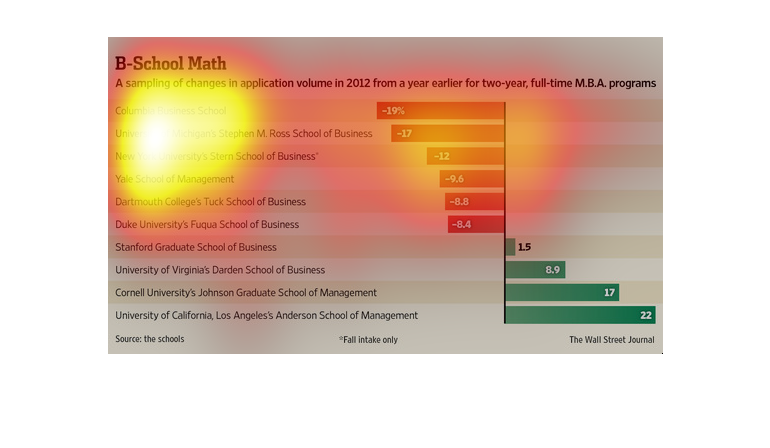
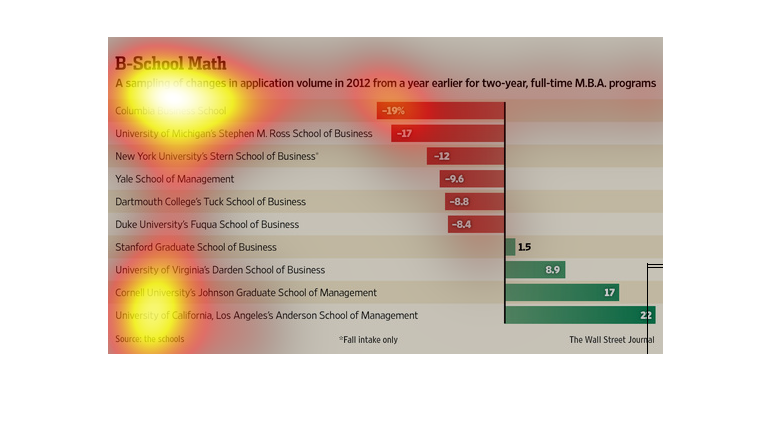
B school math, a sampling of change in application volume in 2012 from a year earlier for
two year, full time M.B.A. programs. The schools included in the sample show as much a 25%
decrease. WIth only three of the schools in the sampling seeing and increase.
This image provides a report showing B-School Math results. In this image we also read about
a sampling of the changes in application volume for an MBA from 2012. This image will also
list at least ten schools that offer MBA programs.
The following chart shows the increase and decrease of number of MBA applicants each year
for the various universities. The numbers per the two year span do not fluctuate much.
This chart shows the decline in applications to certain college's MBA programs compared to
the year prior. Showing the decline in many Ivy League schools.
THIS INFORMATIONAL GRAPH SHOWS A REPRESENTATIONAL SAMPLING OF A CHANGE IN APPLICATION VOLUME
IN 2012 FROM A YEAR EARLIER FOR TWO-YEAR, FULL TIME M.B.A. PROGRAM.