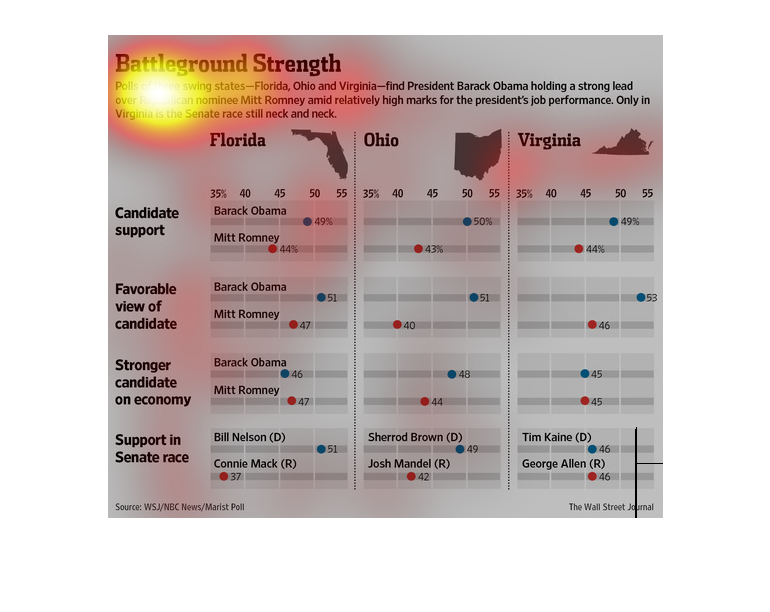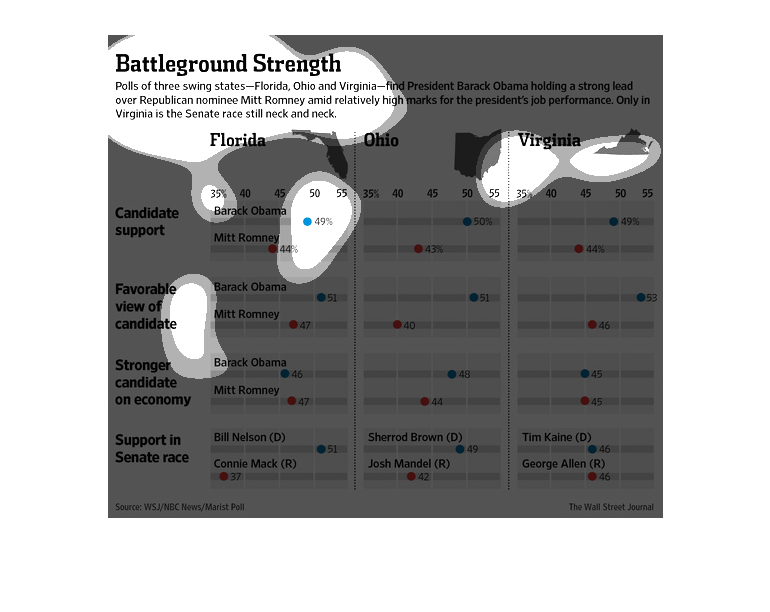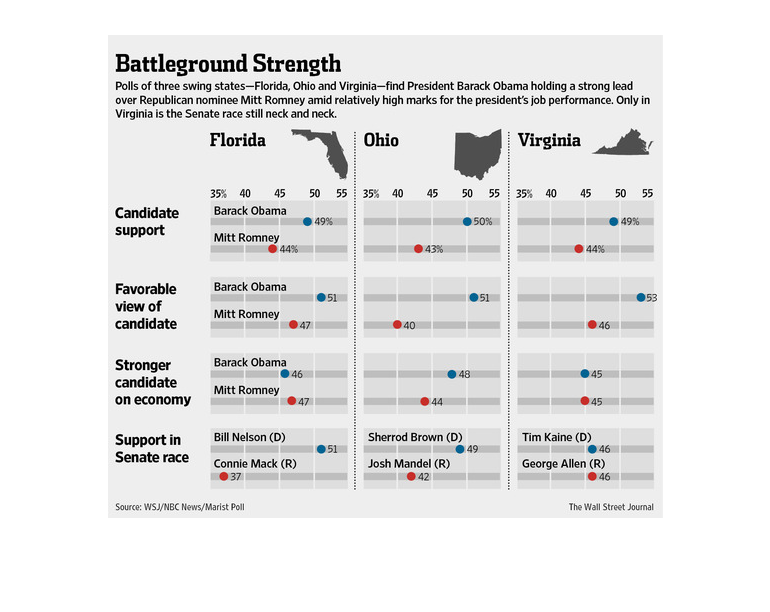
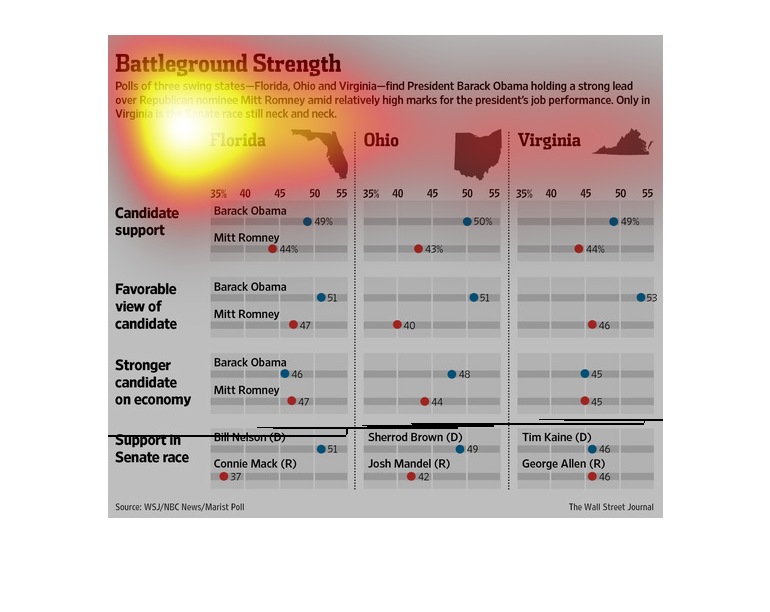
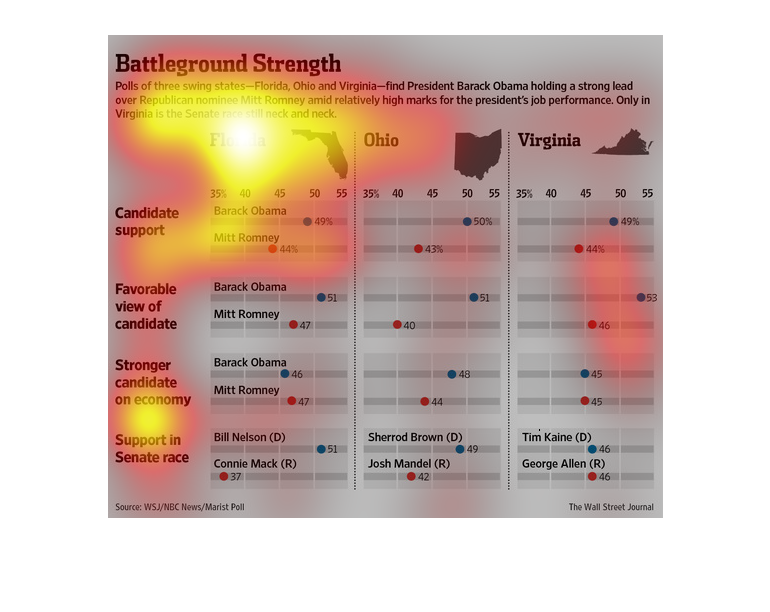
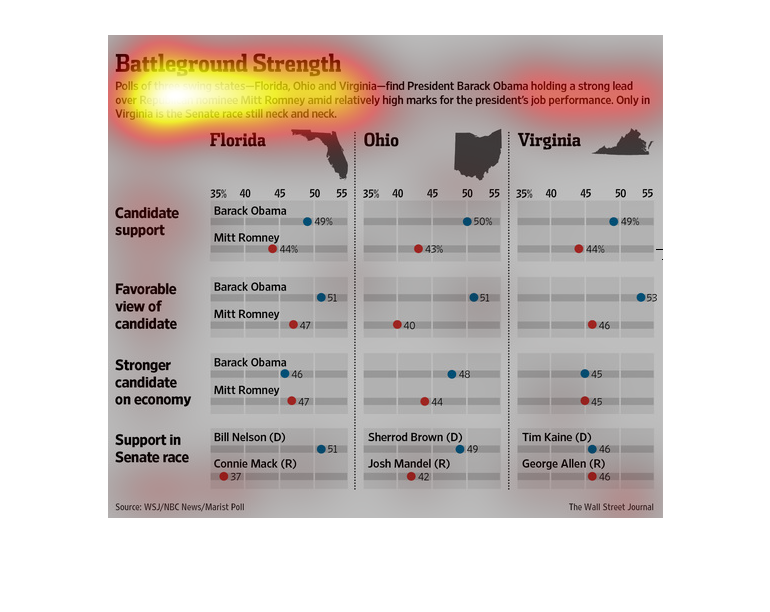
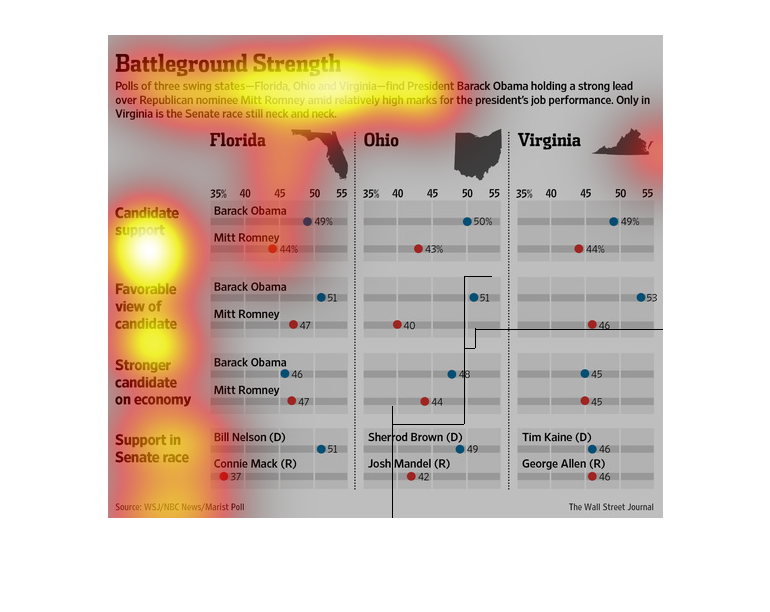
This chart describes battleground strength. Specifically, polls of three swing states - Florida,
Ohio, and Virginia - find President Barack Obama holding a strong lead.
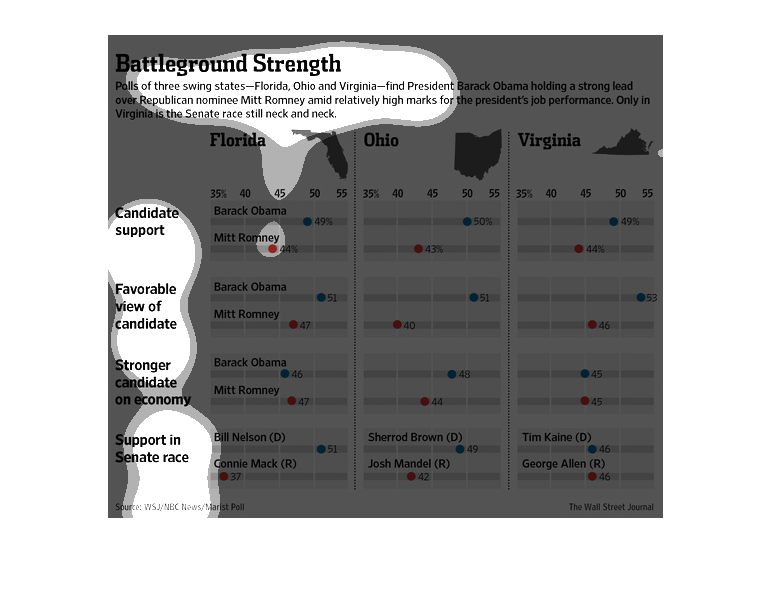
This chart shows the battleground statistics of outcomes in elections from the states of Virginia,
Florida, and Ohio. It goes as far as canidate support, and votes.

image is measuring the quality of candidates for perhaps a job or student residency.  seems
most are qualified from Florida, less from ohio, and less from virginia
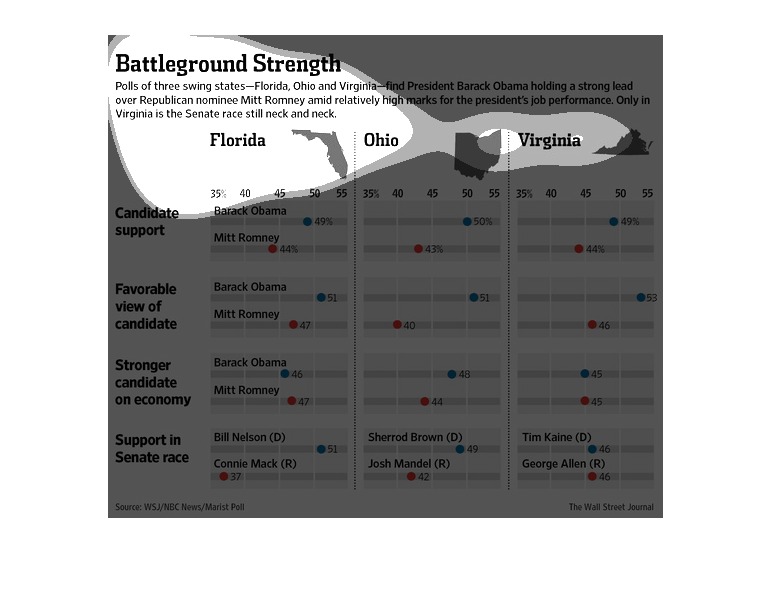
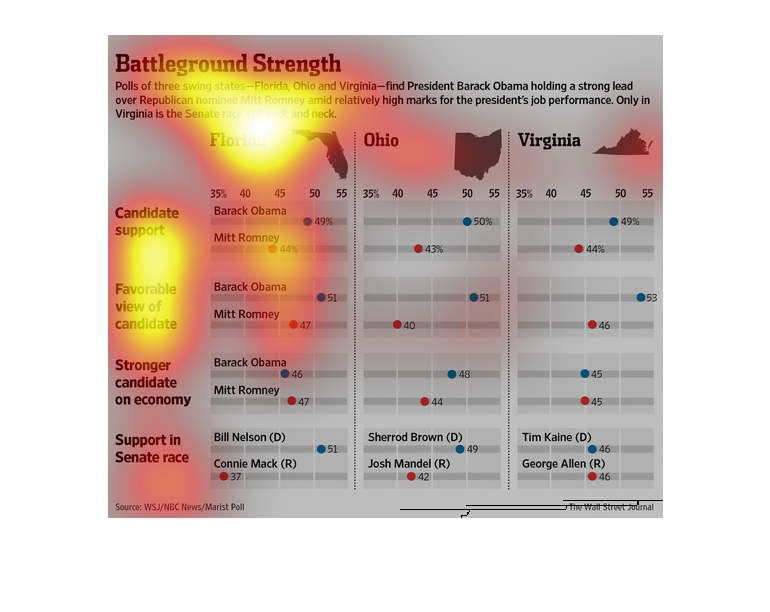
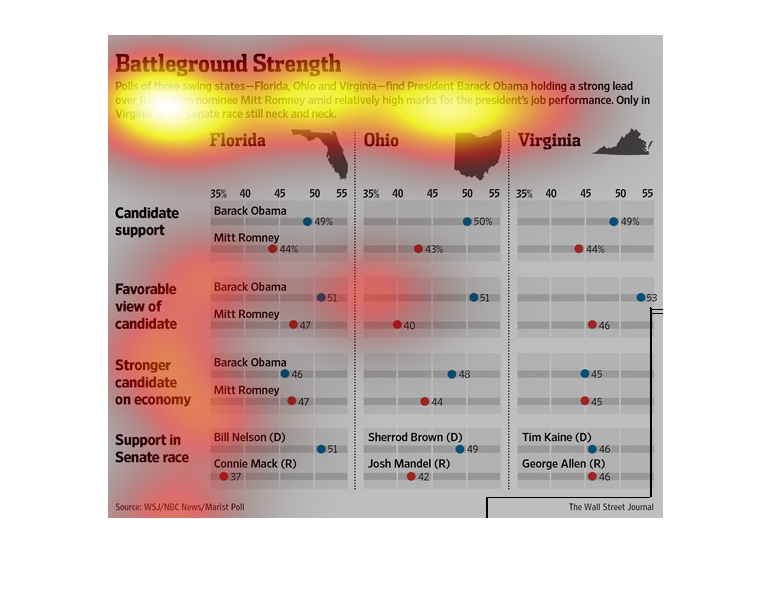
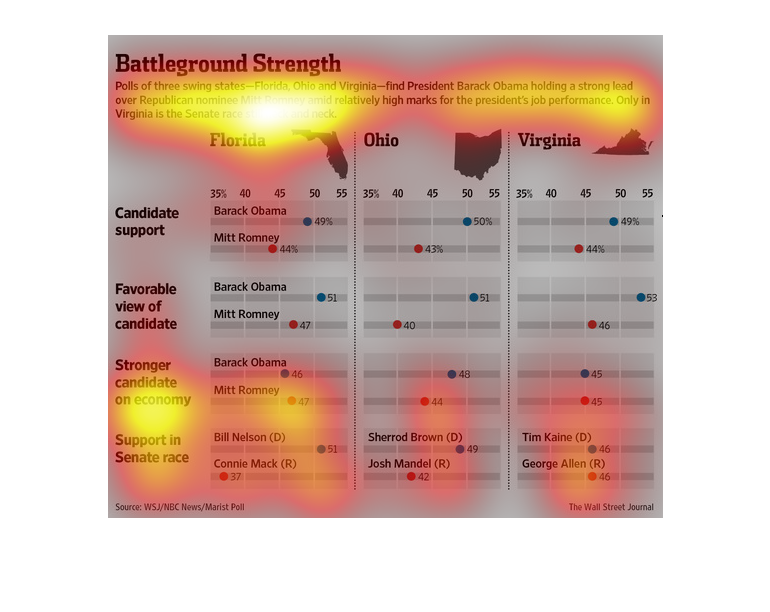
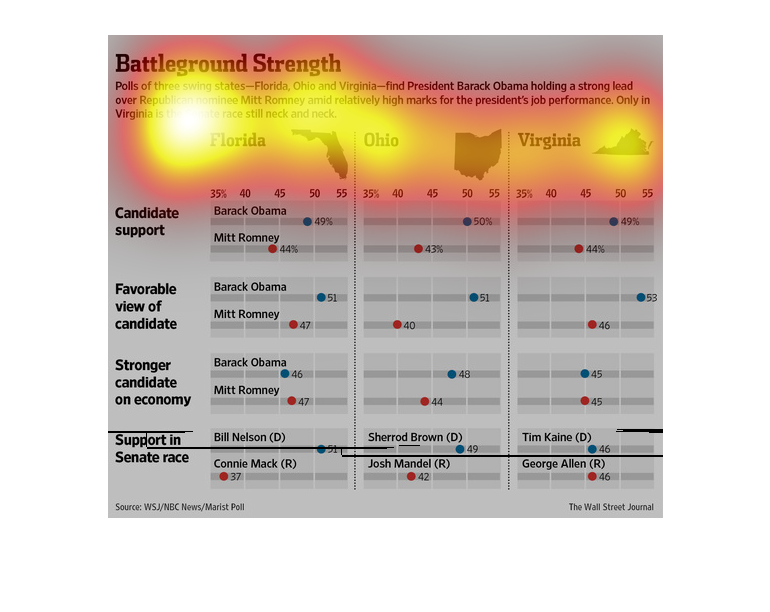
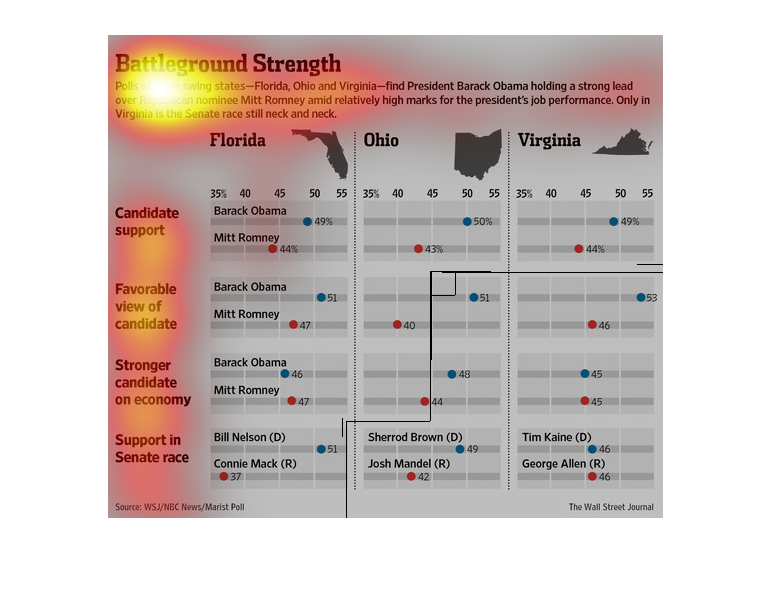
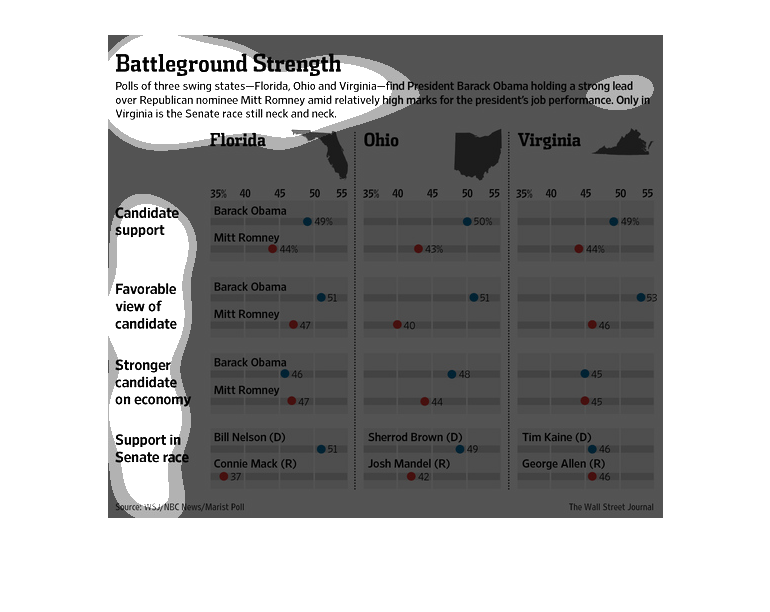
This chart describes the presidential race between Barack Obama and Mitt Romney among 3 swing
states: Florida, Ohio, and Virginia.  The chart uses categories such as candidate support,
favorable view of candidate, stronger candidate for economy, and support in Senate race.
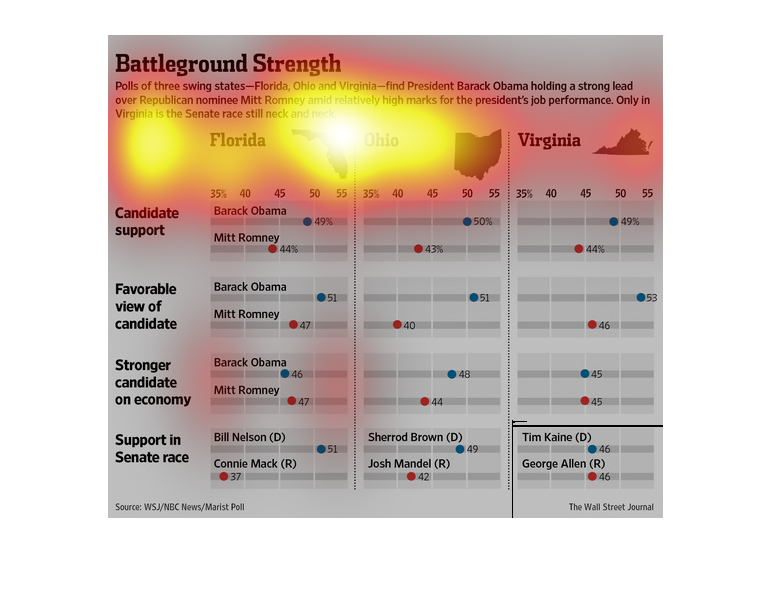
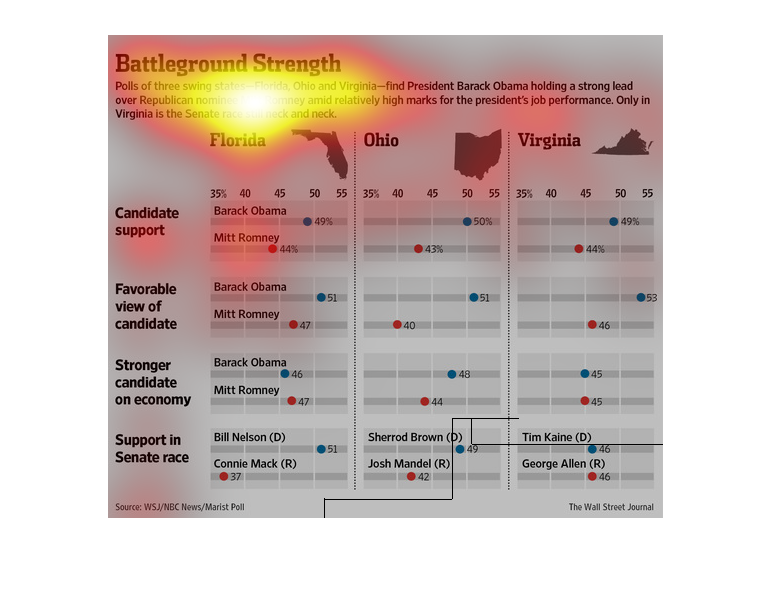
This is a series of charts depicting polls in three battleground states- Florida, Ohio and
Virginia- found that Barak Obama held a strong lead over Mitt Romney.
This is a series of charts depicting the results of polling data in three states- Florida,
Ohio and Virginia- and how they were looking in terms of the 2012 presidential election.
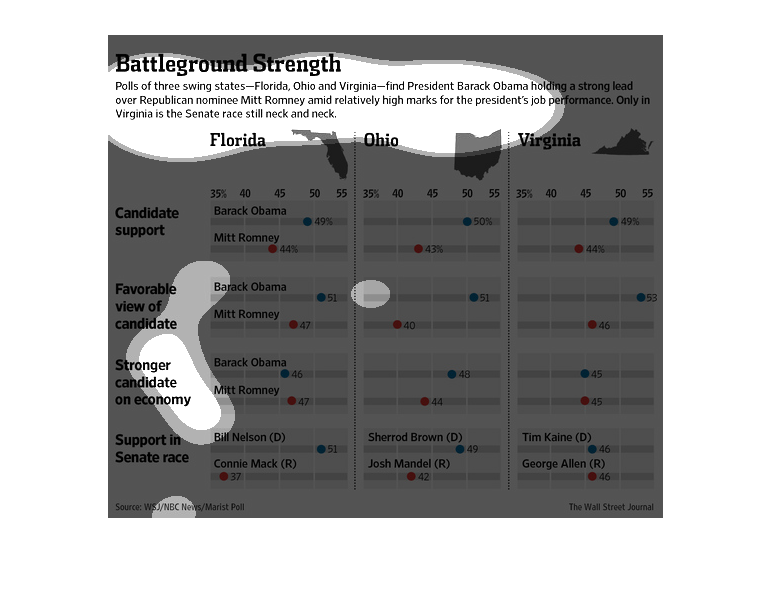
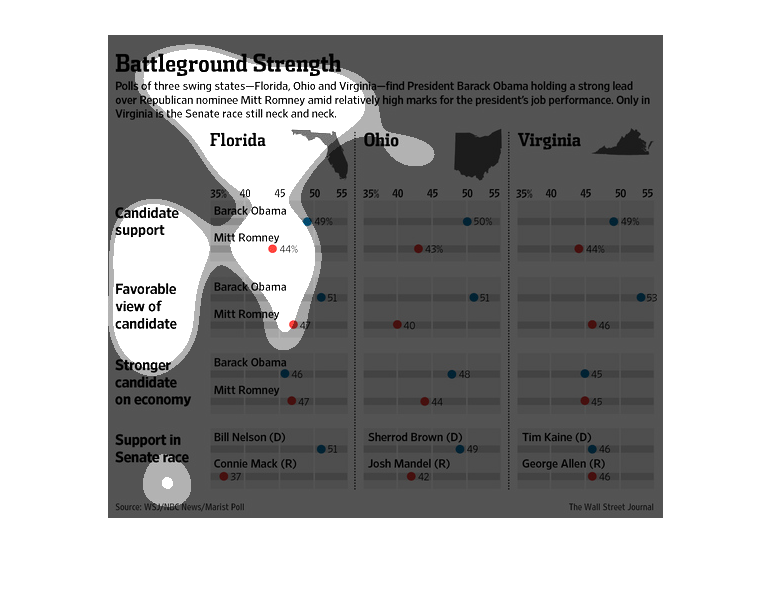
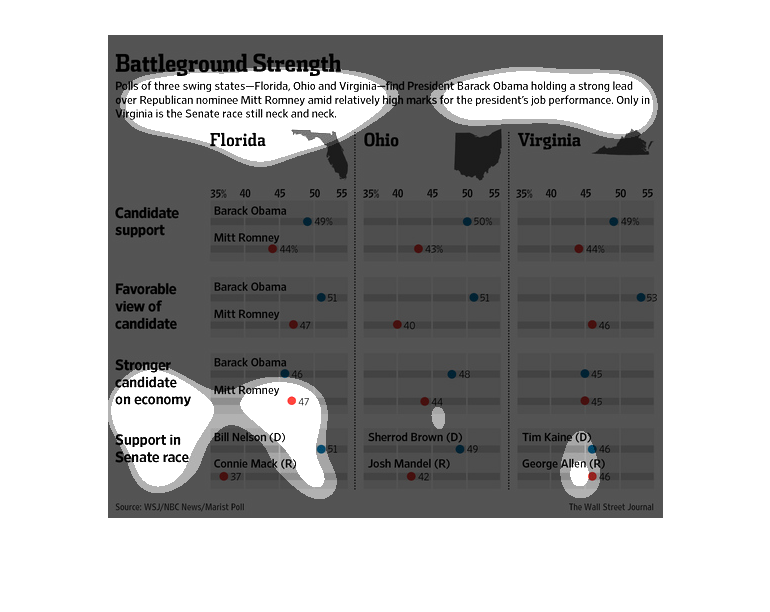
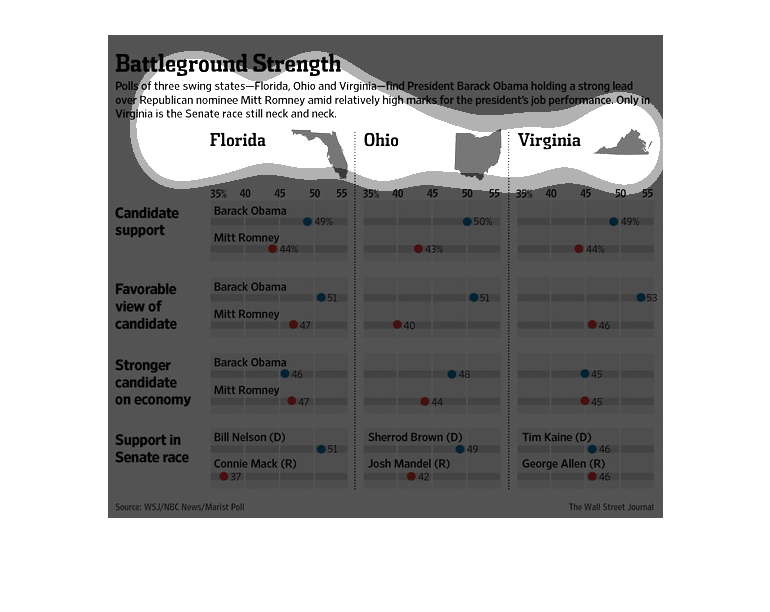
This graph describes the relative strength of the campaigns of Obama VS Romney in Florida,
Ohio and Virginia. Florida tended to support Obama on all issues except the economy. Ohio
leaned towards Obama on all issues. Virginia supported Obama on the economy but was overall
divided in their support of the two campaigns.
This chart shows presidential polling results for three swing states: Florida, Ohio and Virginia.
 President Obama holds a strong lead over republican nominee, Mitt Romney, in areas of candidate
support and favorable view of candidate.  The char also shows the Senate race, with the democrats
leading in Florida and Ohio and tied in Virginia.
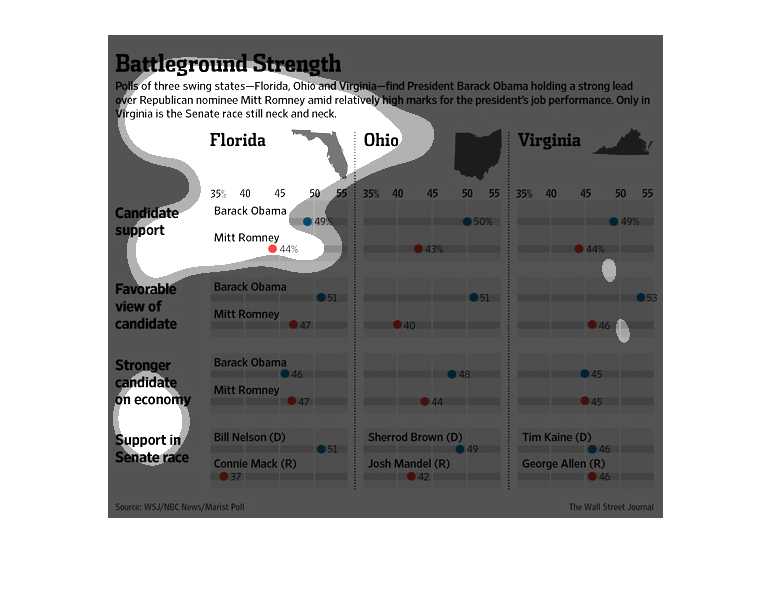
The image title is "Battleground Strength" and it depicts election results between Mitt Romney
and Barack Obama in the states of Virginia and Florida. The first category in the graph is
Candidate Support.
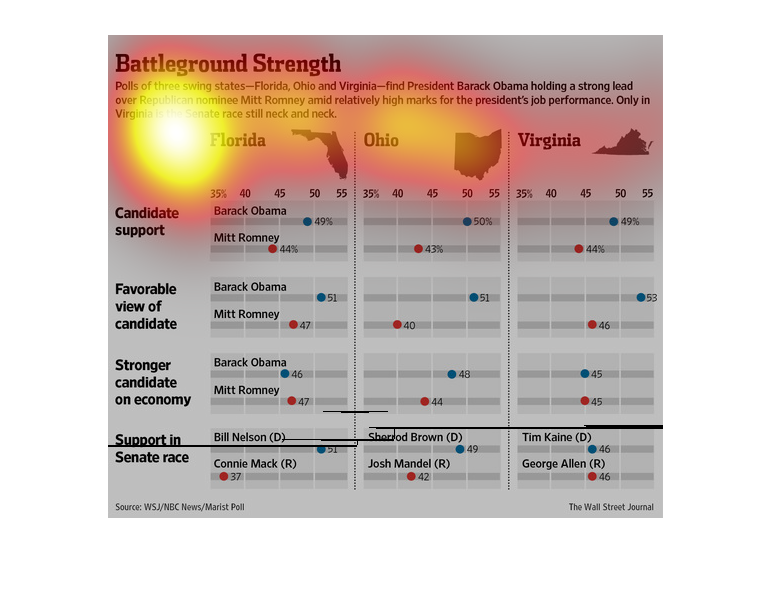
This is an article regarding the presidential election and where the swing states are going.
Three swing states, Florida, Ohio, and Virginia give Obama a strong lead.
This is a political chart of the three "battleground" states. This is in reference to the
Obama victory over Mitt Romney. It goes over the candidate support on different topics.
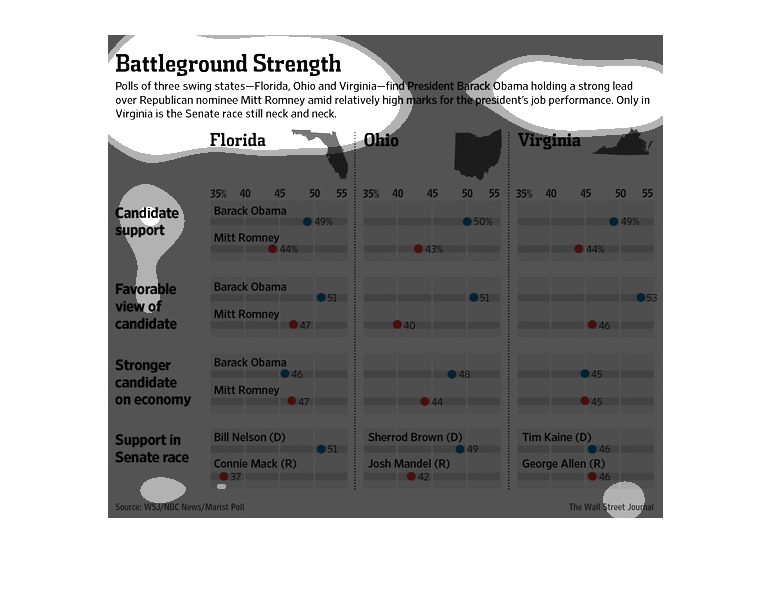
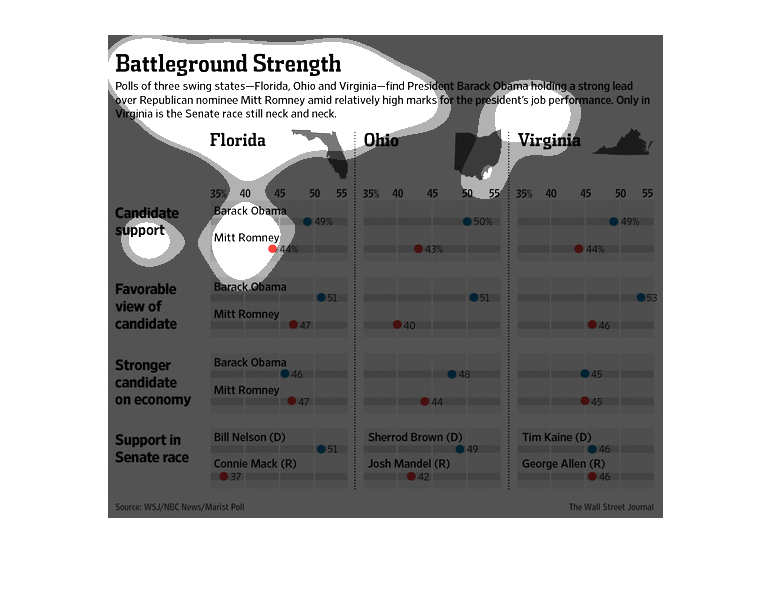
This has details for the Romney Obama presidential election in Florida, Ohio, and Virginia
including candidate supported, favorable view of candidates, stronger candidate on economy,
and support in Senate race in each state.
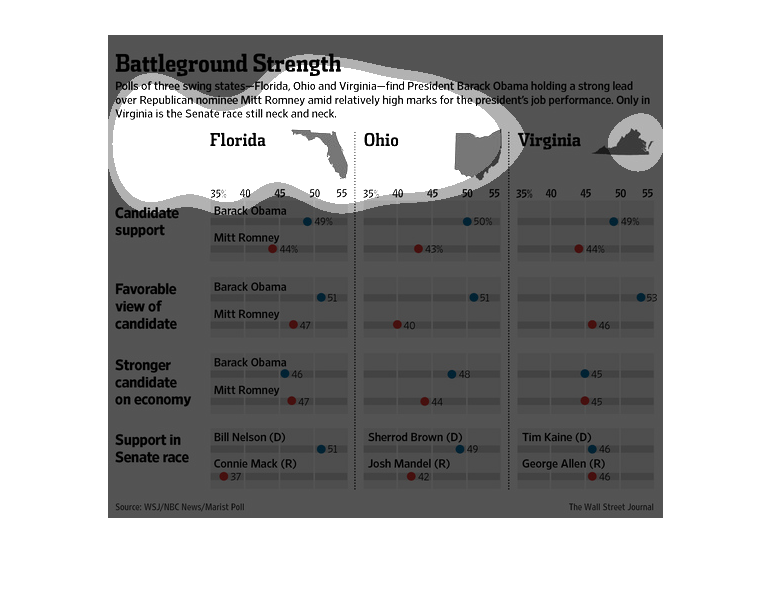
This chart describes battleground strength. Specifically, polls of three swing states -  Florida,
Ohio, and Virginia - find President Barack Obama holding a strong lead over Mitt Romney.
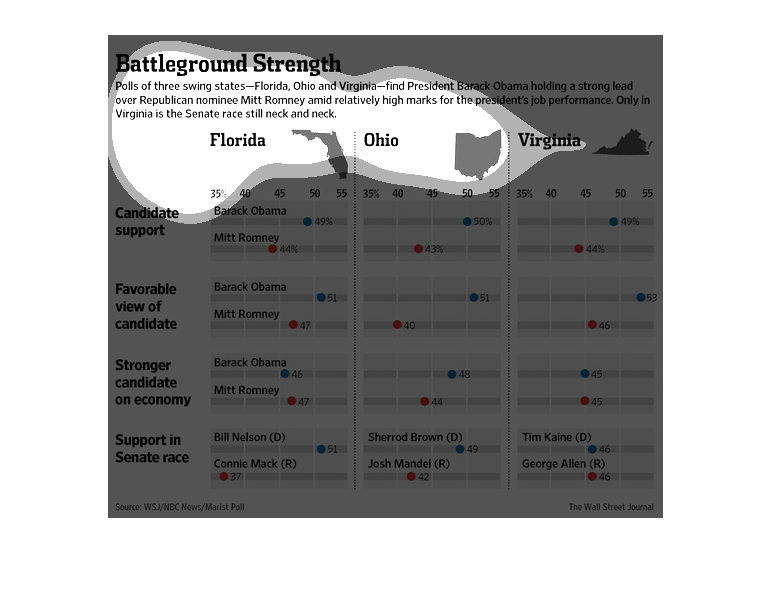
This chart represents simple breakdown of poll of current president Barack Obama. It has 4
categories which are: candidate support, favorable view of candidates, strangers candidate
on economy, and finally, supporter in senate race.
The illustration is trying to inform us about the swing states, and how super important they
are when it comes to Presidential Elections. The candidates really have to focus on those
states.