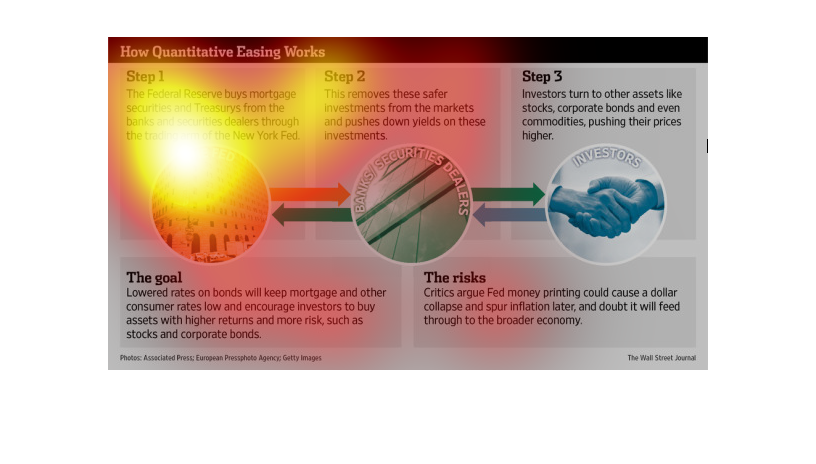
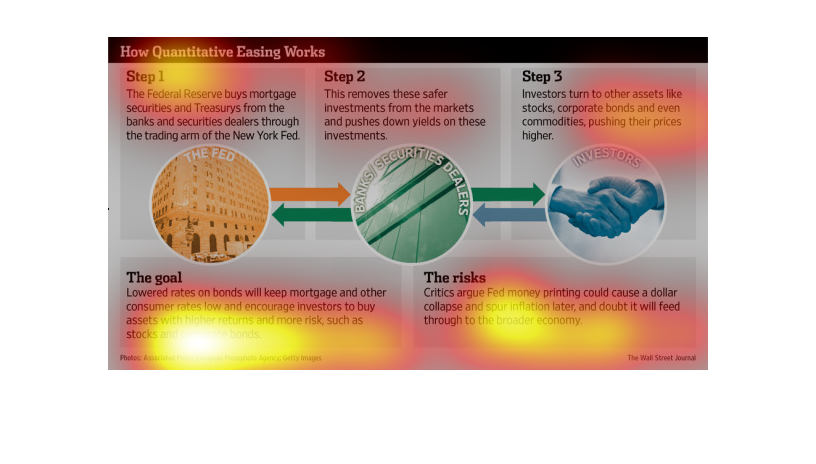
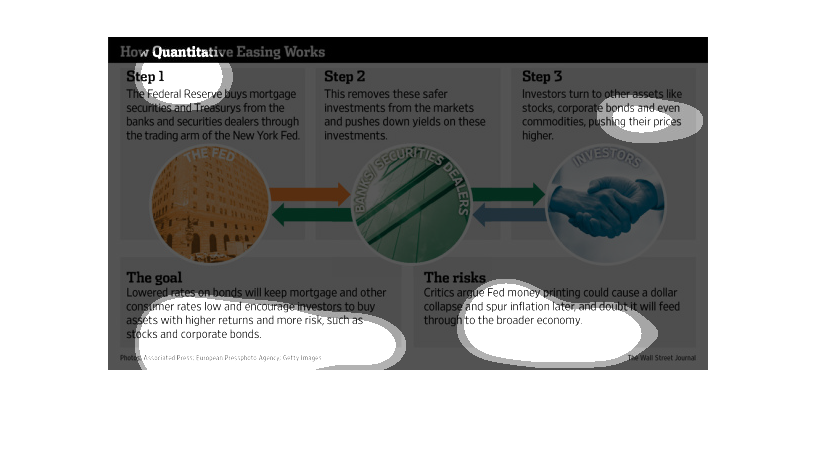
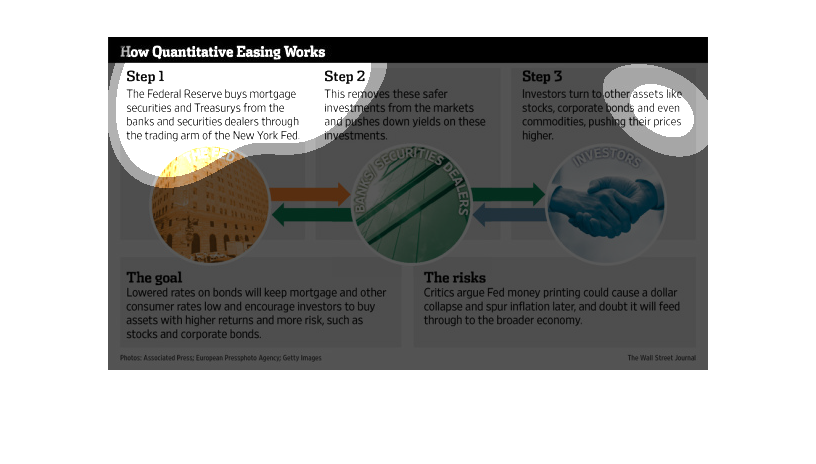
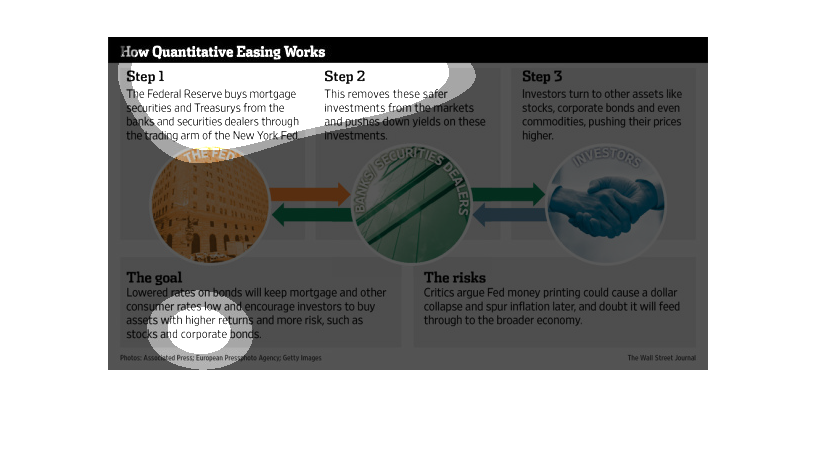
The image shows hoe quantitative easing works and the steps that have to take place. It also
gives an image as an example and explains the goal and risk that are involved.
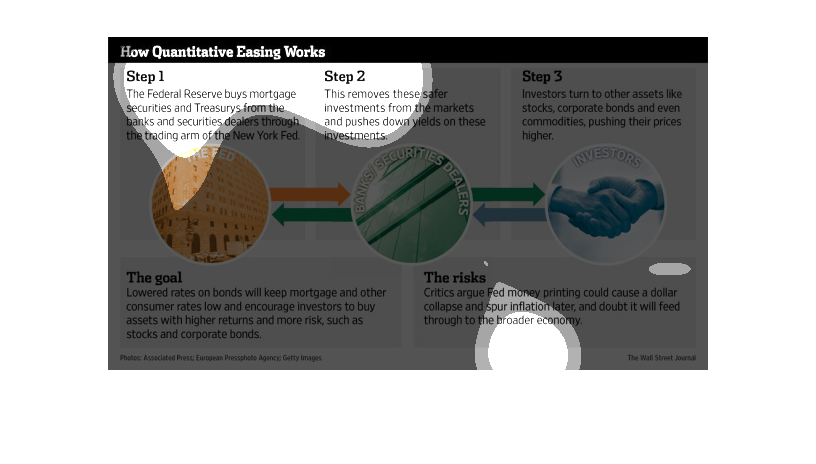
This is a graphical representation along with associated statistics depicting how quantitative
easing works in three broad steps. The goal of this easing is to lower that rates on bonds.
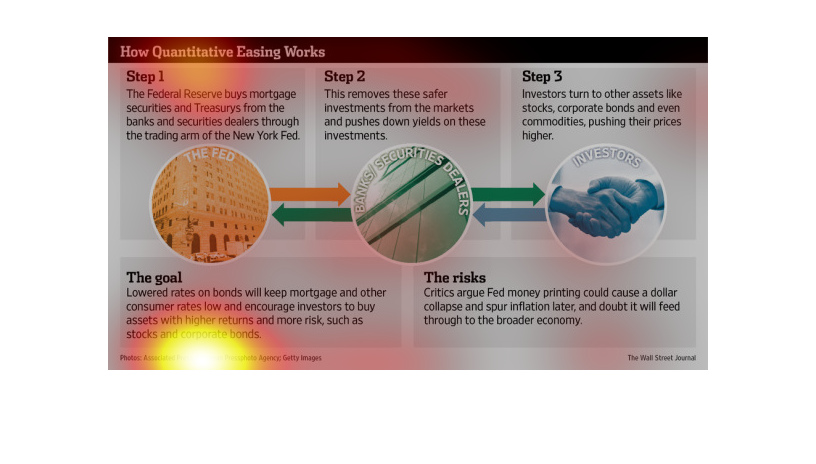
The graph is titled " How quantitative easing works" and describes of the process. Aside from
the steps of the process, the image assesses the goals and risks of the process.
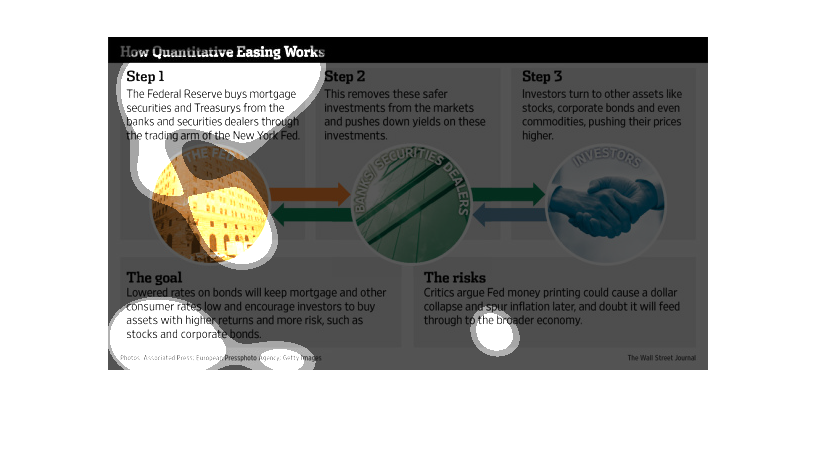
This chart describes how quantitative easing works. Specifically, this moves these safer investments
from the markets and pushes down yields on these investments.
The image depicts the process by which quantitative easing works. The data shows how QE starts
with the federal reserve taking certain actions to purchase mortgages, thereby pushing investors
to act accordingly,
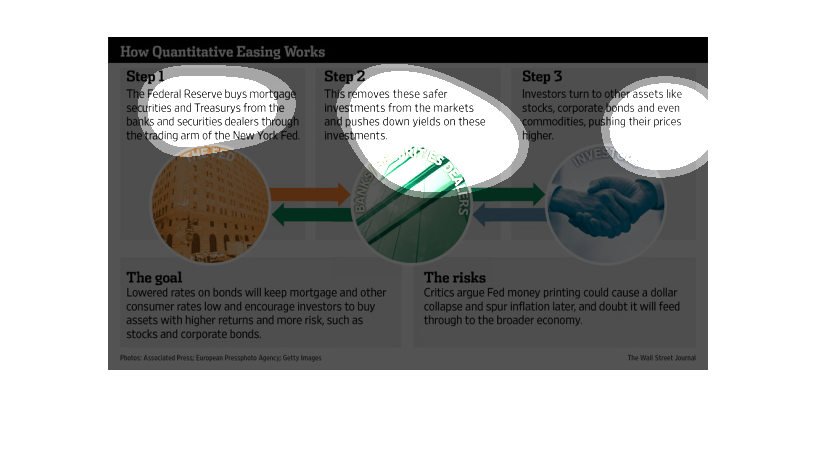
This chart shows how quantitative easing works.  The goals are lower rates on bonds to keep
mortgage and other consumer rates low and encourage investors to buy assets with higher ventures.
This chart describes how quantitative easing works. Specifically, lowered rates on bonds will
keep mortgage and other consumer rates low and encourage investors to buy assets with higher
returns.
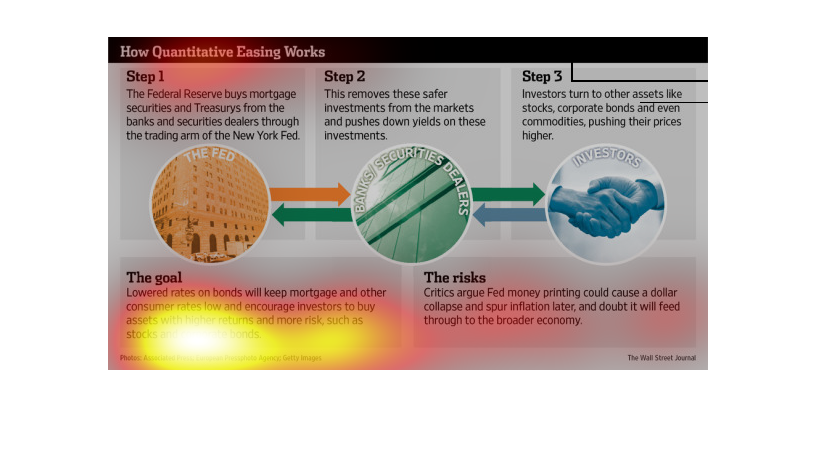
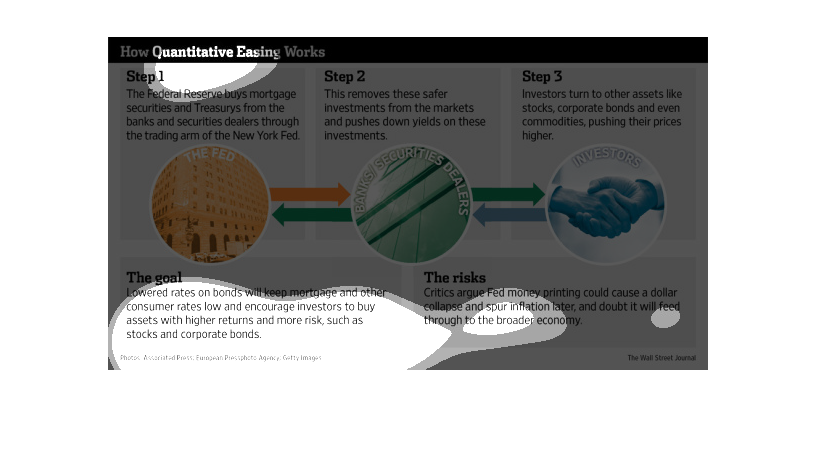
The image depicts the process by which quantitative easing works. Starting with the federal
reserve buying mortgage securities and treasurys, to pushing down yields, to forcing investors
onto other things like stocks, corporate bonds, and commodities.
This is a step by step diagram of how quantitative easing works. There are three distinct
steps in the process of quantitative easing that are shown .
This is a chart with many descriptions in order saying how quantative easing works. there
is also a small chart with pictures to help show this information better.
Real estate is a hot topic among the nightly newscasters, and in this graphic we see the step
by step process of quantitative easing, and how to be able to do it right.
This chart is titled how quantitive easing works. It shows visually how the process works.
 For each picture there is a paragraph above explaining the process.