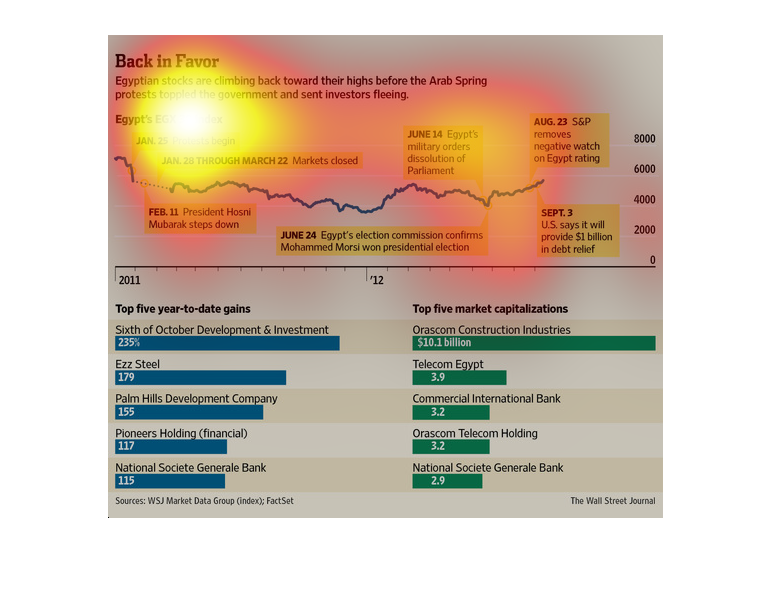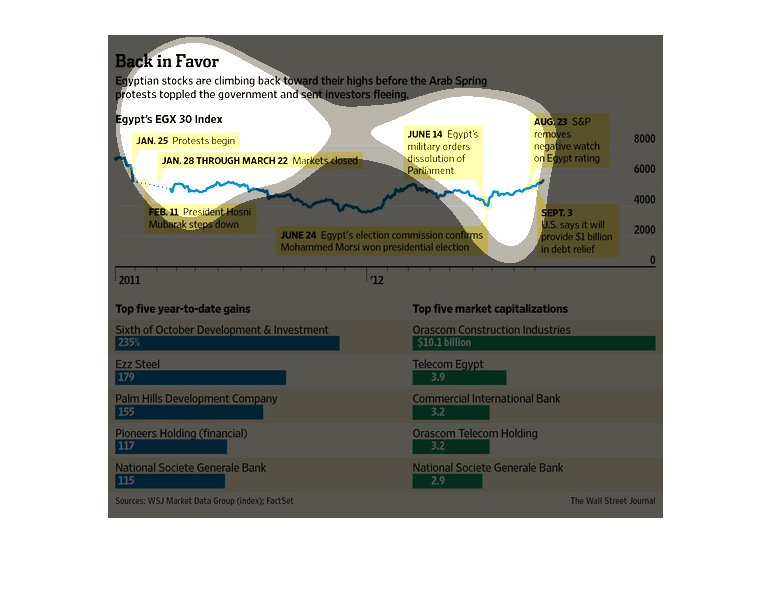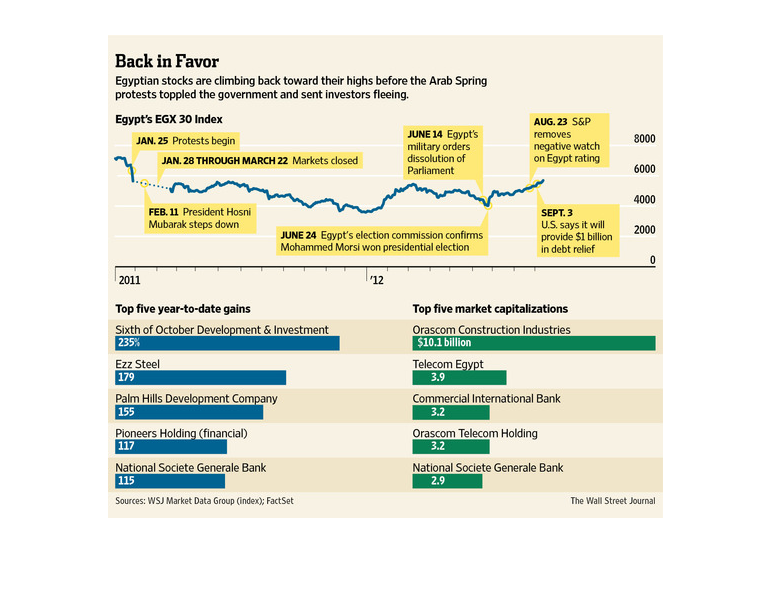
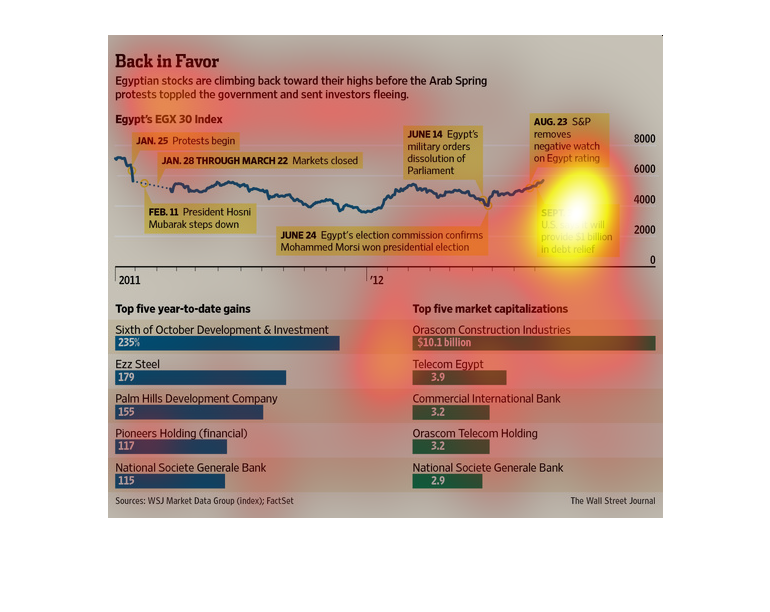
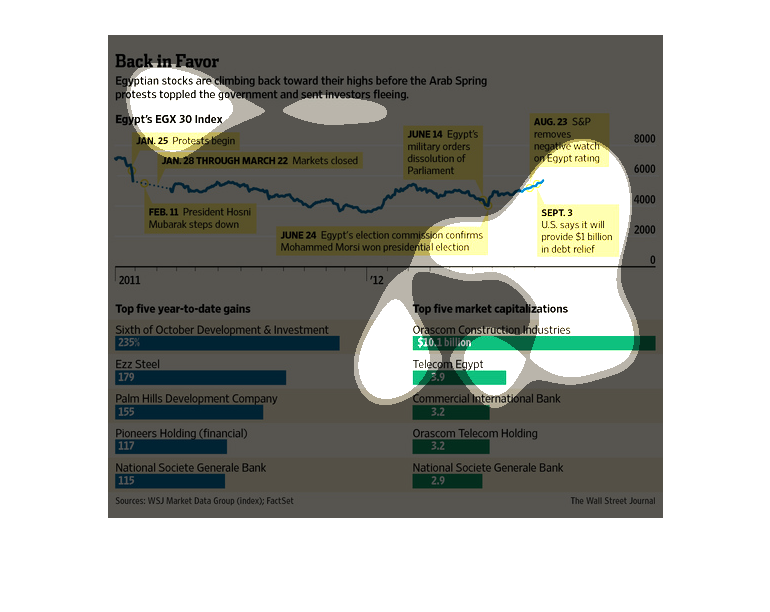
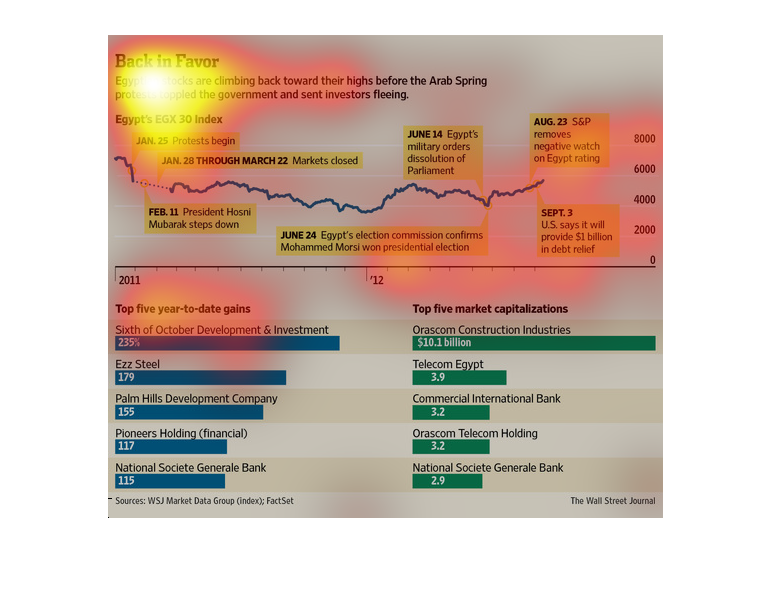
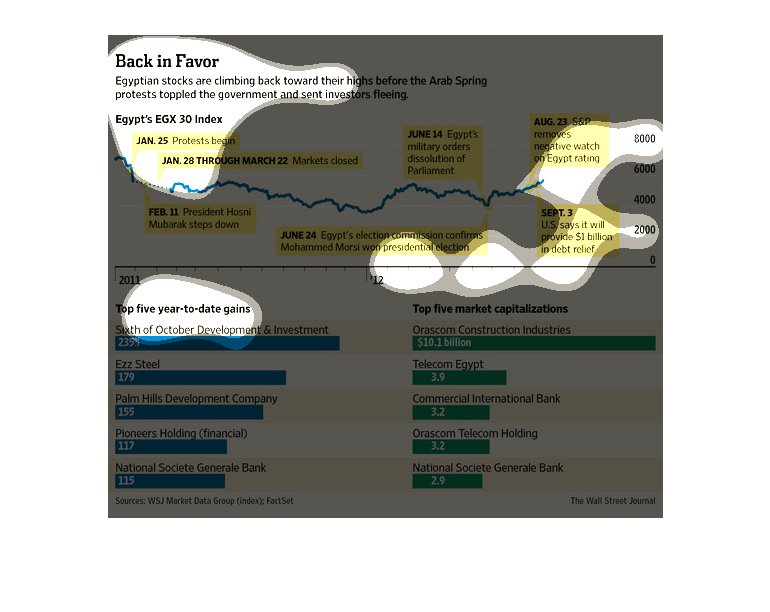
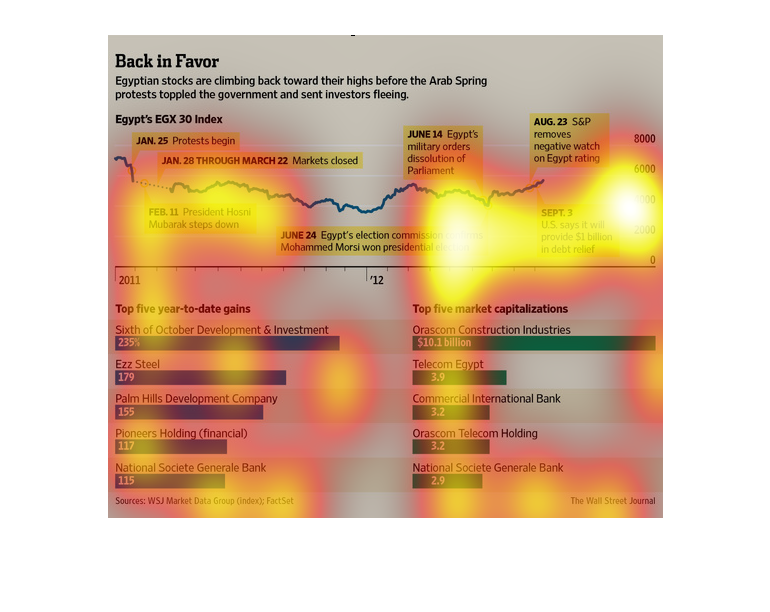
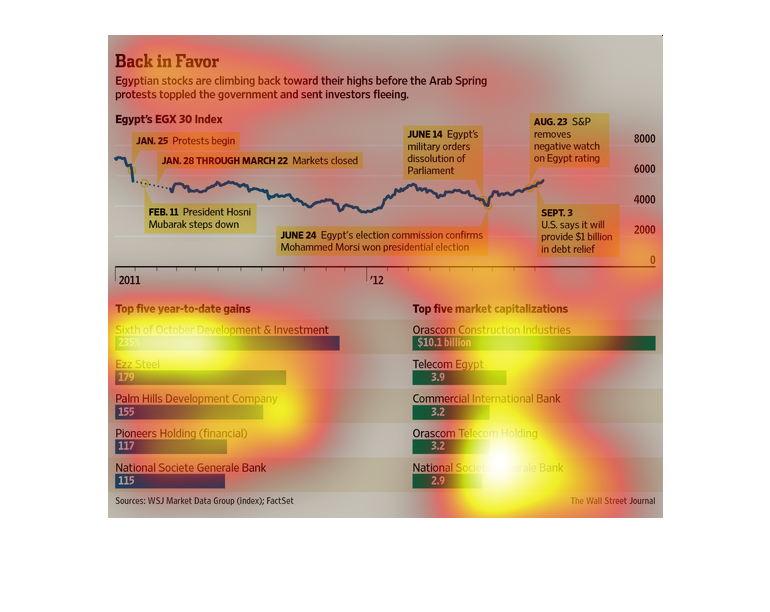
The image depicts how Egyptian stocks are climbing back toward their highs before the Arab
Spring protests overthrew the government and sent investors running away. Once governmental
stabilization occurred, stocks strengthened and more US aid was provided.
This is a series of graphs and charts depicting the Egyptian stocks are climbing back toward
their highs before the Arab Spring toppled the government.

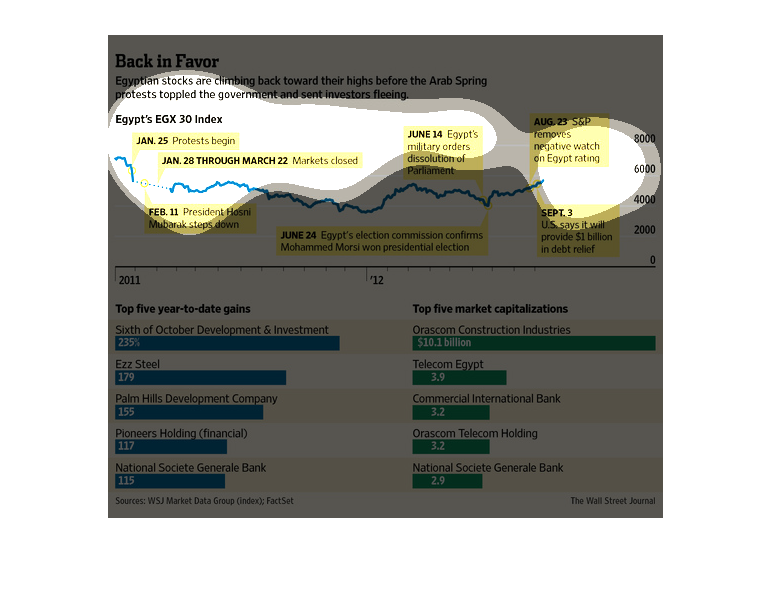
This graph is about the rise of Egyptian stocks post Arab Spring protests. The top graph shows
years on the x axis and index(?) on the y axis. The yellow boxes provide significant political
moments in time that have affected Egyptian stocks, but shows an overall steady growth post
2012. The bottom blue chart shows the "top five year to date gains" and the bottom green chart
shows the "top five market capitalizations.
 It has to do with Egypt and parliaments and stacks.  It is a timeline of events involving
the government and stacks  it has top five games in the last five years and market capitalization
The Wall Street Journal informs that now is a good time to invest in Egyptian stocks because
they are now at the top and they have a great return waiting for those that are willing to
invest.
The following chart shows that stocks in Egypt have recovered from their losses that occurred
during the mass government protests and that it the coutries market has been taken off the
negative watch list by S&P.
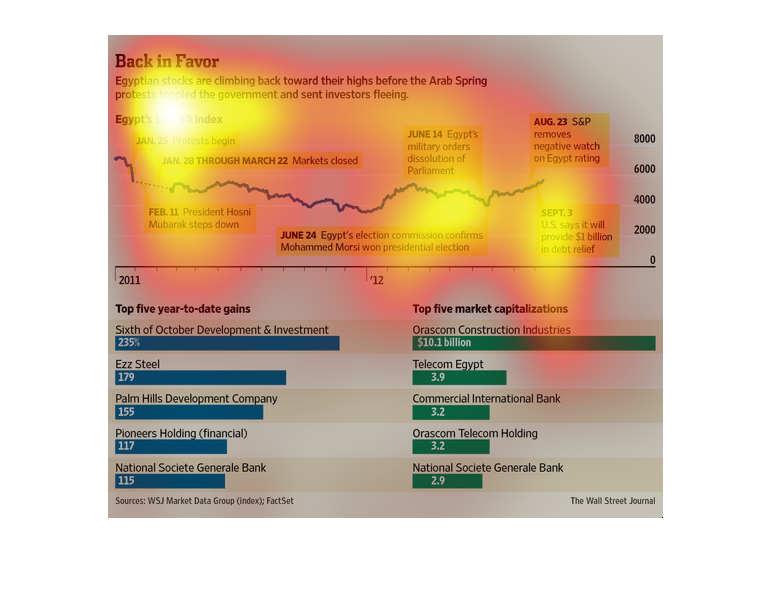
This chart describes back in favor. Specifically, Egyptians stocks are climbing back toward
their highs before the Arab Spring protests toppled the government.
The following chart showed how the Economy and stock market in Egypt where starting to recover
after the long government protests and the Arab Springs Subsided.
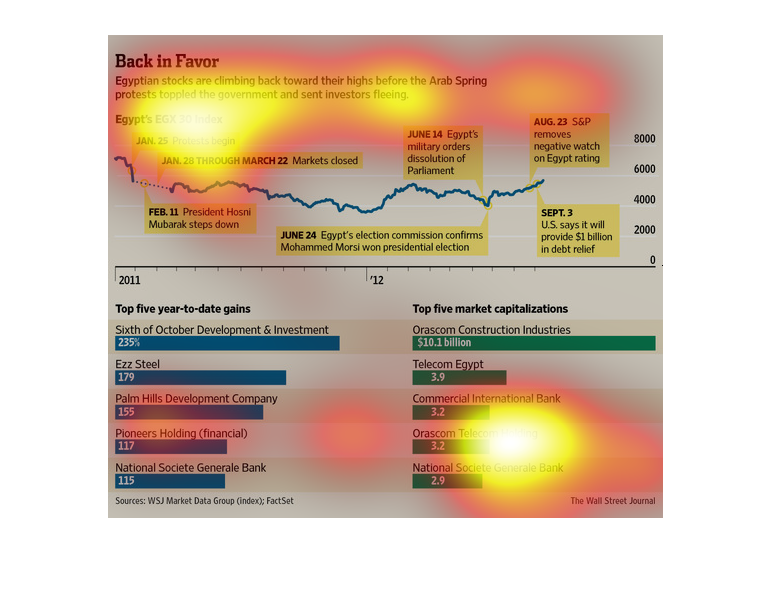
This is a series of charts and graphs with related statistics depicting that Egyptian stocks
were climbing back toward their highs prior to the Arab Spring.
The image is titled "Back in Favor" and describes the rise of Egyptian Stocks in recent times.
The image displays the EGX 30 Index, top five market capitalizations,and  top five year-to-date
gains.
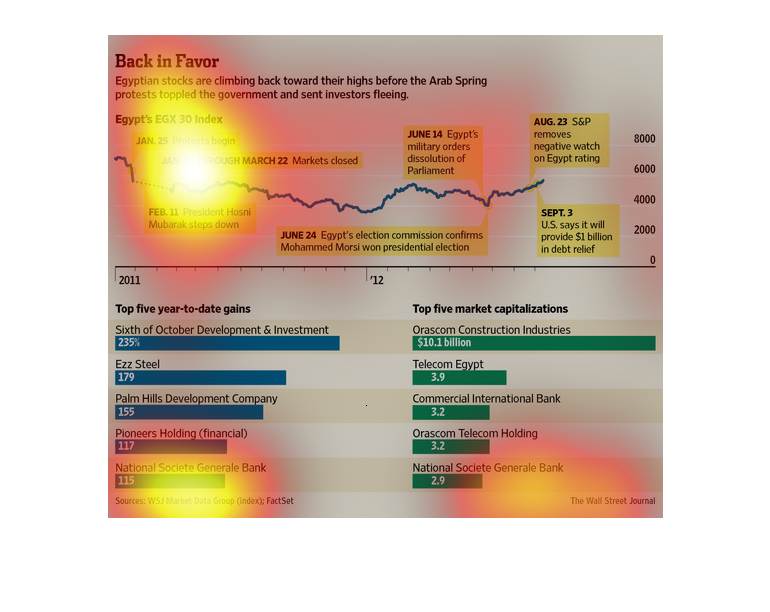
This chart describes back in favor. Specifically, Egyptian stocks are climbing back toward
their highs before the Arab spring protests toppled government.
This graph visualizes the progress the Egyptian stock market has made, bouncing back from
lows during the Arab Sprint. The top portion of the image lists key events in a time-line
format. The bottom portions of the image show two graphs: one lists the top five companies
making year-to-date gains, the second lists the top 5 companies in terms of capitalization
increases.
This chart/graphs shows us that Egyptian stocks are rising high before the Arab Spring protest
came to be. It shows month by month starting with the protest and going into the present.
It also shows the top five year gains.
This graph shows that Egyptian Stocks are climbing back before the Arab Spring after protesters
sent investors fleeing.  It describes the times and effects protesters had on the stocks.