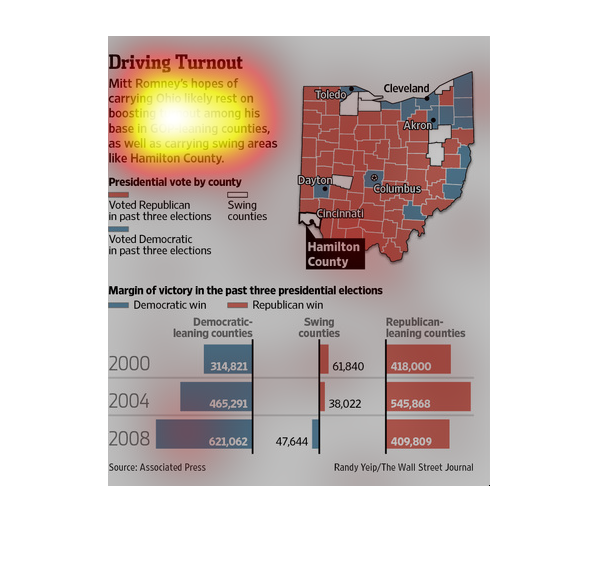
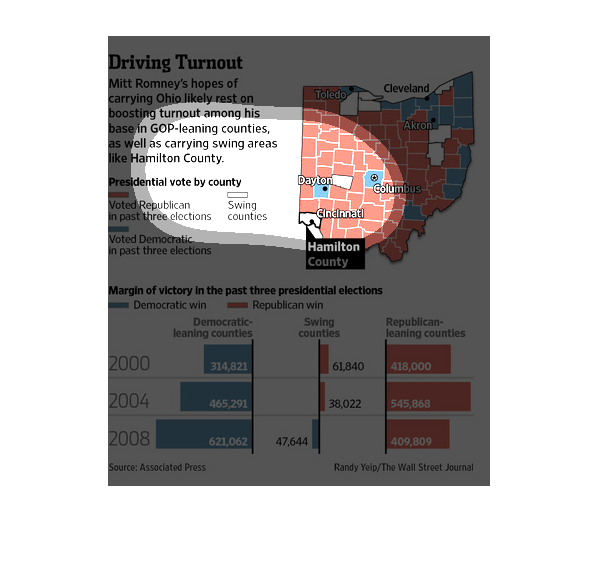
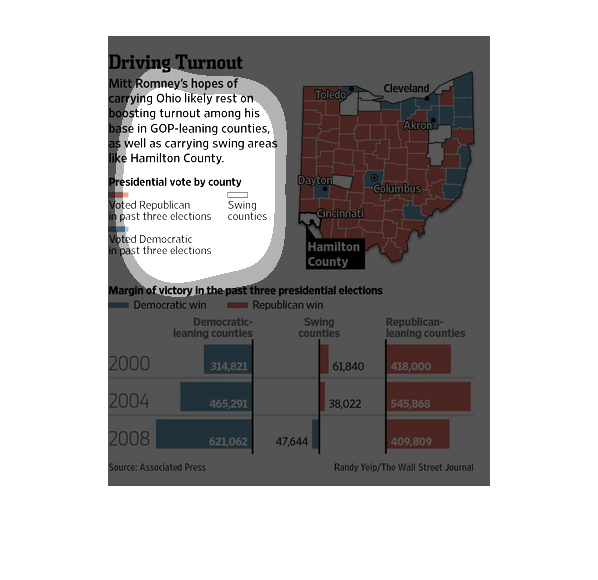
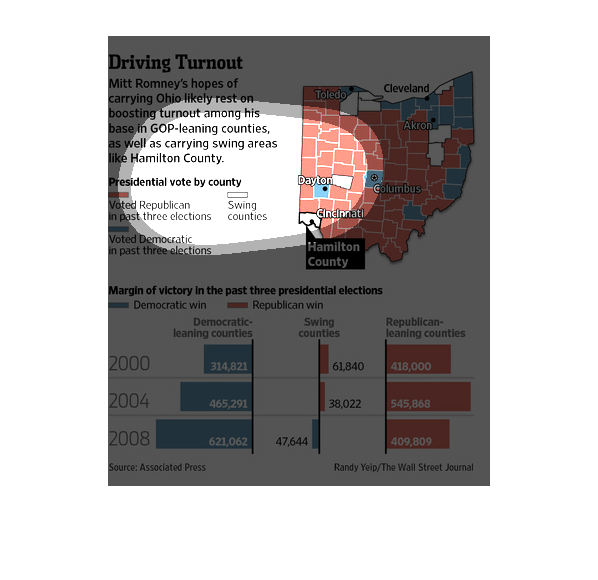
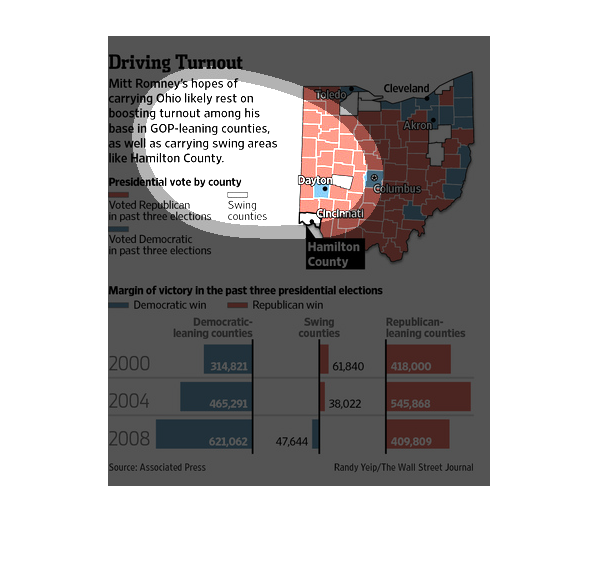
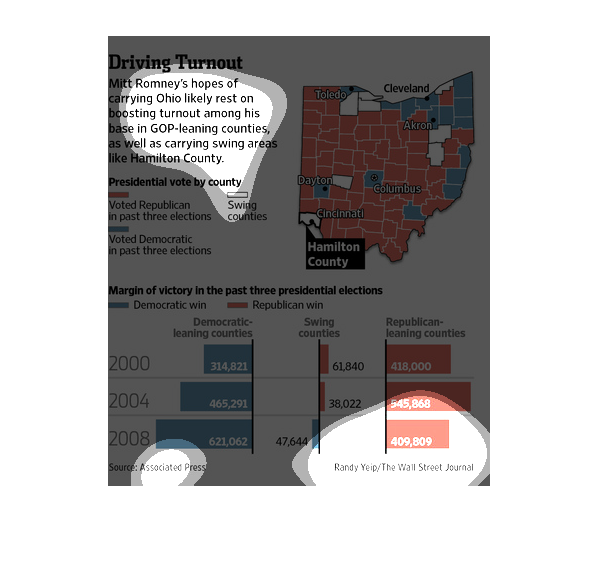
This chart describes driving turnout. Specifically, Mitt Romney's hopes of carrying Ohio likely
rest on boosting turnout among his base in GOP-leading countries.
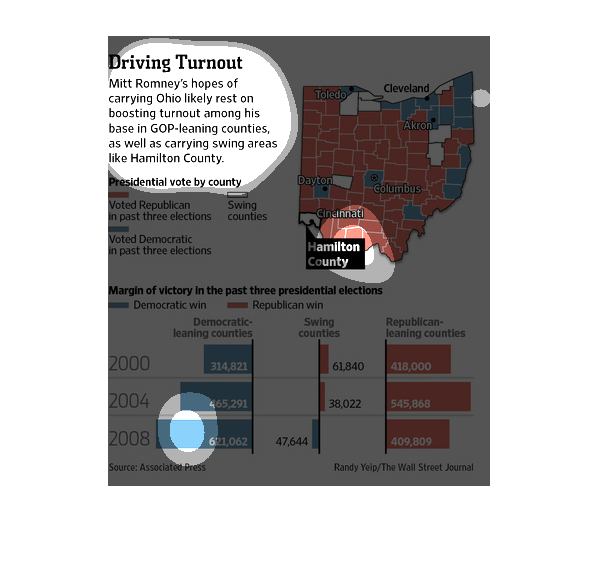
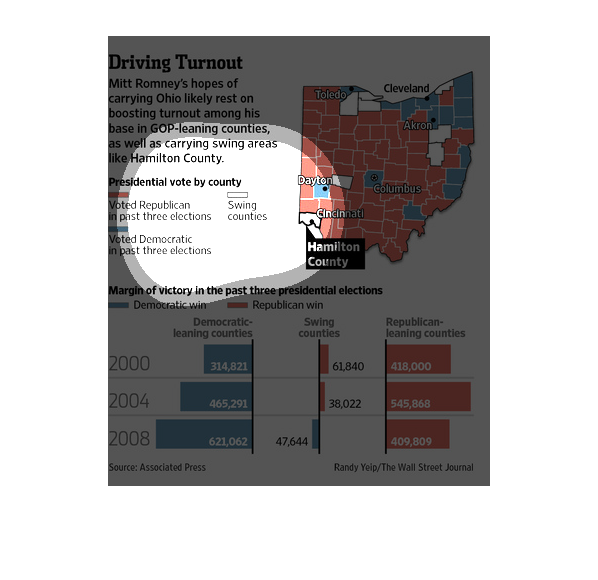
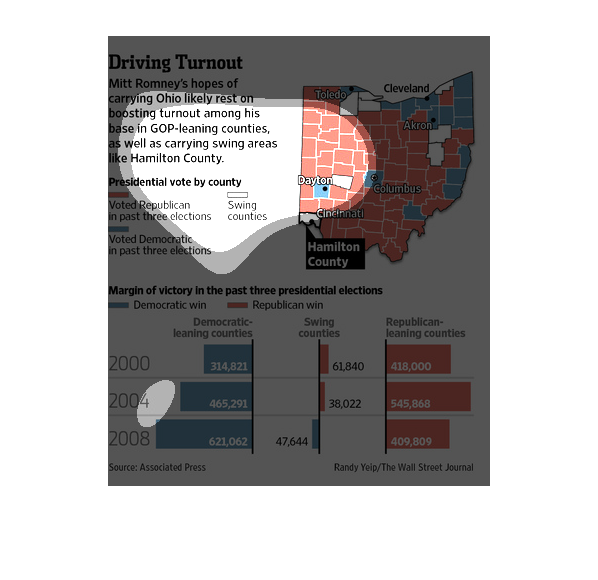
The image depicts a map of Ohio, specifically showing Mitt Romney's home of carrying the state
in the 2012 election. Romney's strategy appears to depend on his GOP base of voters and boosting
the turnout in established GOP counties, as well as carrying swing counties.
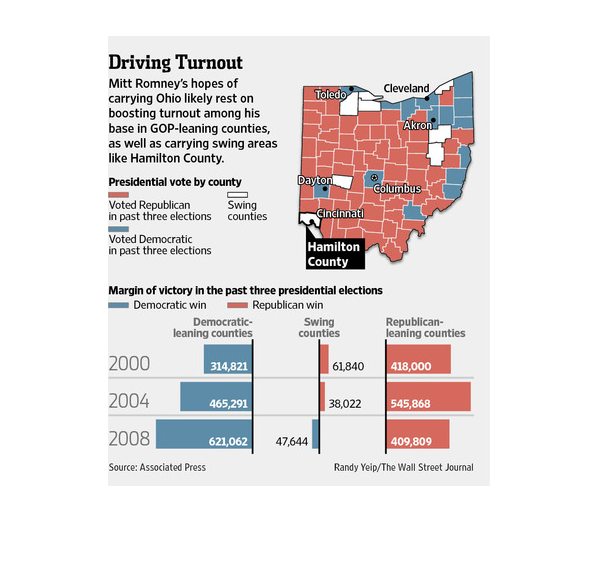
This is a series of color coded maps and graphs depicting the importance of various counties
in Ohio if Mitt Romney wanted to gain victory in the 2012 election.
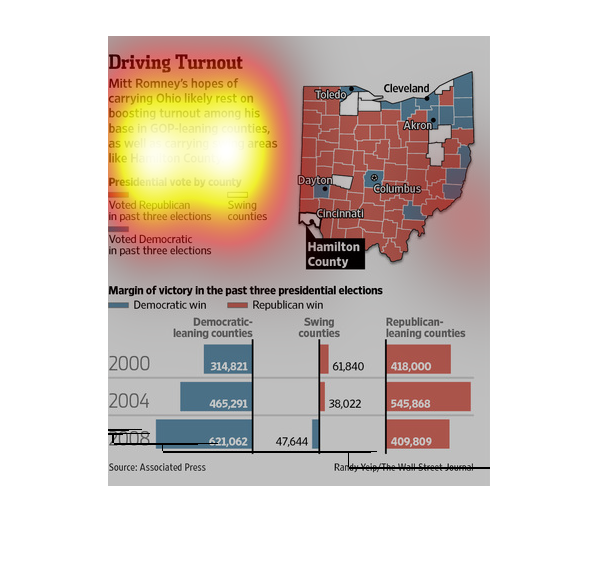
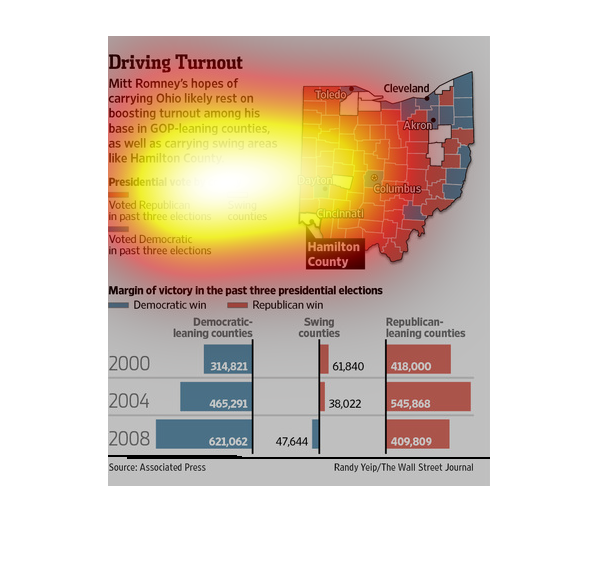
This is a series of color coded maps, charts and graphs depicting the hoped of Mitt Romney
in the election of 2012 depended on the voter turnout in Ohio.
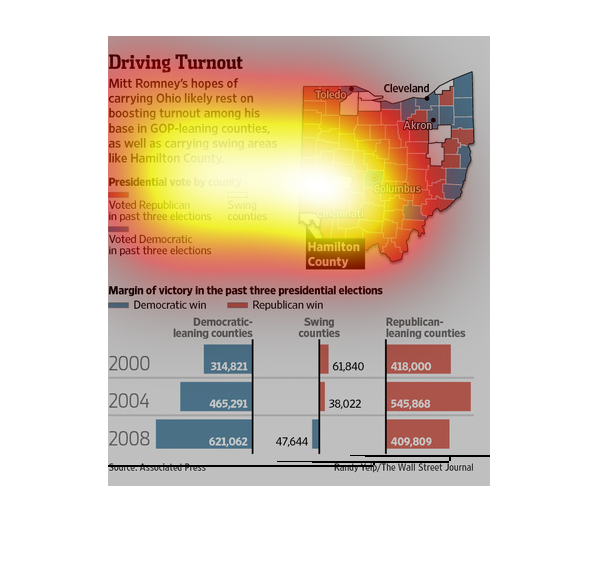
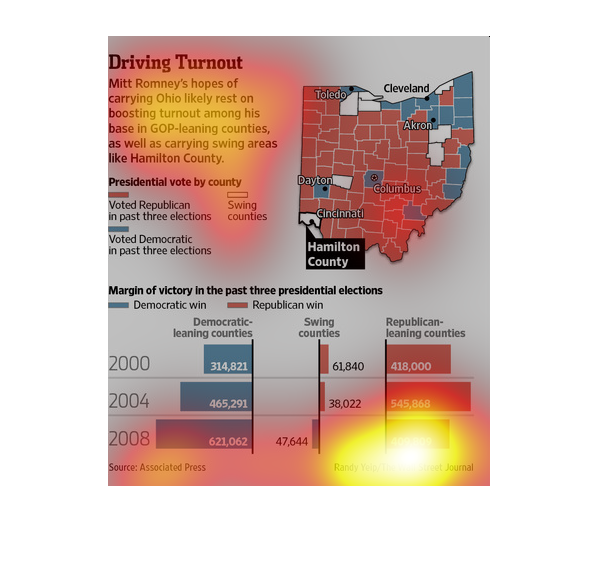
A map infographic of the 2008 election concerning Ohio and how Mitt Romney's win there depends
on turnout in rural areas which are more likely to vote for him
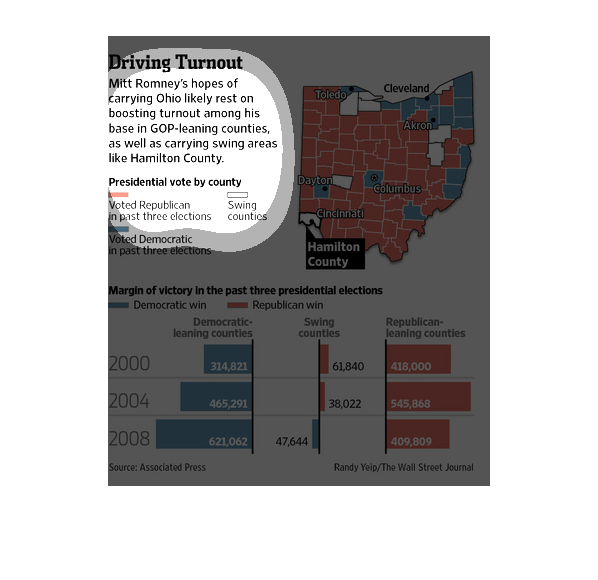
This chart shows a breakdown of the state of Ohio by county in the last election. It also
shows the percentage that candidates won by in past presidential elections
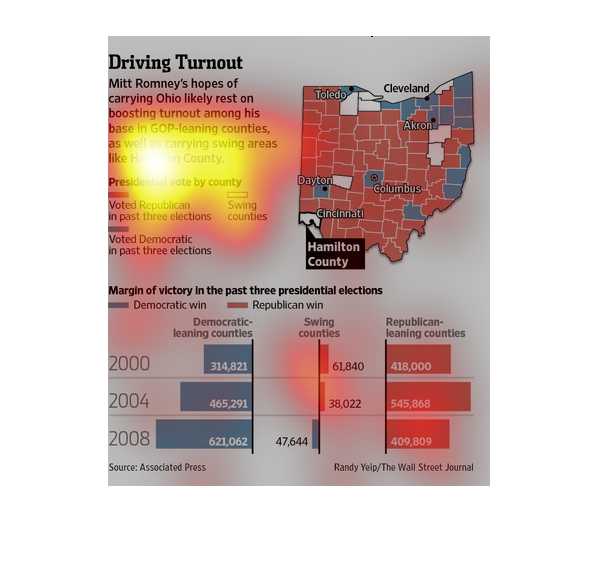
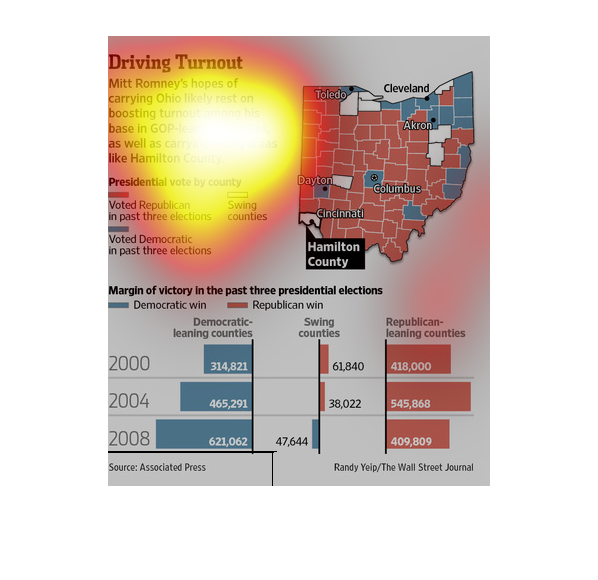
This chart describes driving turnout. Specifically, Mitt Romney's hopes of carrying Ohio likely
rest on boosting turnout among his base in GOP-leaning counties.
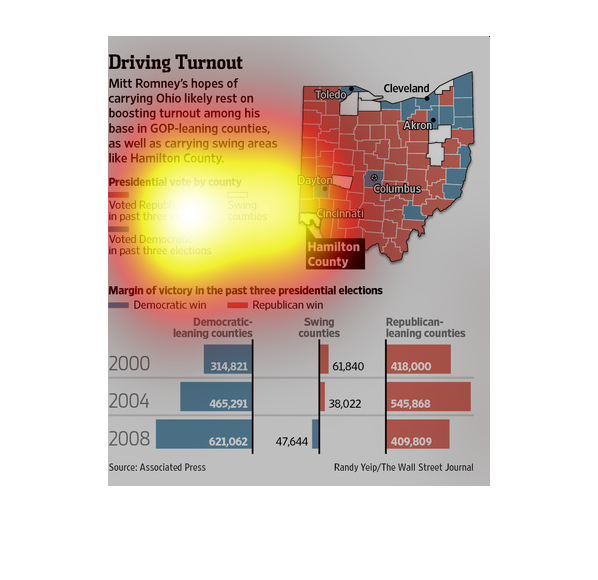
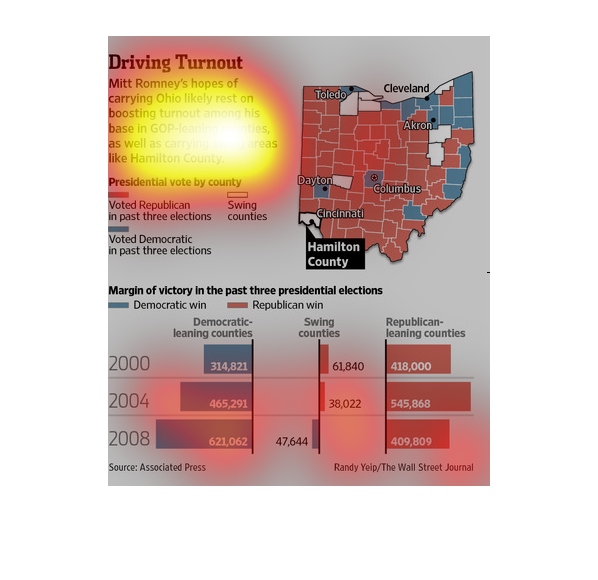
This graph illustrates the voting sway for the Obama Romney US presidential election in Ohio.
 It contains a heat map of Ohio with voting trends for Republican and Democrat over the past
3 years.
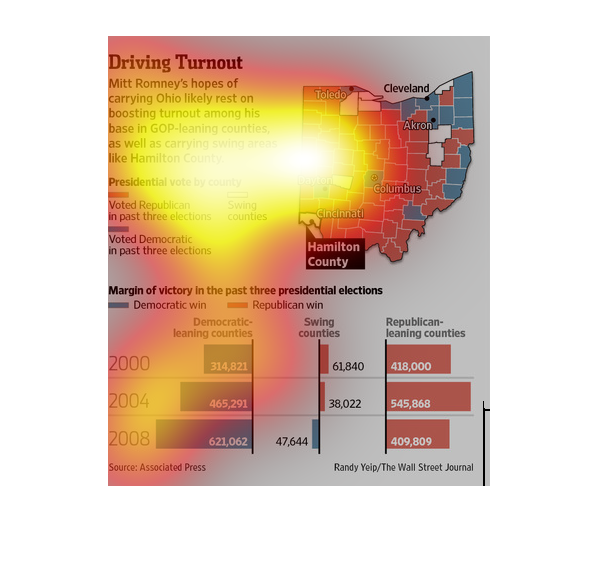
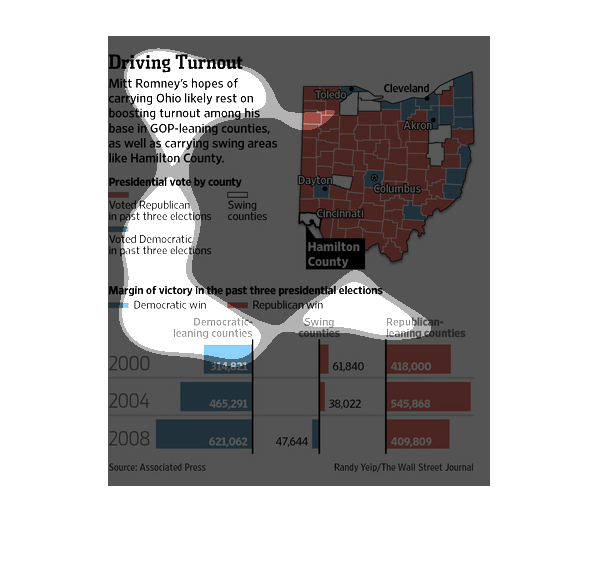
This shows that Mitt Romney's hopes of carrying Ohio likely rest on his ability to generate
a large turnout in the counties in the state that are more republican.
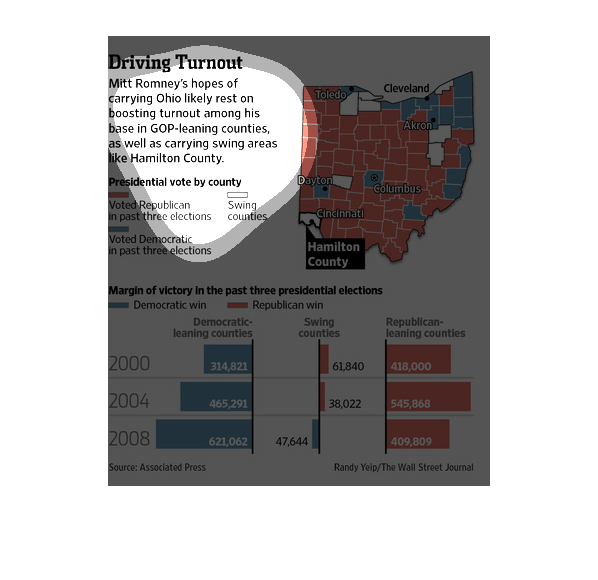
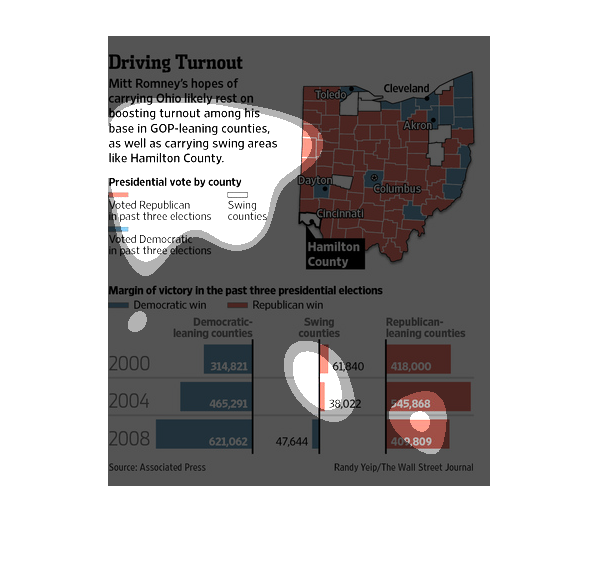
This is a political graph showcasing the voting districts of Ohio. This is about Mitt Romney
and him trying to get support of the state. The state is mostly republican.
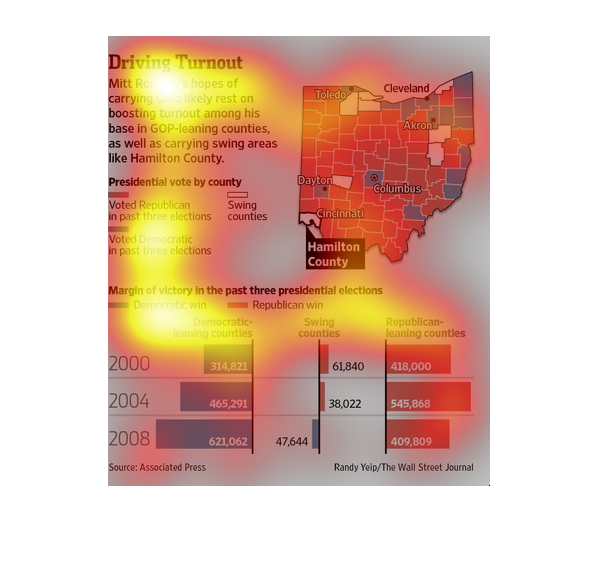
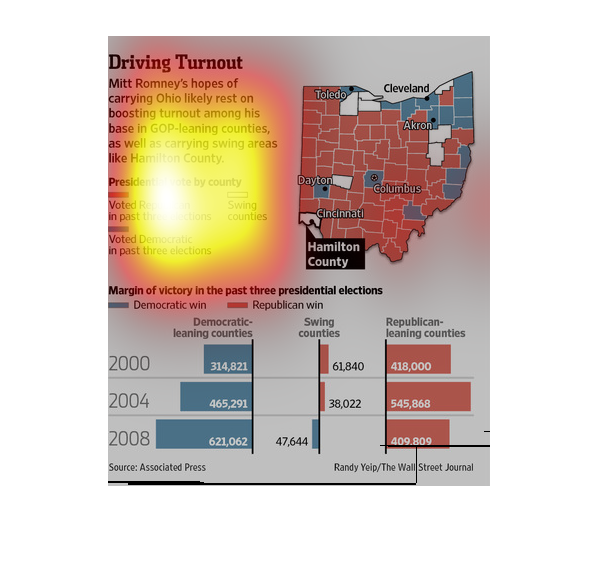
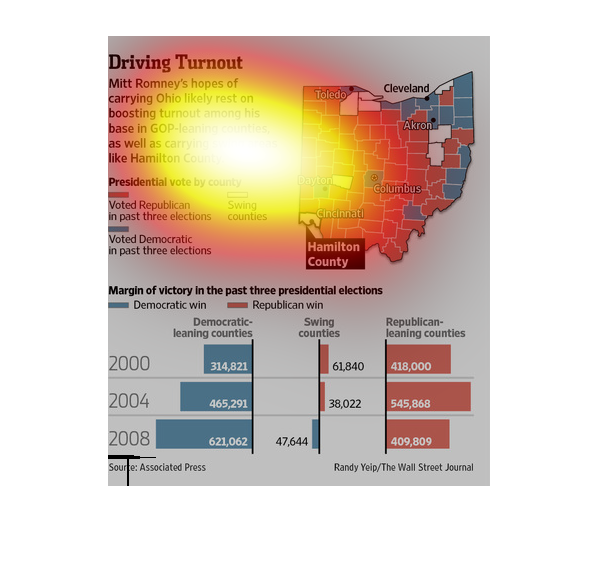
This is a detail of how Romney and Obama are trying to drive votes in the US presidential
election including  a heat map of Ohio and the margin of victory for each party in the past
three presidential elections.
This chart shows the state of Ohio voters who voted republican or democrate seperated by county.
It also shows the margin of victory over the past three years as seperated by county.
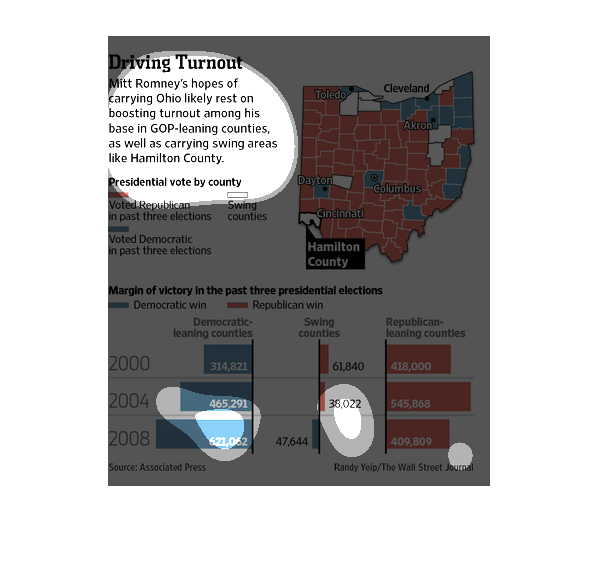
This graphic from 2012 shows the importance of Ohio to Mitt Romney's campaign, and how that
swing state help his hopes of a Presidential Election in the balance. We all know he lost
that gambit.