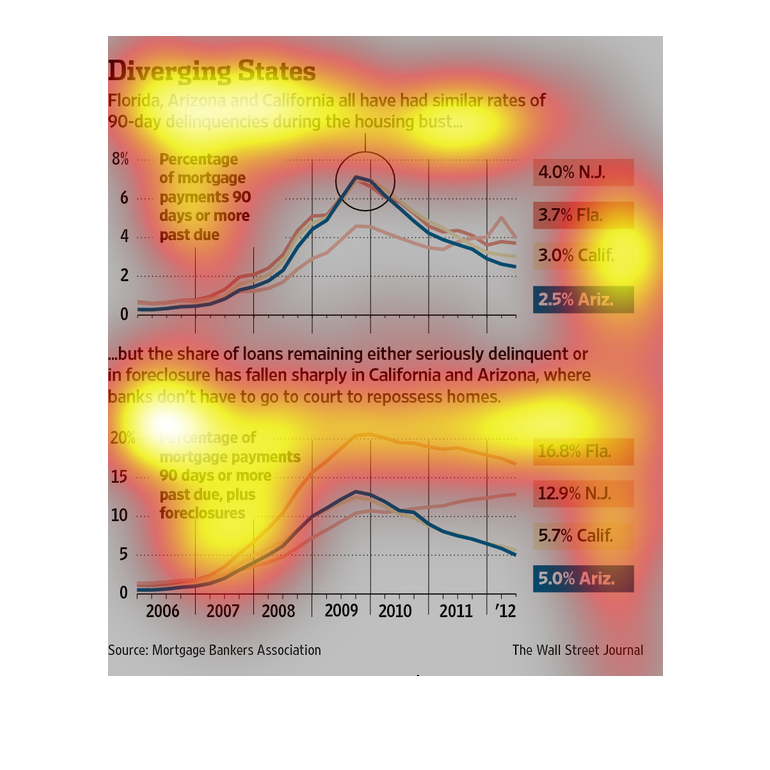
A study conducted from 2006 to 2012 illustrates- as we see here- the impact of foreclose on
these three states. California, Arizona, and Florida were the most affected.
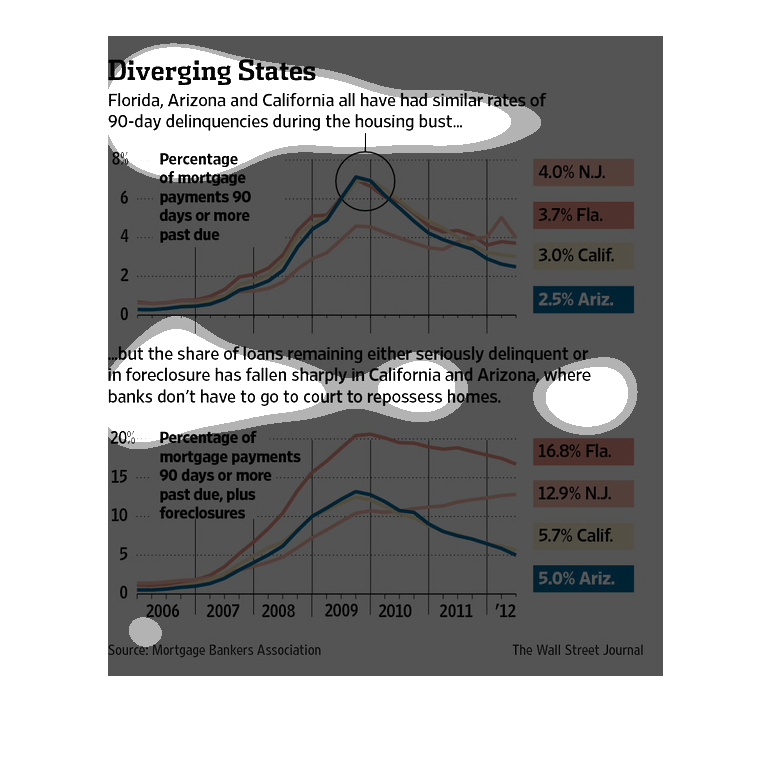
The following chart displays that Arizona, California and Florida have all had similar rates
of 90 day delinquencies during the housing market crises.
This chart shows the "Diverging states." Arizona, California, and Florida all had similar
rates of 90-day delinquenices during the housing bust.......
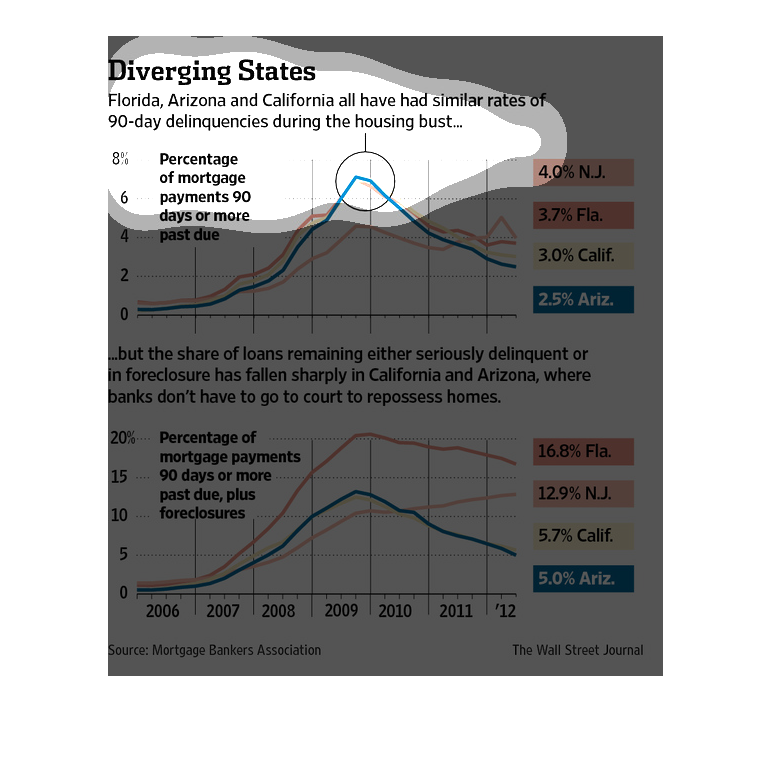
This chart describes diverging states. Specifically, Florida, Arizona, and California all
have had similar rates of 90 day delinquencies during the housing bust.
This is a series of charts depicting that Florida, Arizona and California all have had similar
rates of 90-day delinquencies during the housing/financial crises.
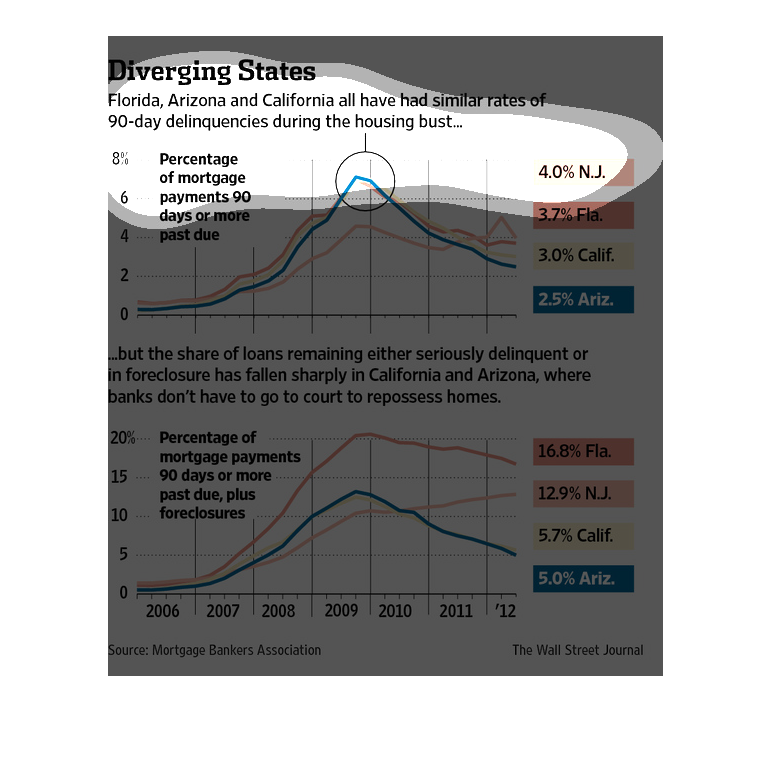
This chart describes diverging states. Specifically, Florida, Arizona, and California all
have had similar rate of 90 day delinquencies during the housing bust.
Florida, Arizona and California all have similar rates of delinquency during 90 day housing
busts. It shows these big states all have similar amount of number behind on mortgages
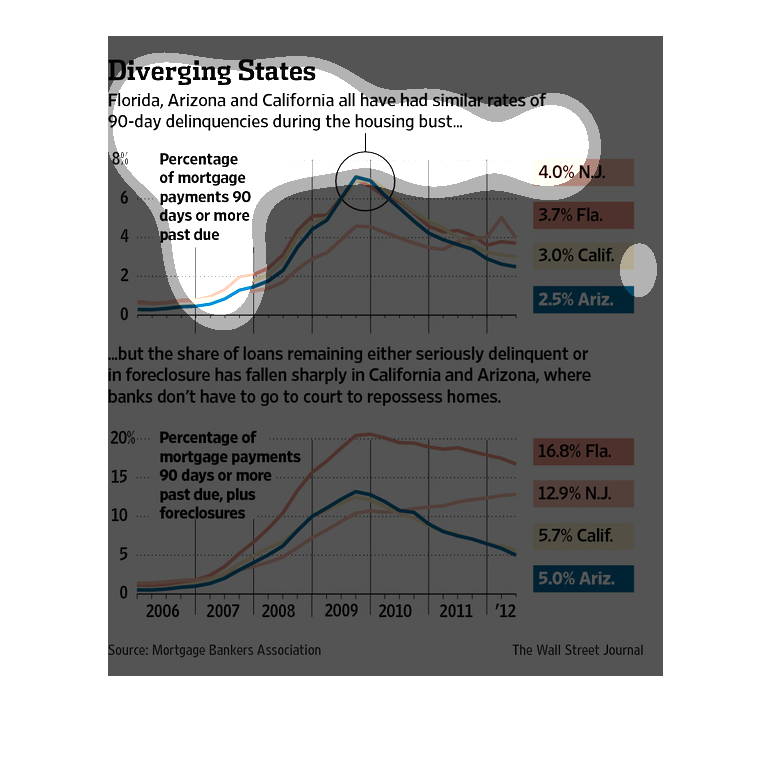
diverging states. Florida, New Jersey, Arizona and California have all had similar rates of
90 day delinquencies during the housing bust. Based on payments and mortgages 90 days past
due as displayed in a line graph, a peak and then decline pattern.
This is a series of charts depicting that Florida, Arizona and California all have had similar
rates of 90 day delinquencies during the housing/financial crises.
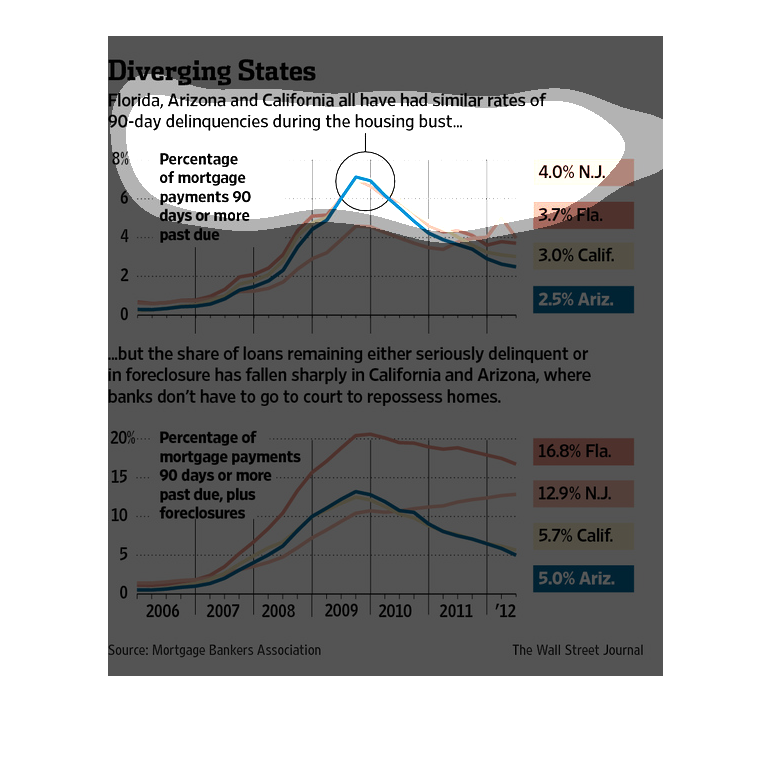
The image shows the percentage of mortgages overdue in several states. The states shown have
similar rates of 90 day delinquency. However, the rates of loans in foreclosure has fallen
in California and Arizona.
This is a graph that shows for the regions of California, Arizona and Florida have had similar
rates of 90-day delinquencies during the housing burst that was experienced.
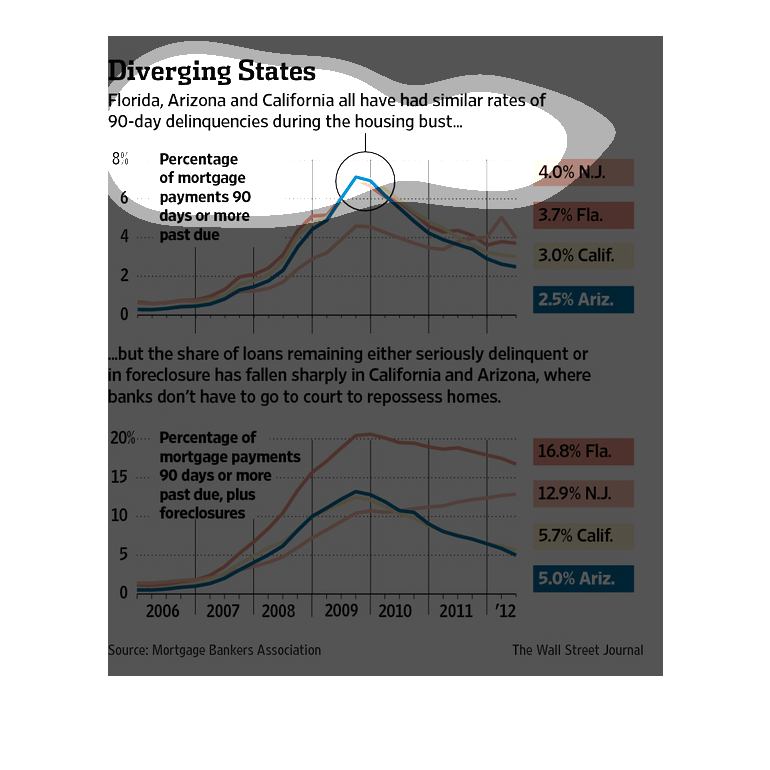
The image depicts different states such as Florida, Arizona, and California all having similar
rates of 90-day delinquencies during the housing bust. The percentage of mortgage payments
90 days or more past due appear highest in New Jersey at 4.0%, with Arizona having the lowest
percentage of 2.5%. However, Florida has the highest percentage of mortgage payments 90 days
past due and foreclosures included, at a high of 16.8%, with Arizona at 5.0%.
The top graph compares the amount of mortgages over 90 days past due from several different
states. The state they are looking at are New Jersey, Florida, California and Arizona. New
Jersey topping out with the highest percentages. The bottom graph is showing the amount of
mortgages over 90 days past due and any foreclosures. The graphs compare numbers showing a
decrease in California and Arizona where the banks are able to repo a home without court interaction.
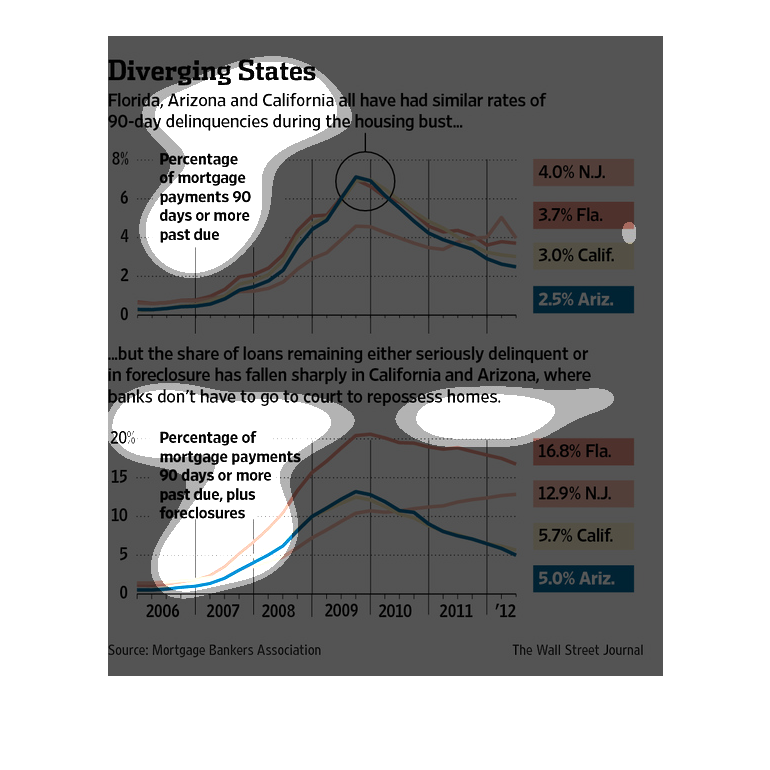
Chart describes the percentage of mortgage payments more than 90 days late. New Jersey has
4%, Florida comes in at 3.7%, 3% in California, while 2.5% of mortgages in Arizona are delinquent.
When you include homes in foreclosure Florida is 16.8%, 12.9% in NJ. California has only 5.7%
and Arizona has 5% because it is easier in those states for the bank to foreclose.