This image is describing how doctors are aiming to save more heart attack patients. They plan
to do this by aiming to reduce the time from the hospital until a blocked artery is opened
with ballon angioplasty.
This is about the the time it takes for a heart attack patient can't get the medical care
he or she needs and different methods the doctor will due to reduce the time it takes to save
a patient.
When a person is having a heart attack it can be a very tricky situation, luckily this illustration
shows what to do in the event of such an emergency.
The picture aims to help medical professions decrease the time it takes for a heart attack
patient to be operated on. It has 6 steps to improve accuracy.
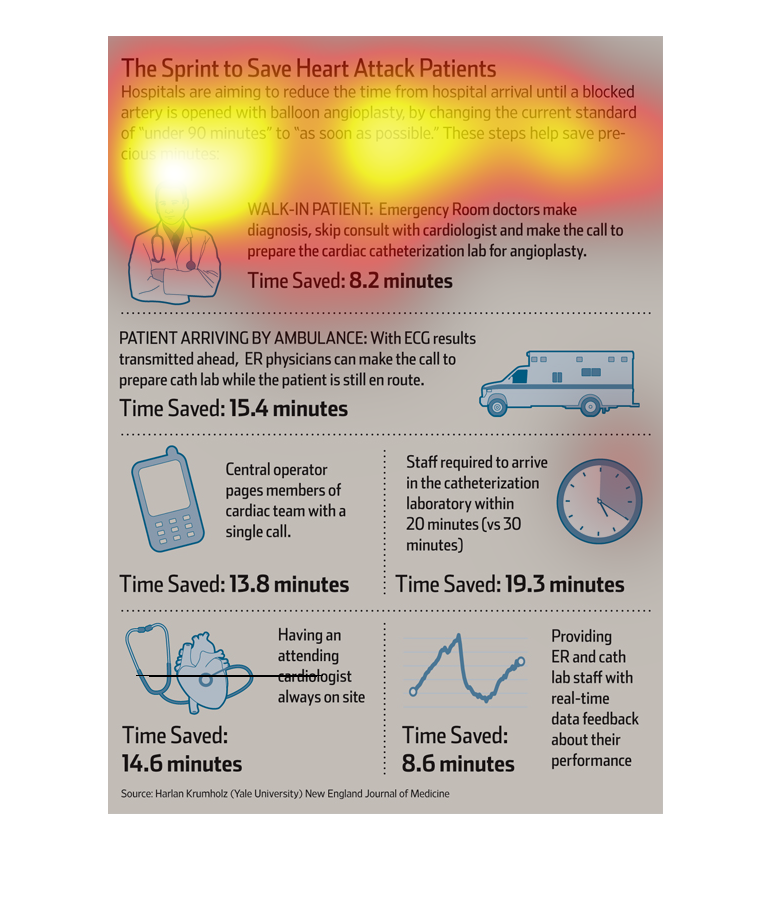
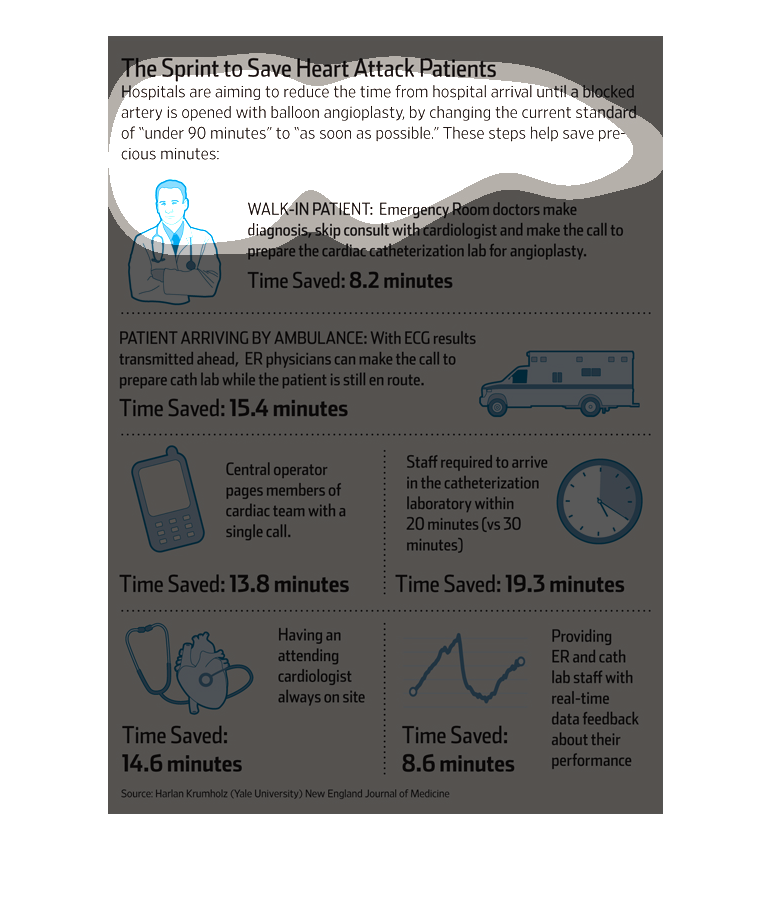
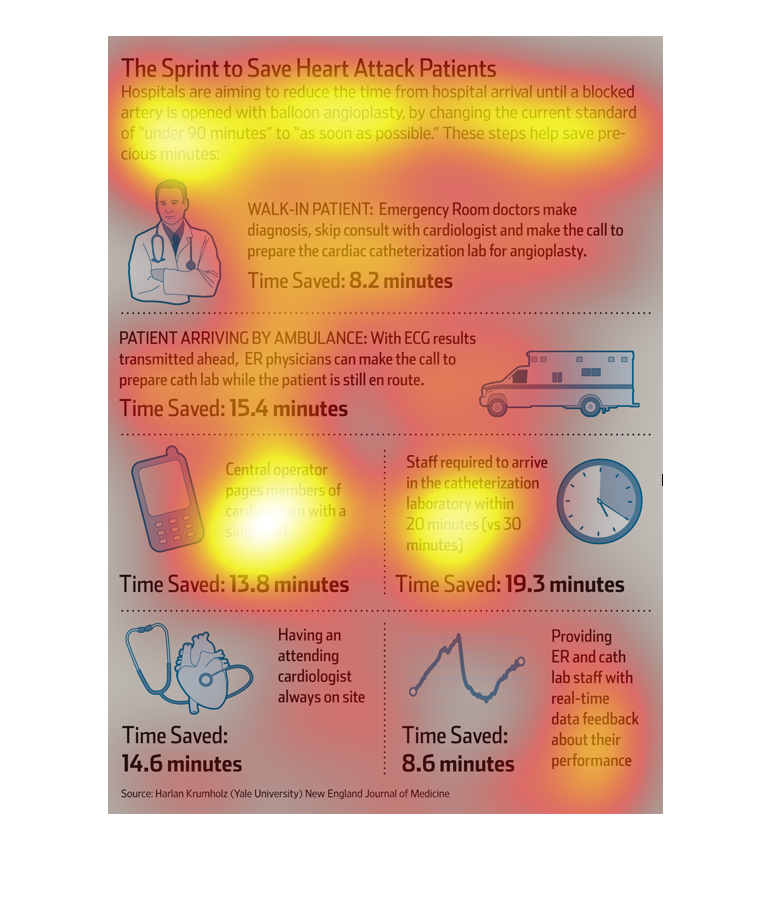
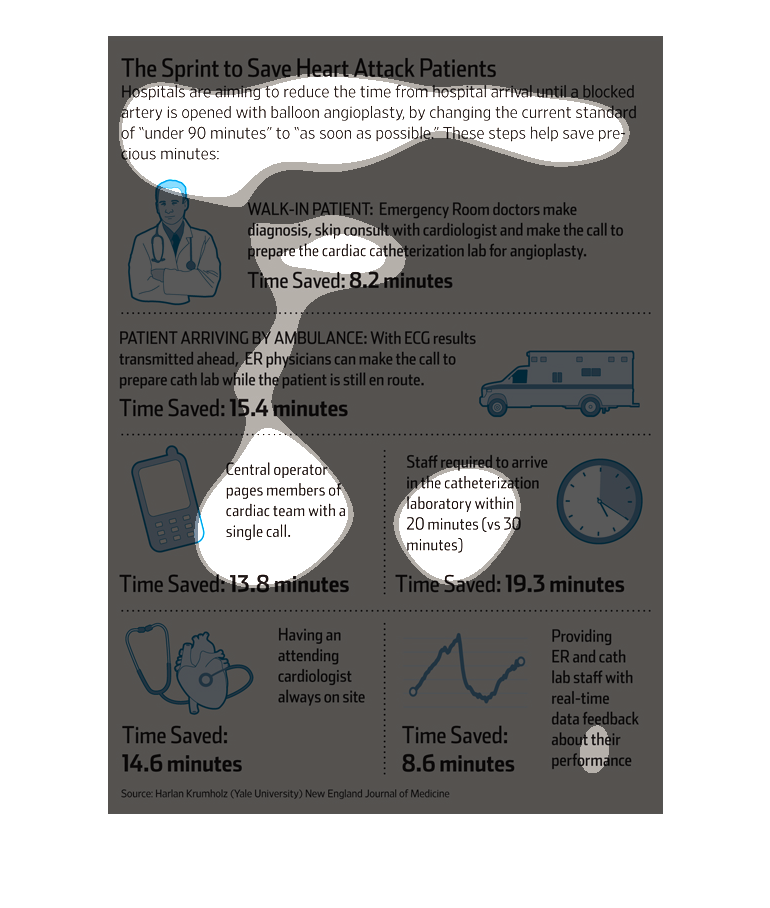
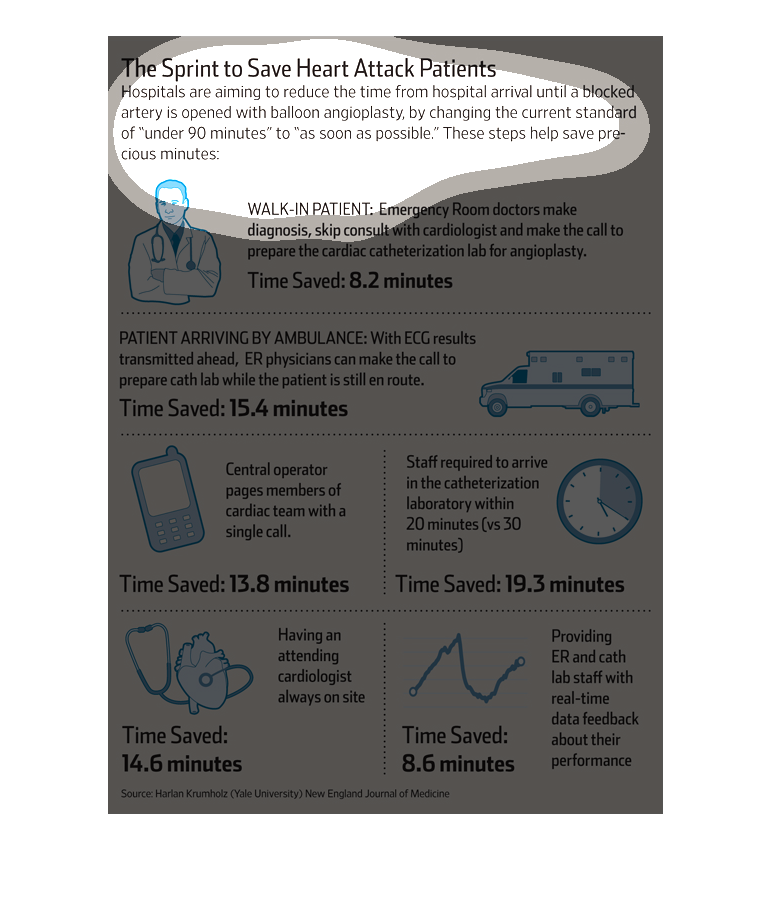
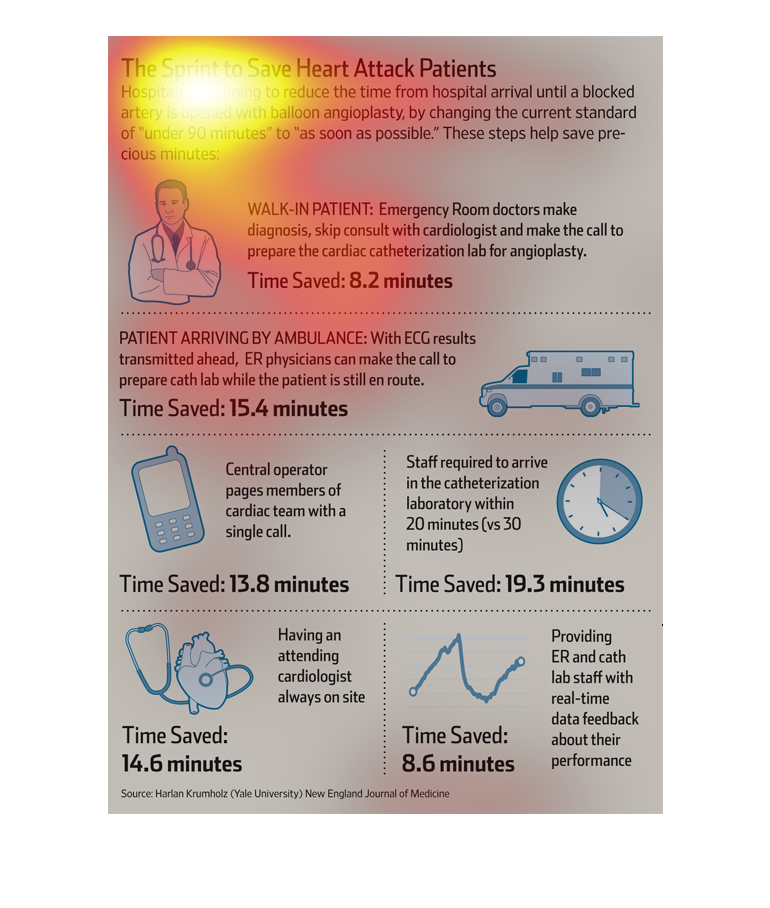
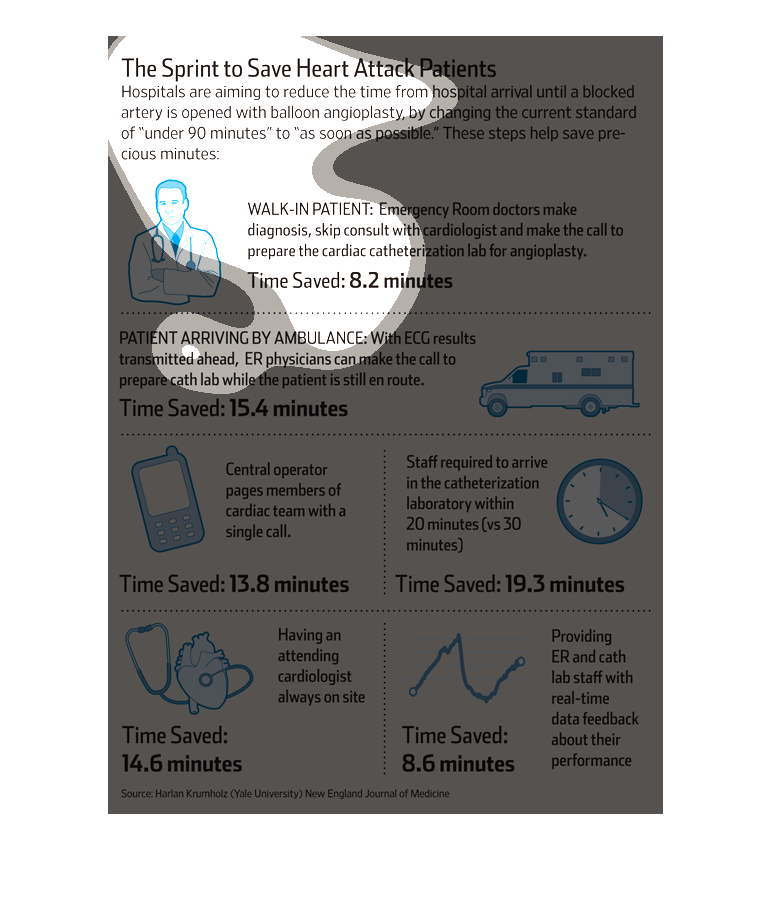
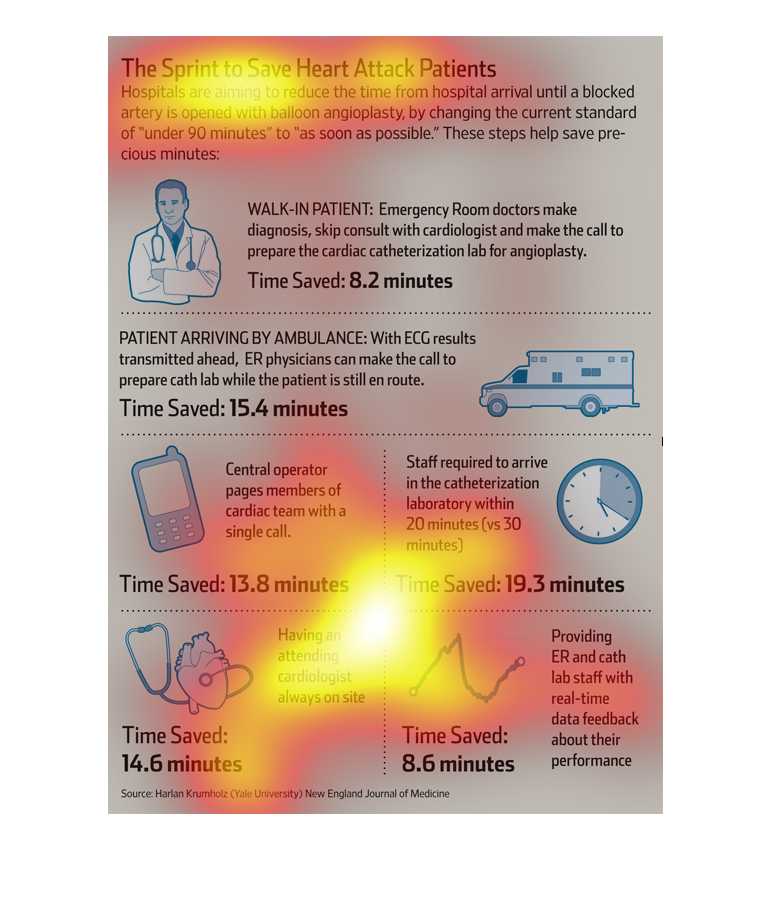
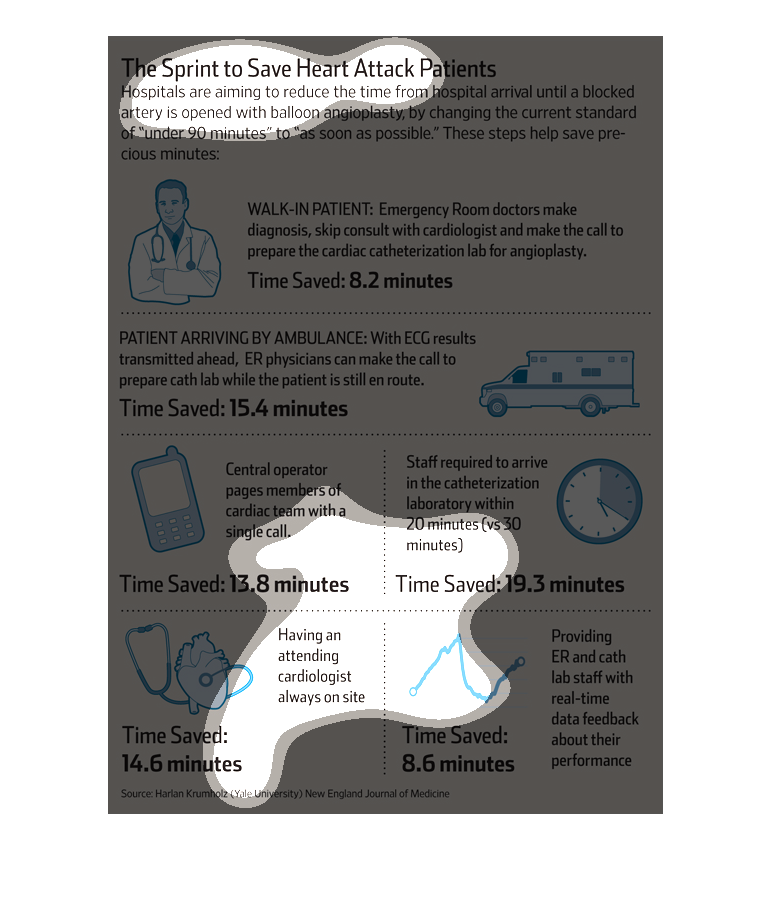
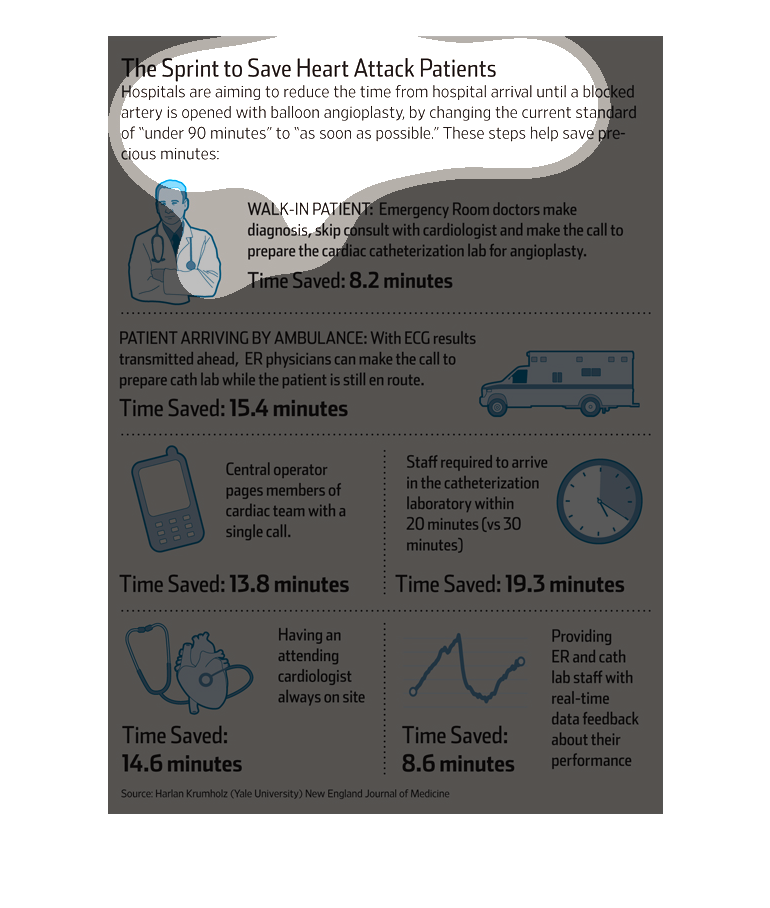
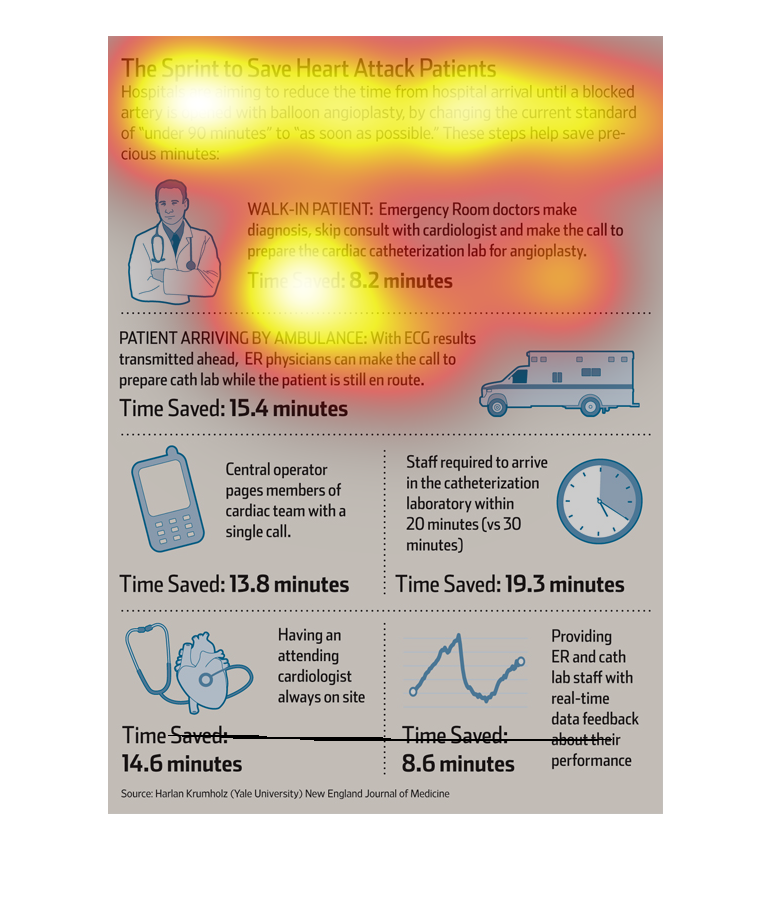
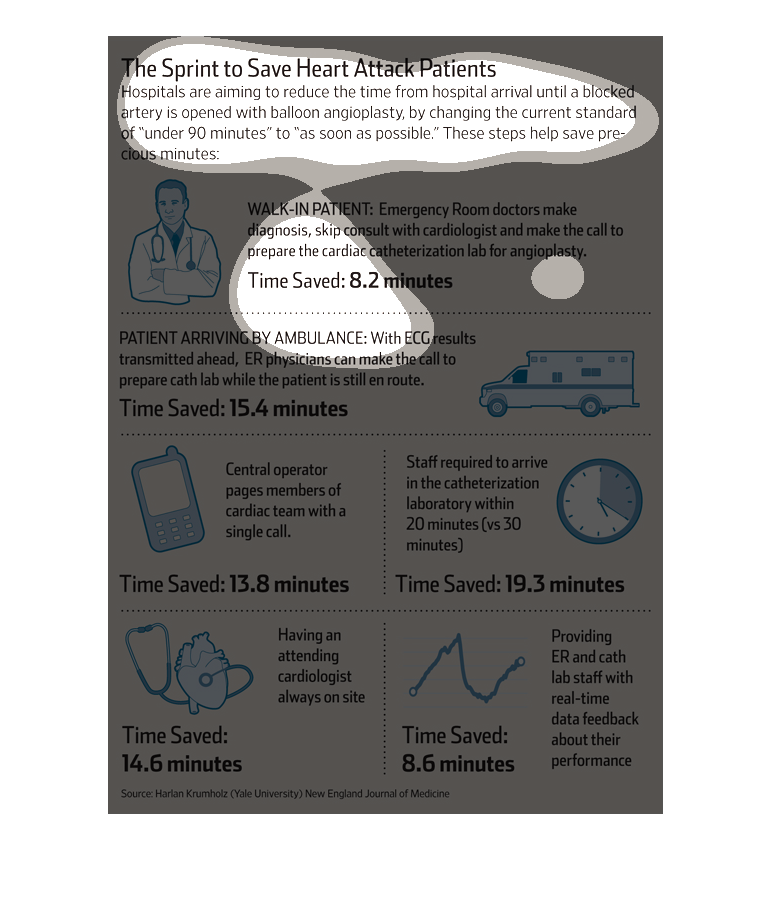
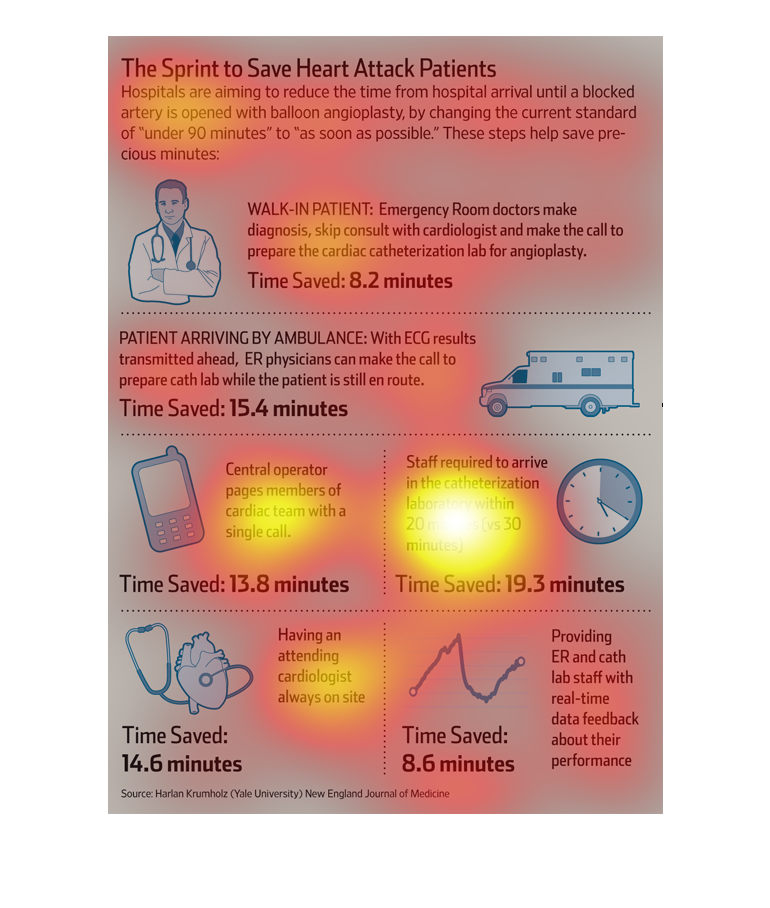
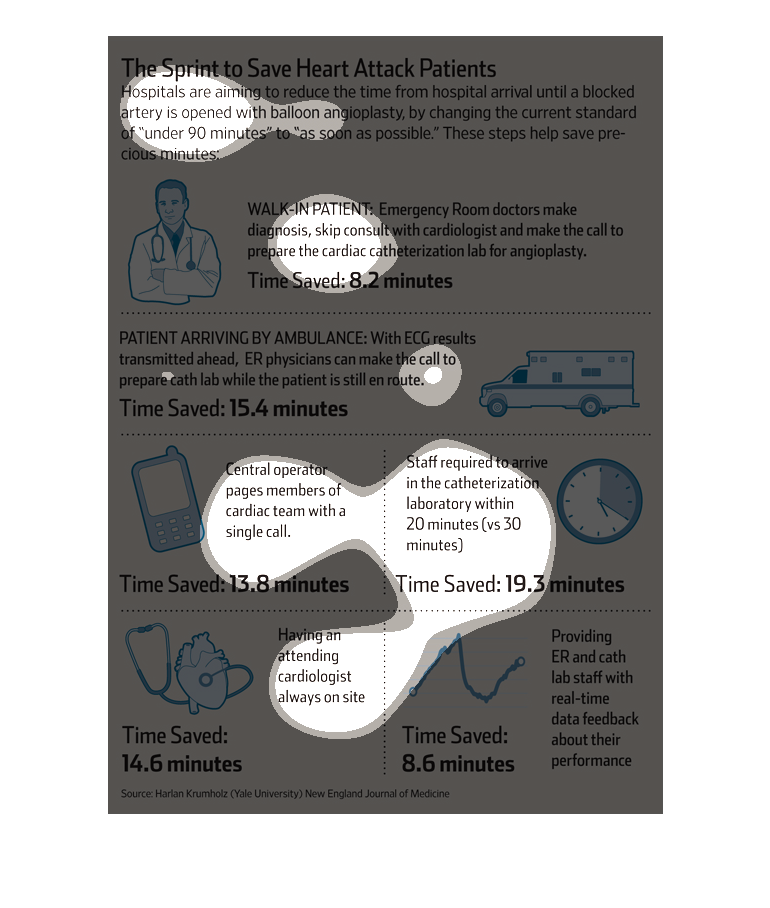
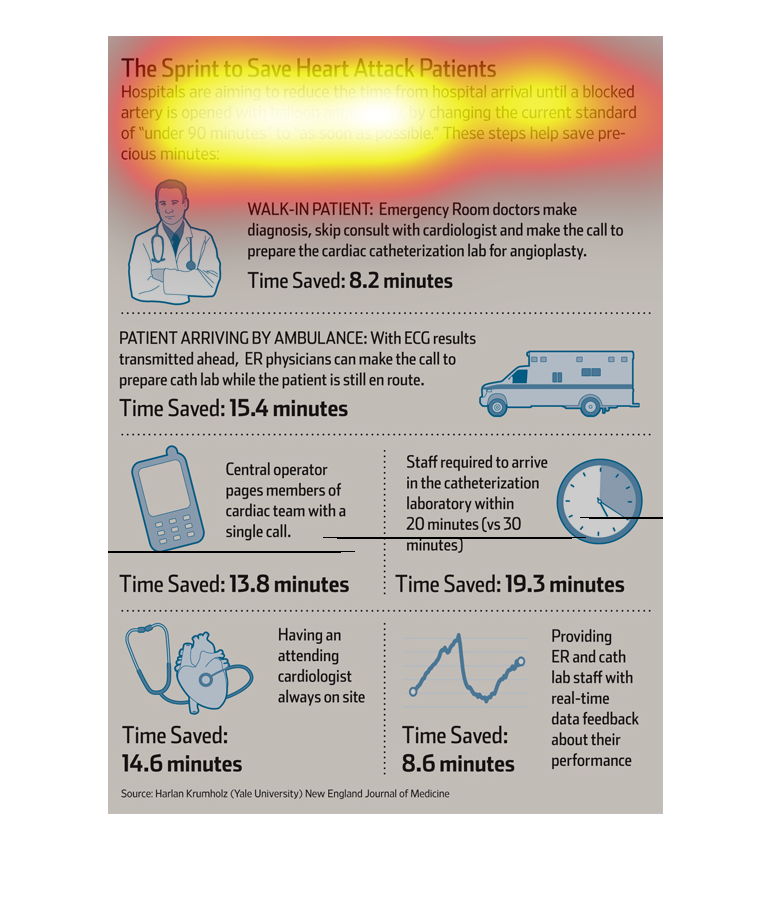
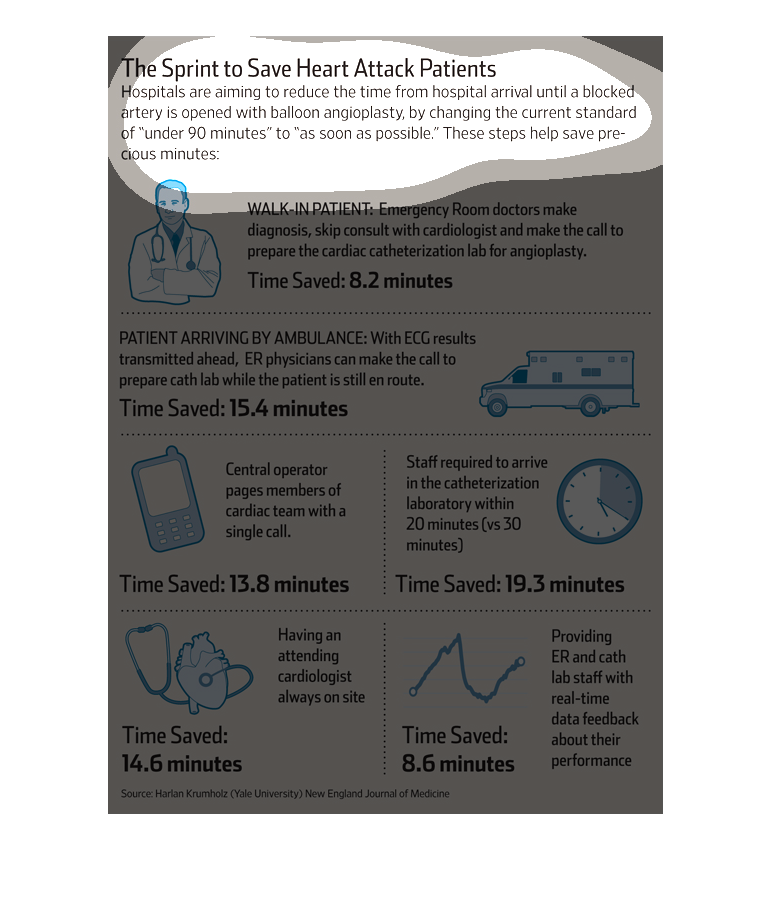
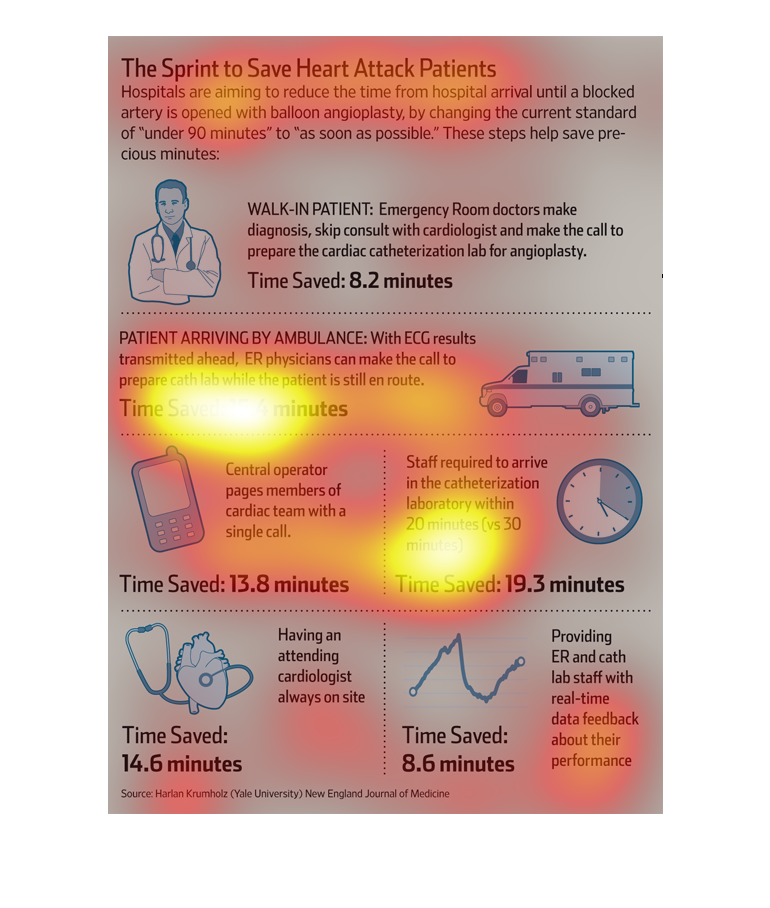
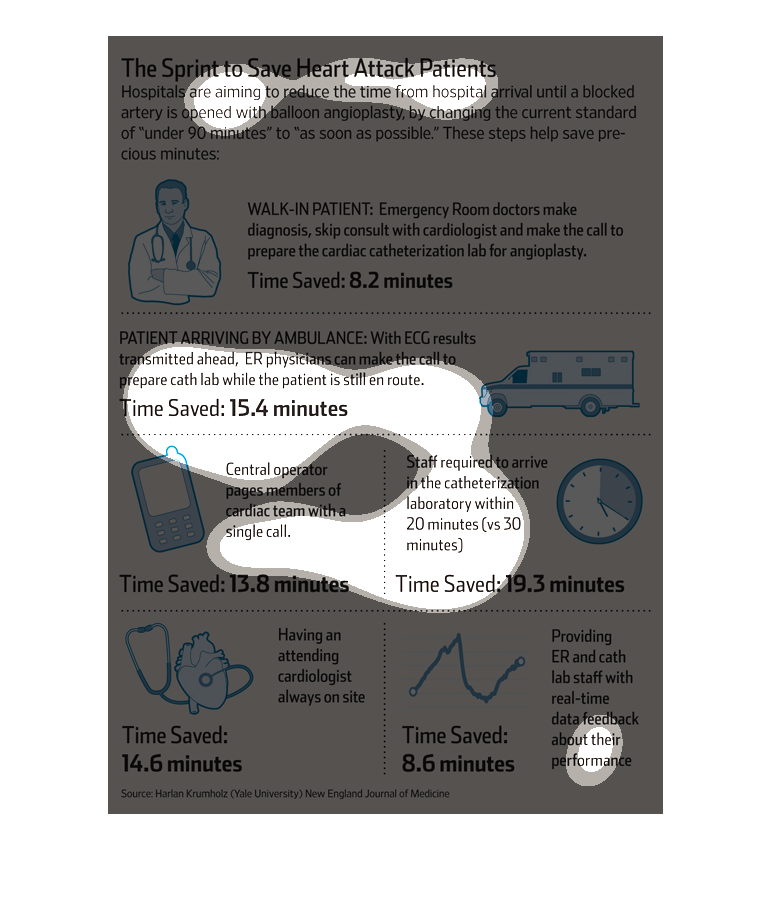
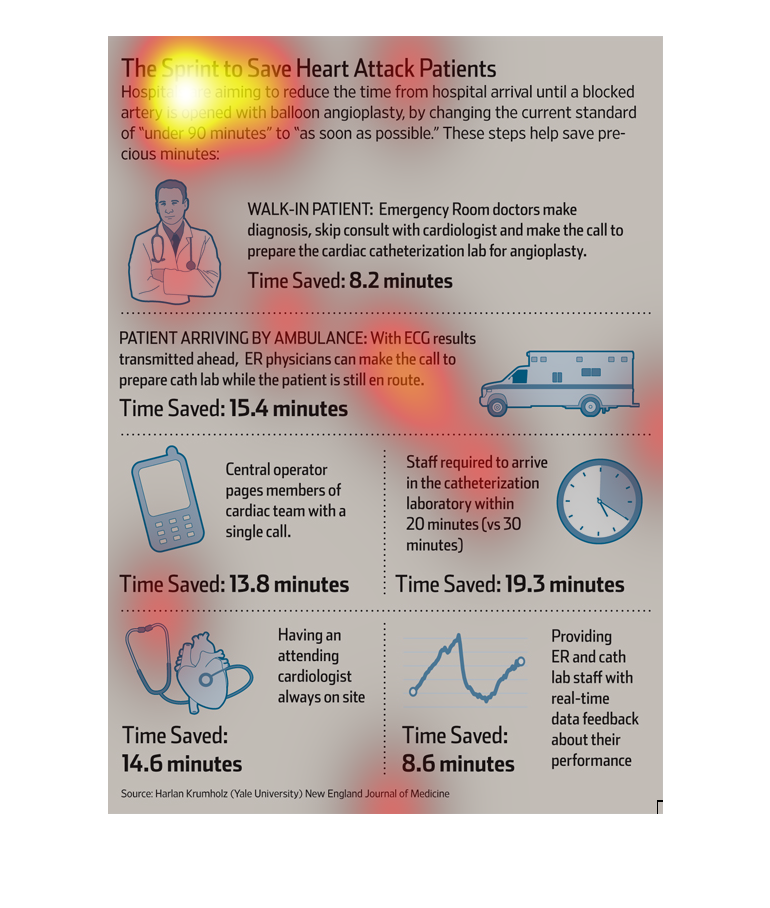
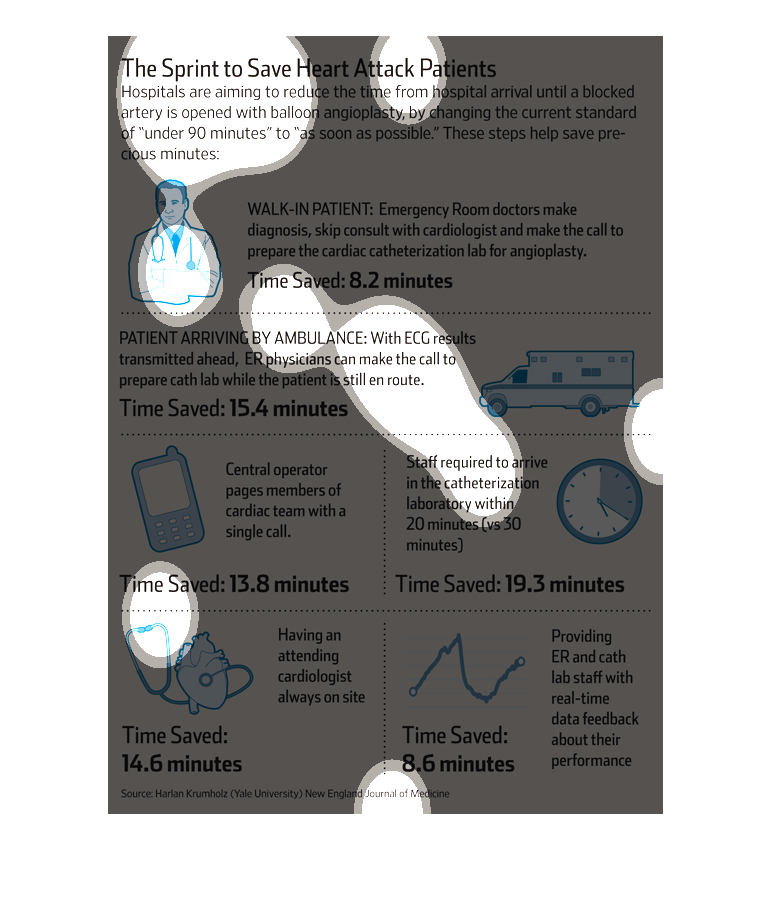
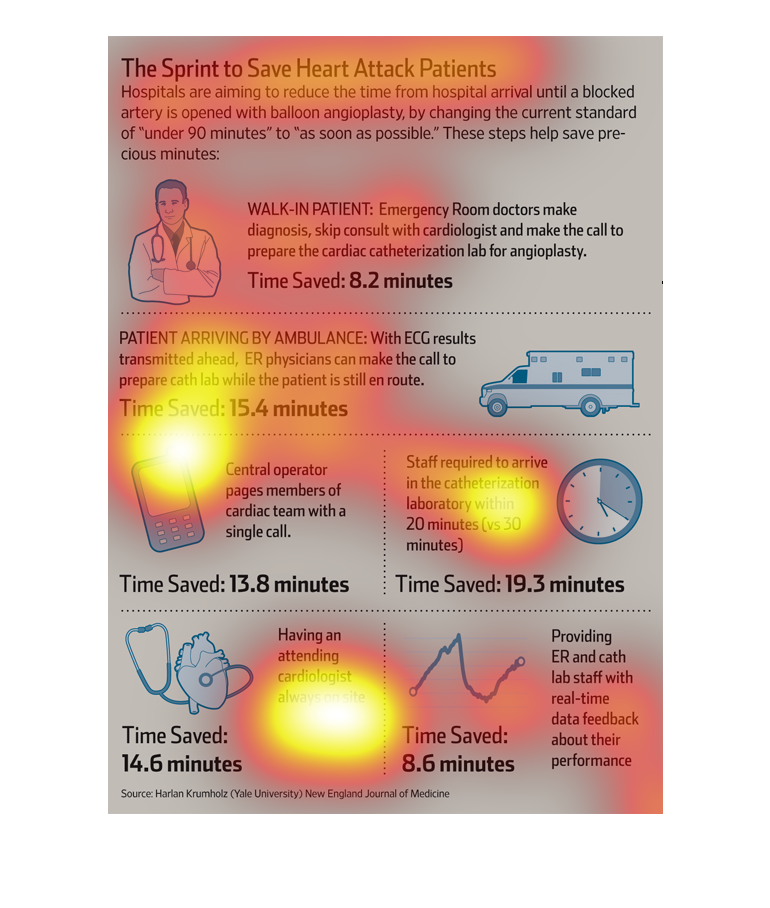
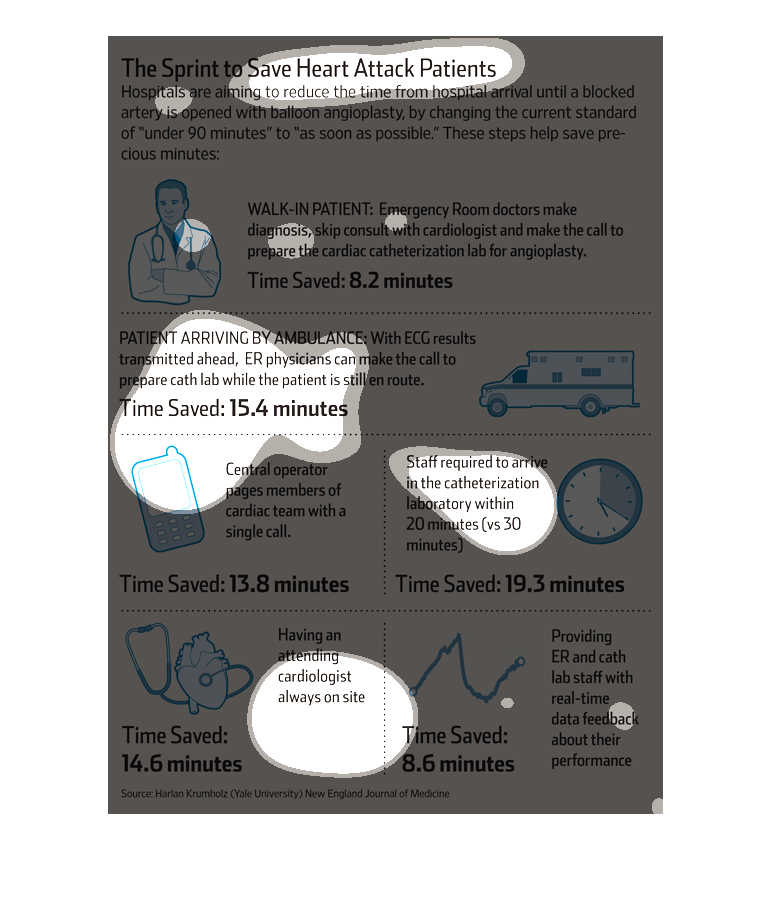
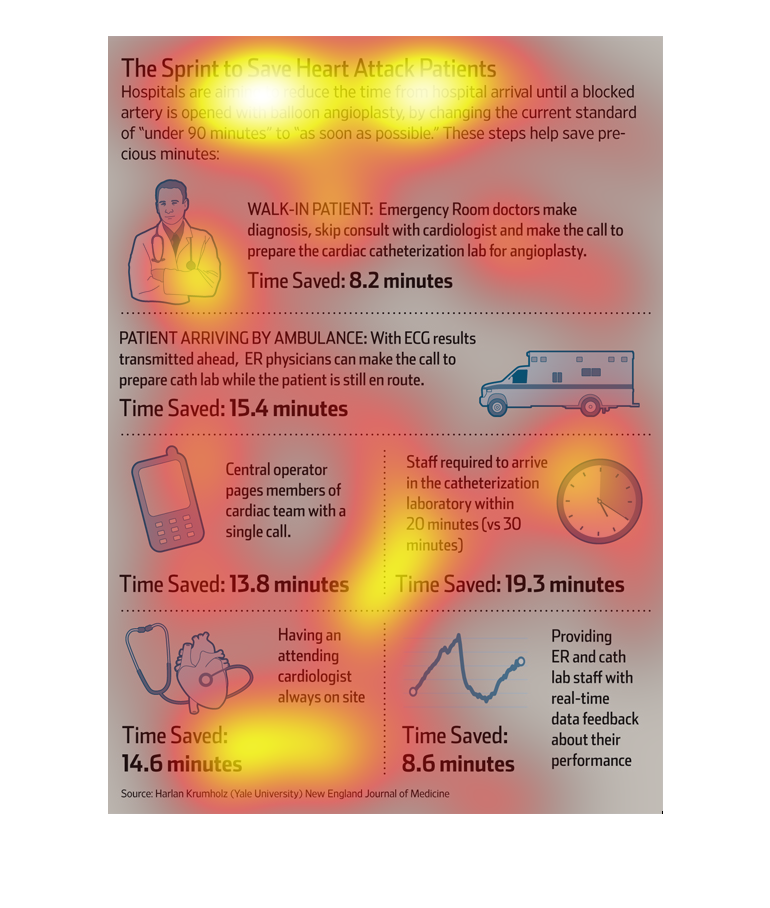
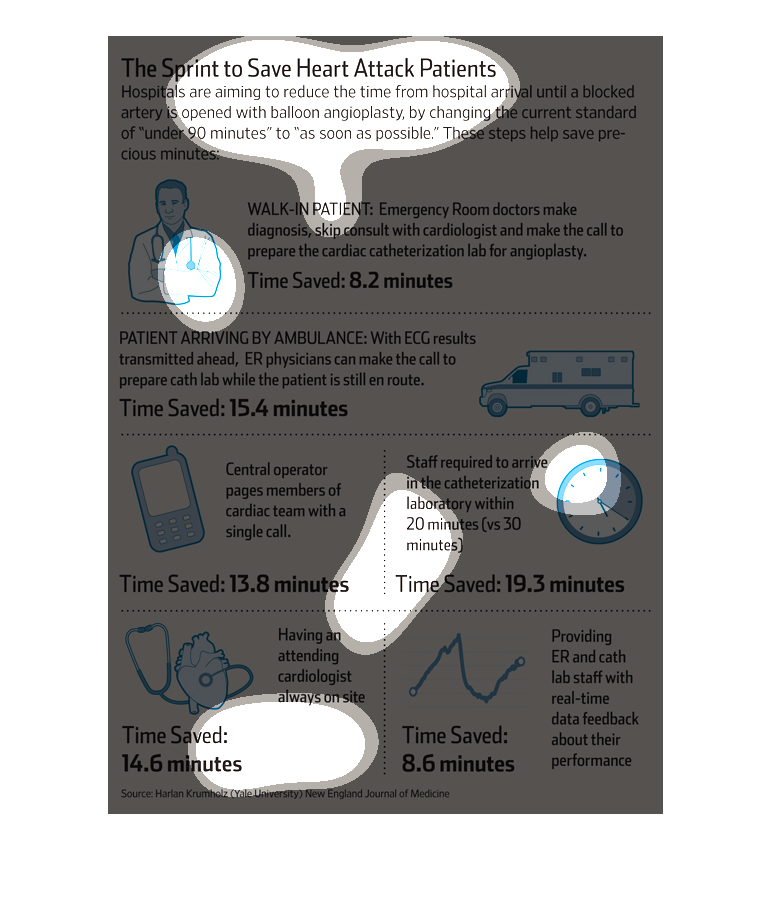
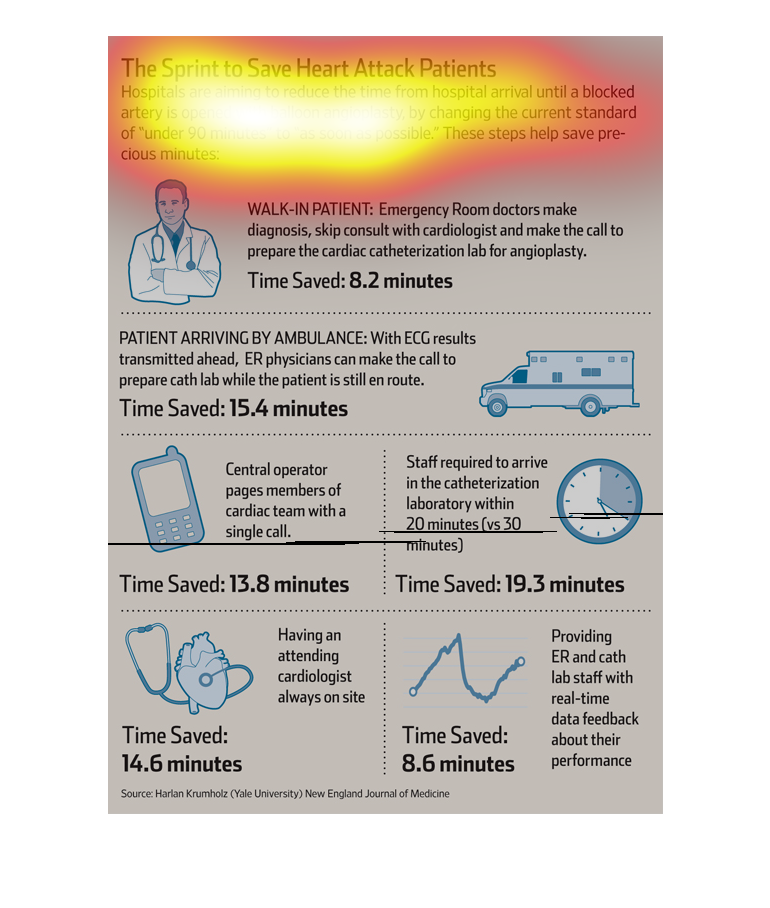
This is a series of diagrams and related statistics depicting how hospitals are trying to
improve the speed in service to reduce the likelihood of death from heart attack.
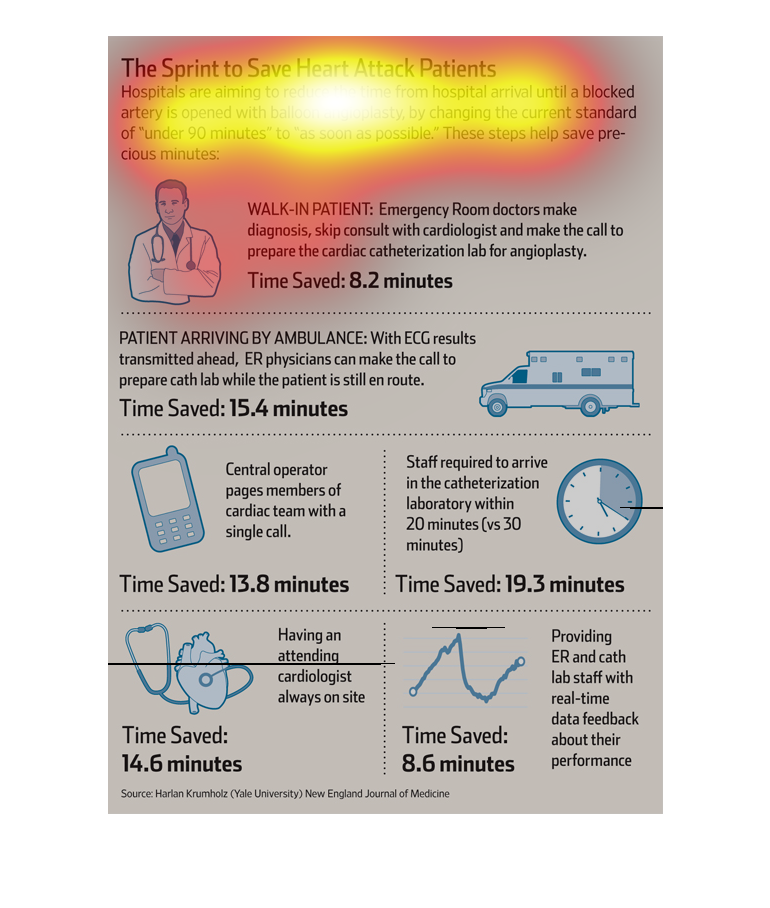
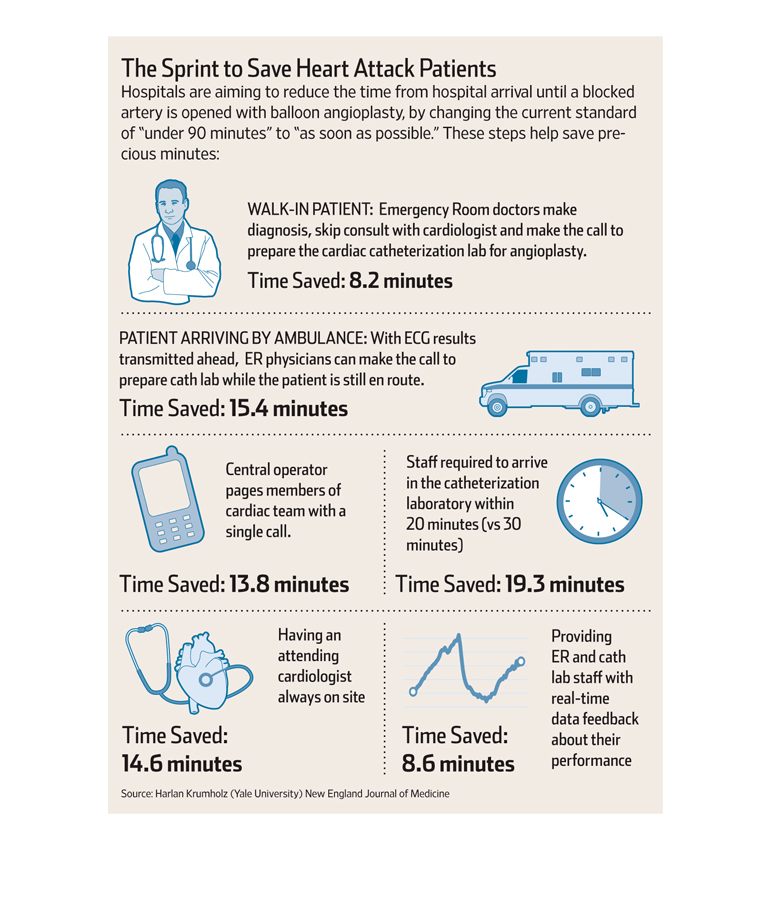
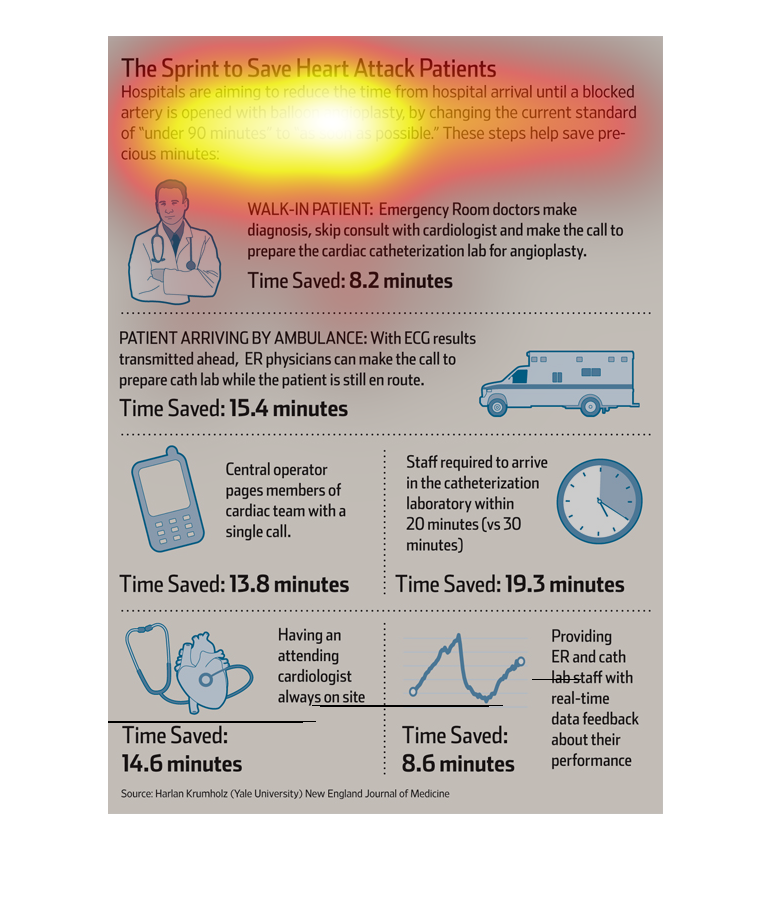
This chart talks about using balloon angioplasty for decreasing the time from hospital arrival
until a blocked artery is opened. For instance, 8.2 minutes are saved for walk in patients
showing signs of heart attack.
This chart clearly displays 'The sprint to save heart attack patients'. The chart shows how
hospitals are aiming to reduce the time it takes to start performing on a heart attack patient
once they arrive in the hospital.
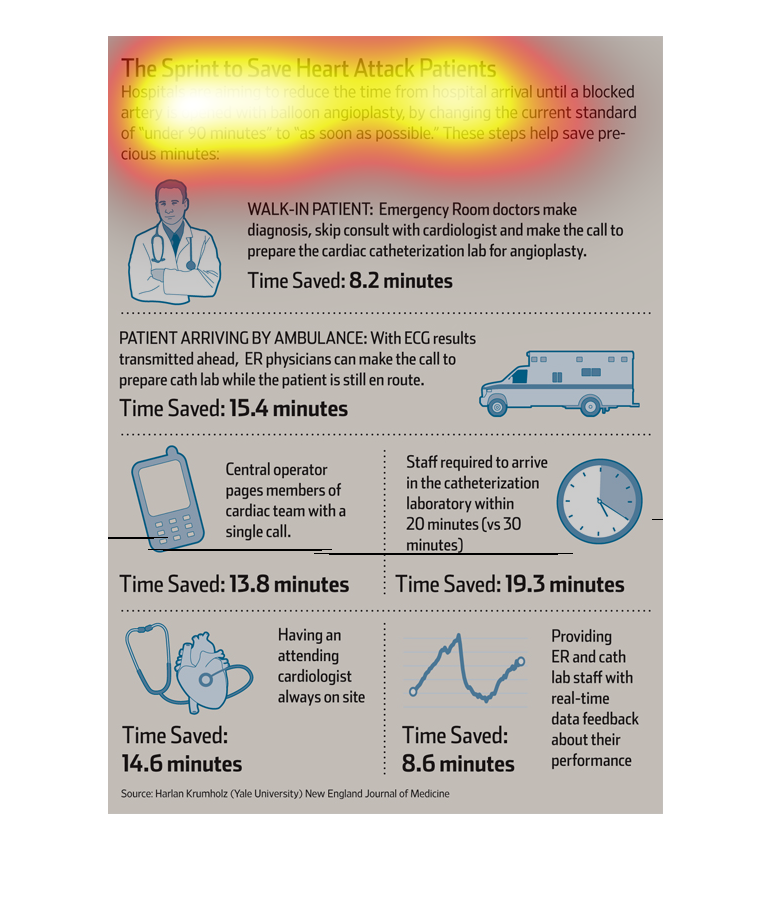
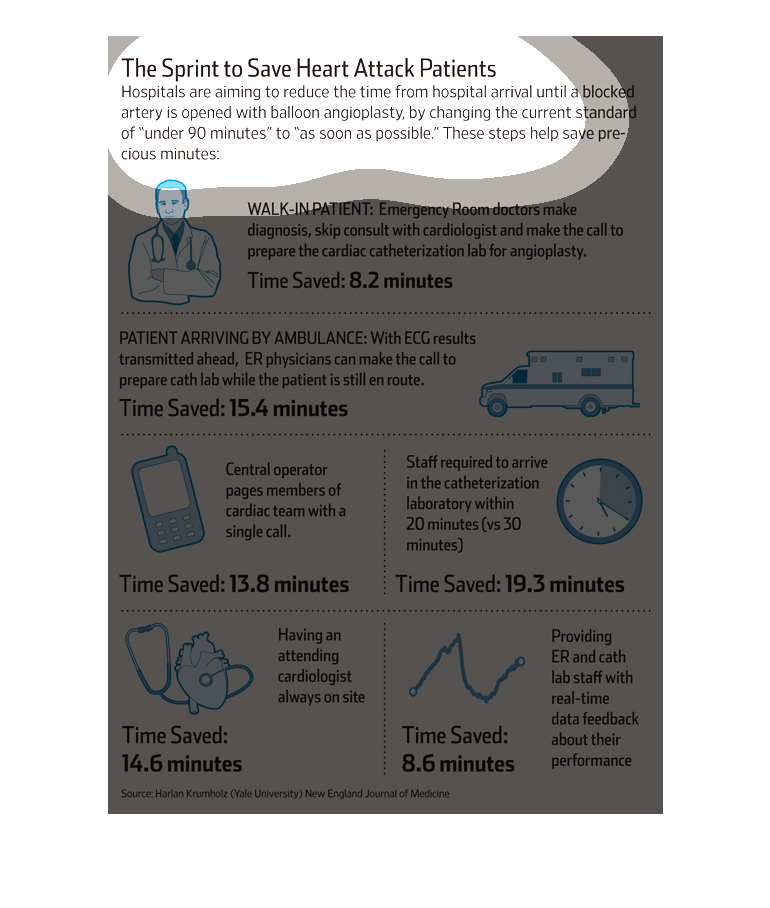
The chart show how hospitals aim to reduce the time spent in treating heart attack patients
better than than the current standard, right from time of admission. Times were reduced at
the following stages: walk-in of patient; arrival in ambulance; paging of doctor; catheterization;
availability of cardiologist and data provision.
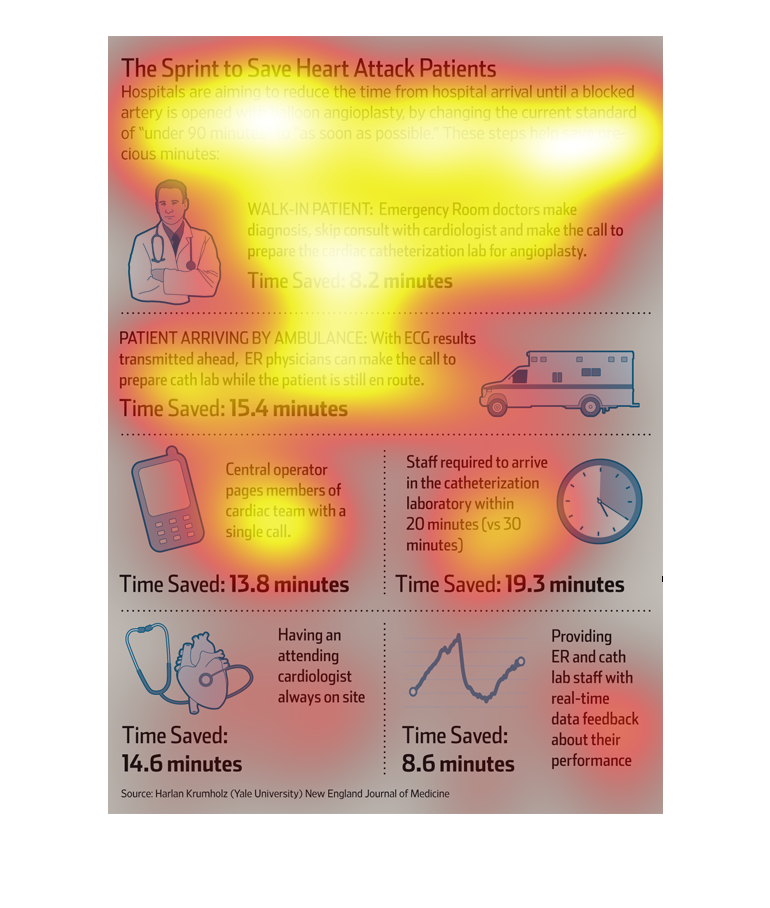
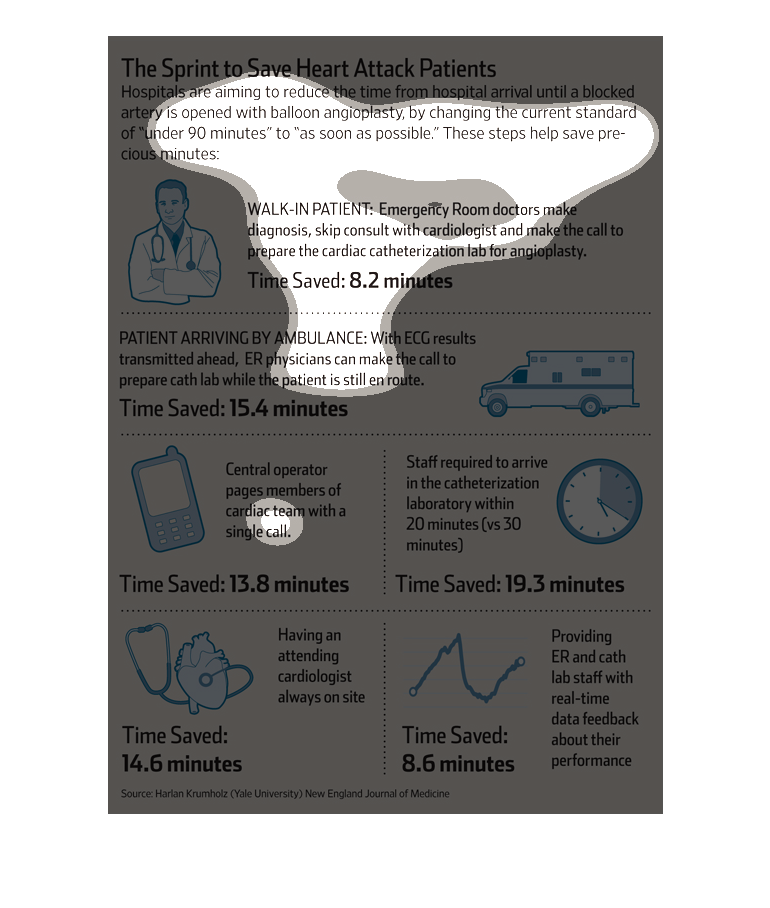
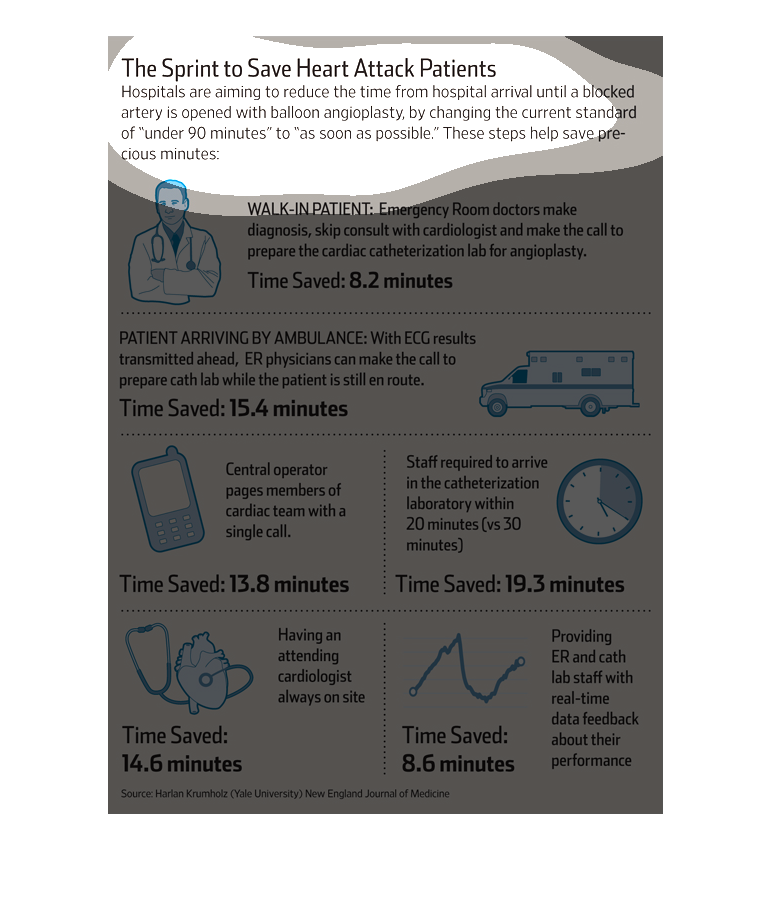
The image is detailing how time can be saved in patients presenting to hospitals with heart
attack symptoms needing balloon angioplasty. Techniques depicted in the graphic include skipping
cardiologist consult and instead having the ER doctor make the diagnosis, using ambulance
ECG results to make diagnosis, having central operator make call to cardiac team with single
call, having staff arrive in cardiac cath lab within 20 minutes instead of 30 minutes, having
an attending cardiologist on site at all times, and providing staff with real-time performance
feedback.
This chart describes the sprint to save heart attack patients.Specifically, hospitals are
aiming to reduce the time from hospital arrival unit a blocked artery is opened.
This diagram is showing ways hospitals are reducing fatal heart attacks. Ideas such as having
a cardiologist available and advanced EKG readings can reduce the amount of time waiting for
treatment.
The image describes the steps you take and a picture tutorial on how to save a heart attack
victim. it describes that you need to quickly complete all of the steps to give the person
the greatest chance of survival.
This chart talks about how they are trying to save heart attack patients by making ambulances
available, staffing appropriately to meet demands, and having everyone take cardiology classes.
A heart attack is serious business. This illustration shows that the fault of having the heart
attack is hard to figure out because there are so many variables, then after said heart attack
the procedure in which the patient goes to the emergency hospital and all that.
This chart describes the sprint to save heart attack patients. Specifically, hospitals are
aiming to reduce the time from hospital arrival unit a blocked artery is opened.
This chart describes changes hospitals have made to reduce the amount of time until a heart
attack patient has life saving angioplasty. Having a cardiologist always on site, being able
to reach all team members with a single call, and reducing the time limit team members have
before they need to report have saved precious minutes.