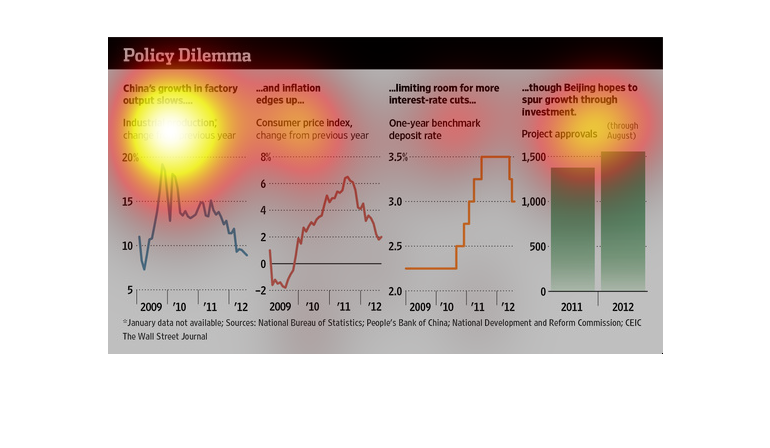
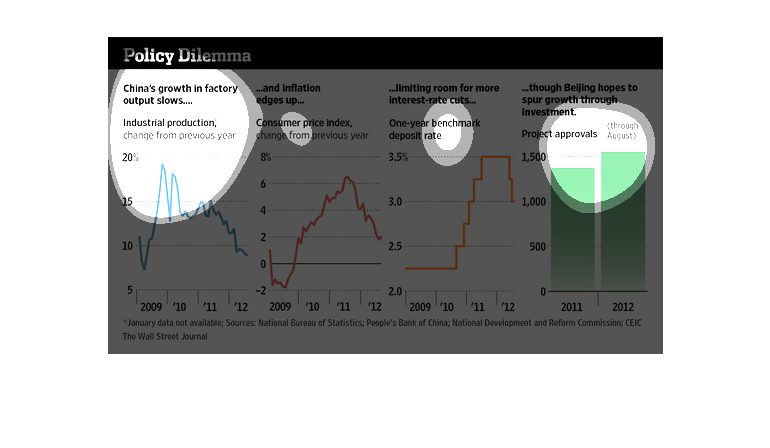
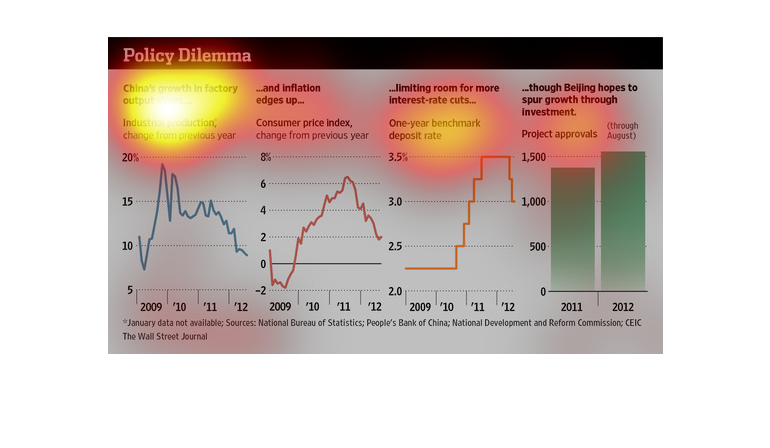
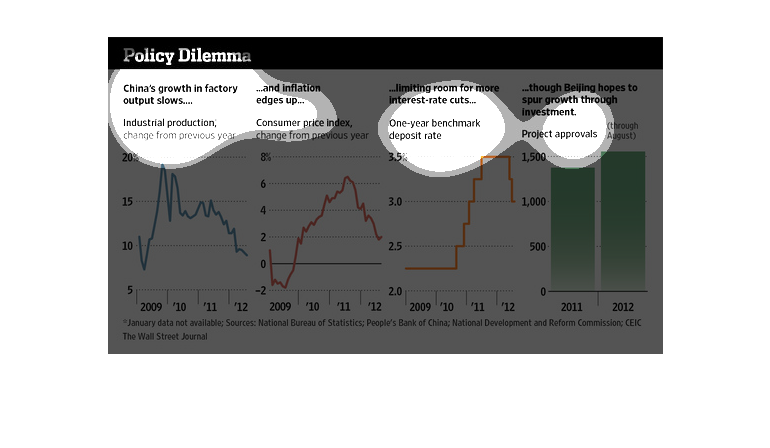
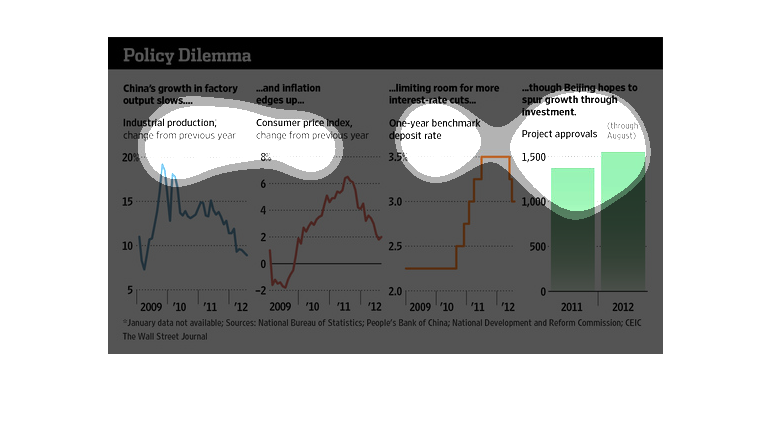
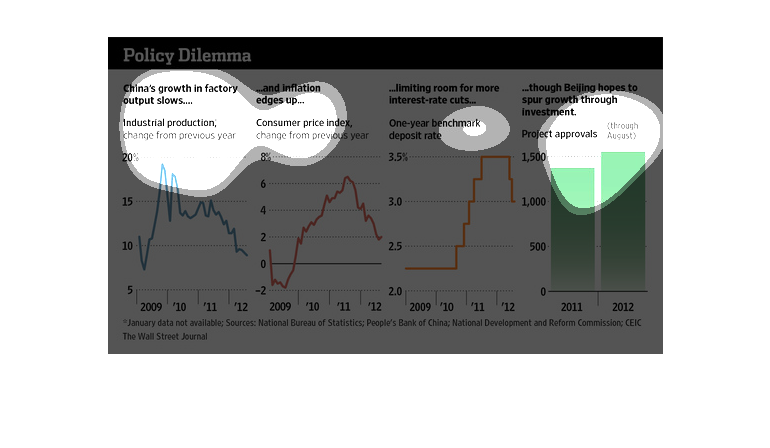
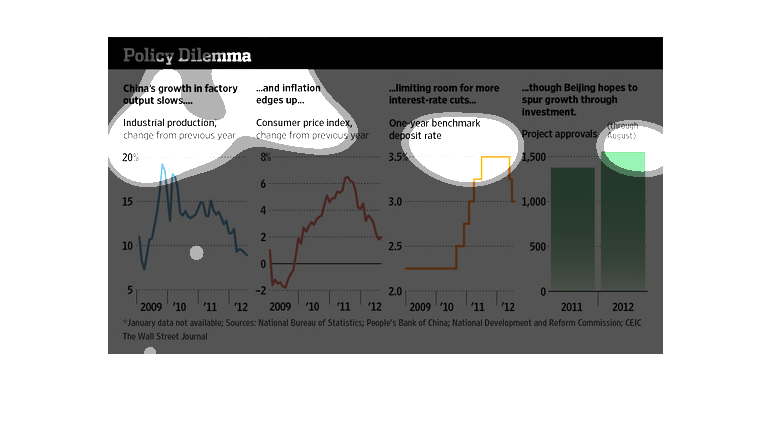
The image depicts slowing growth in Chinese factory output, with inflation increasing, and
China's attempts to correct the issue. Data ranges from 2009-2012.
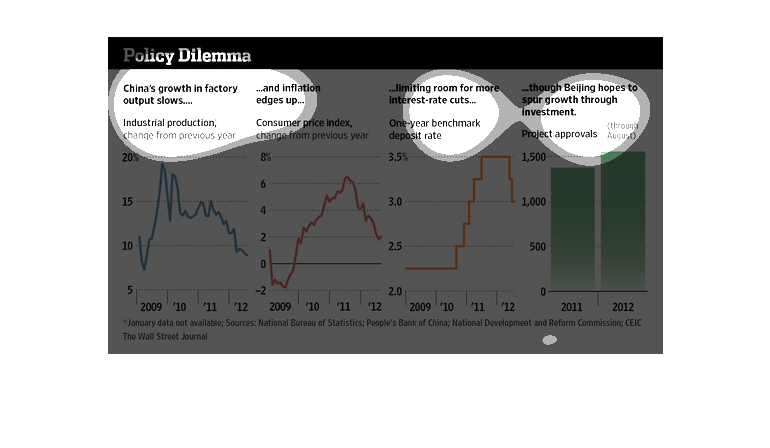
This chart describes China's slowing factory output growth, Consumer price index, interest
rates, and project approvals. Industrial production was down in 2012, but interest rates and
product approval were higher.
This chart is about the policy dilemma. Specifically for China. Their factory output is slowing
down, inflation is going up, and limiting room for interest rate cuts. Bejing is optimistic
in thinking it will solve the growth issue through investment
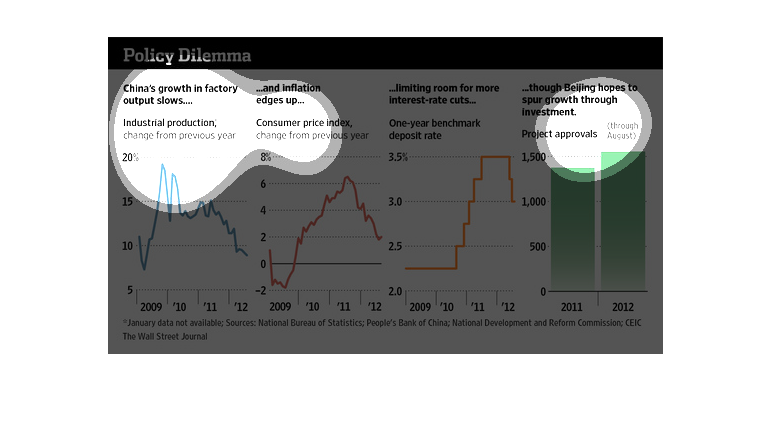
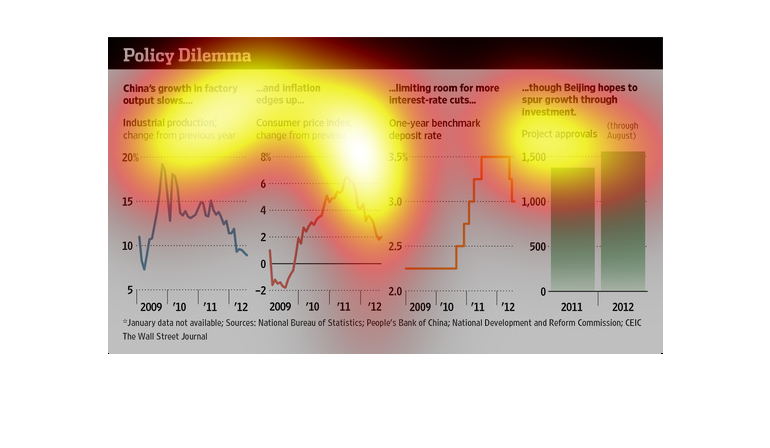
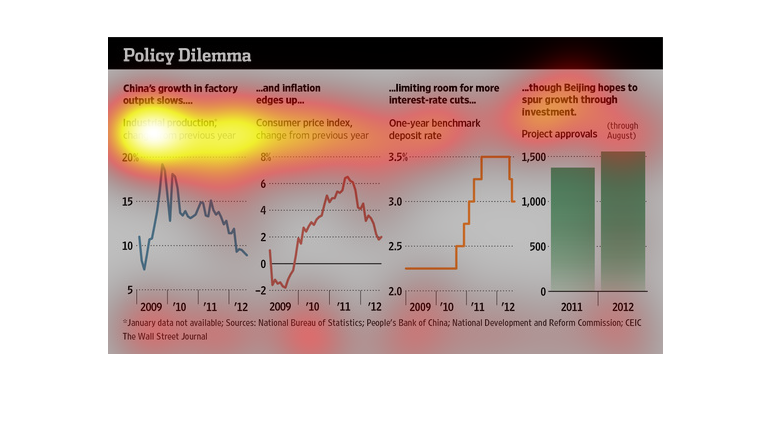
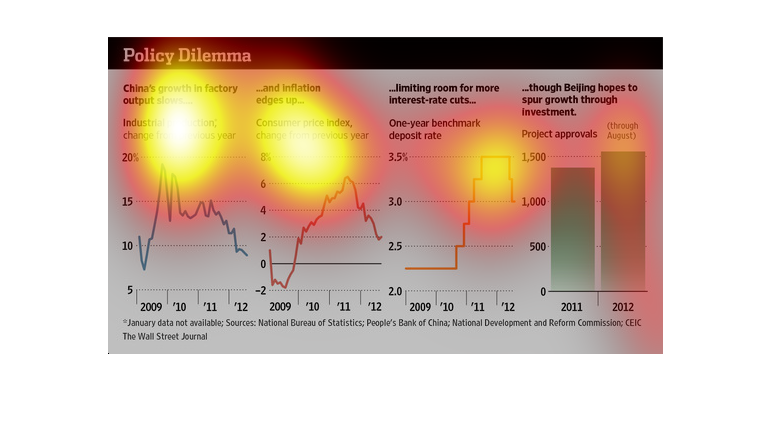
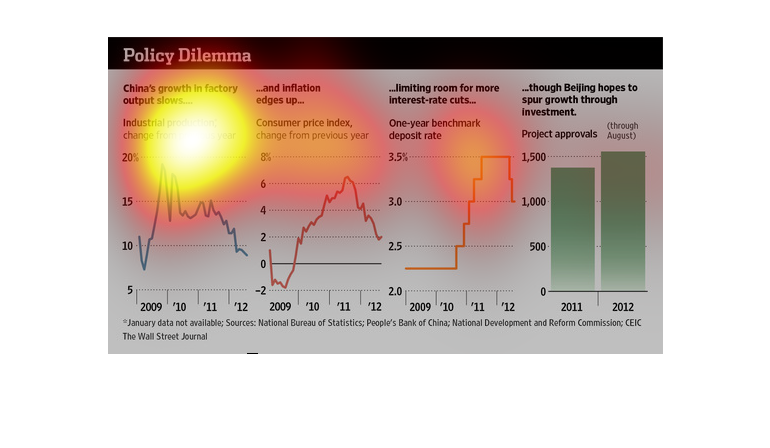
As this graphic shows, from a study conducted from 2009 to 2012, China right now is going
through a period of stagnating economical growth, which everybody is waiting for the other
shoe to drop.
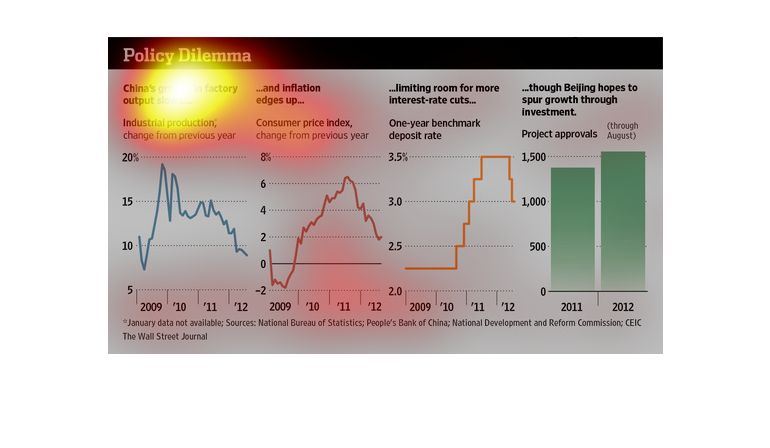
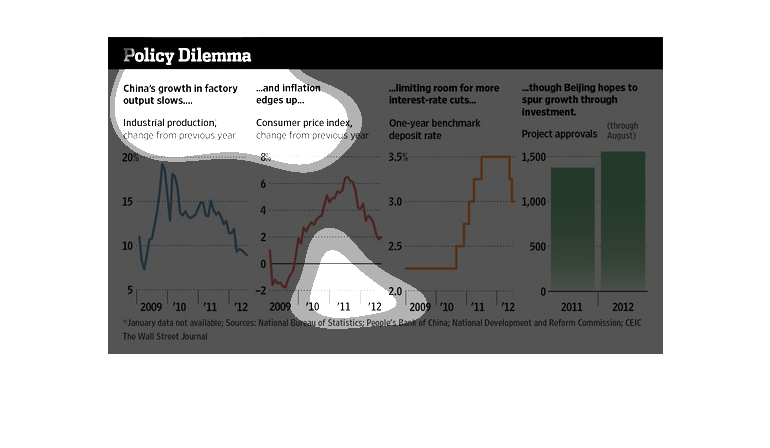
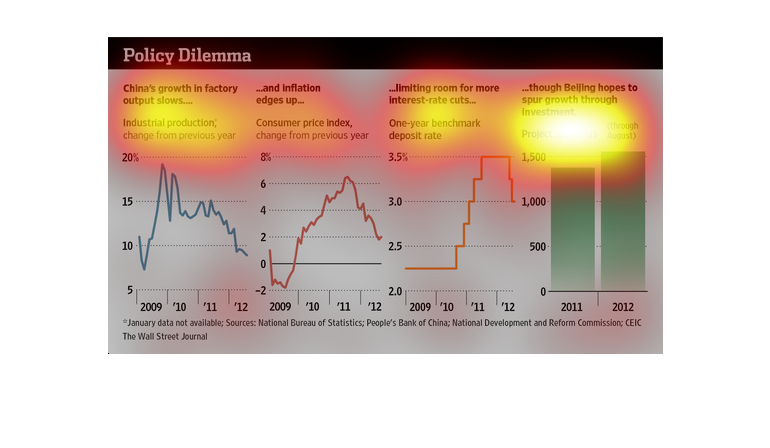
Graph shows policy dilemmas for China for time period of 2009-2012. It shows Industrial production,
Consumer  Pricing Index, deposit rate and Project approvals.
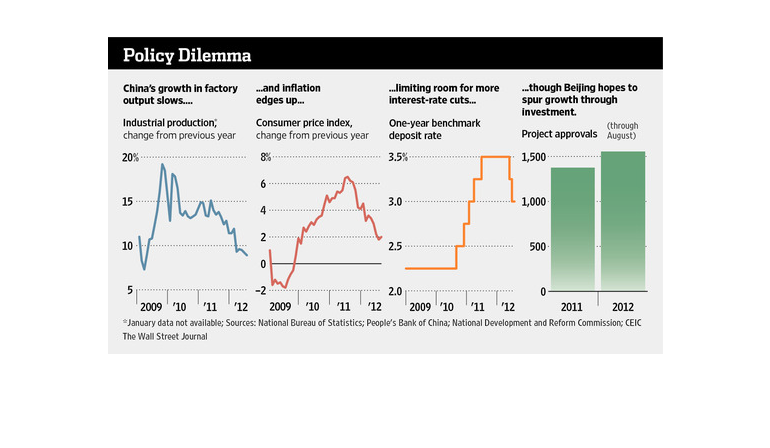
This chart describes policy dilemma. Specifically, China's growth in factory output slows.
Categories include inflation edges up, and limiting room for more.
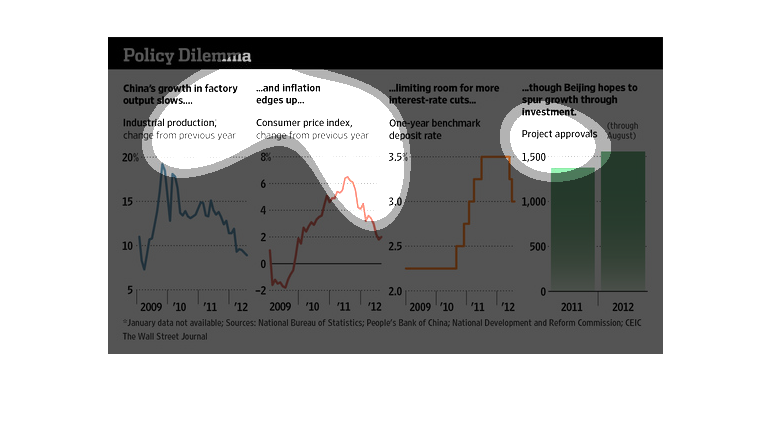
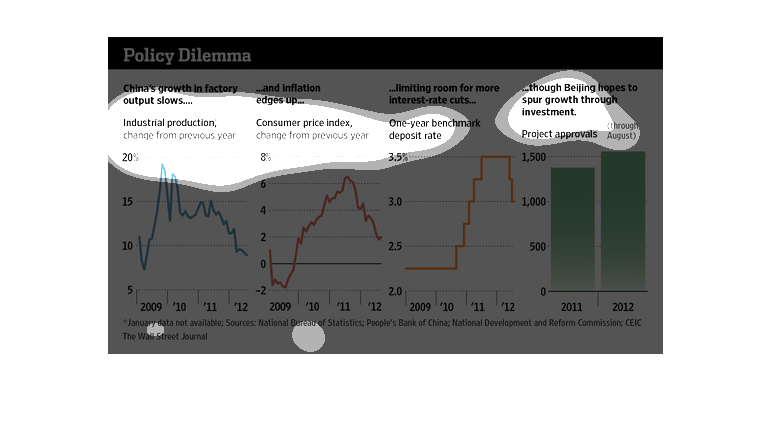
This is a series of graphs detailing market conditions that lead to economic policy changes
in China. Production is down, inflation is climbing, and interest rates can't be cut. The
government is combating this through investment.
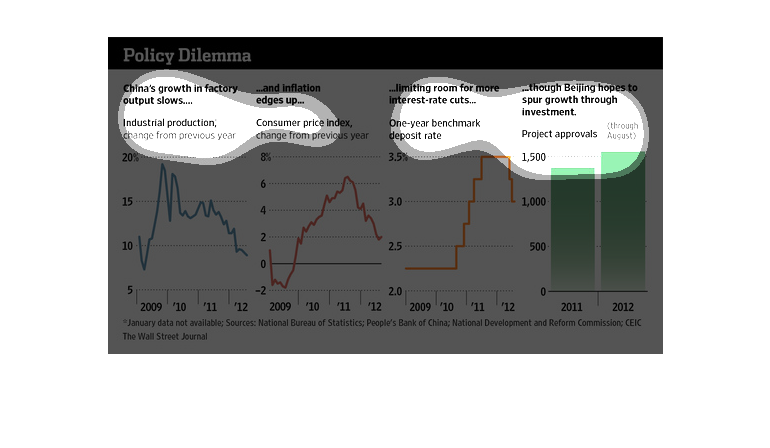
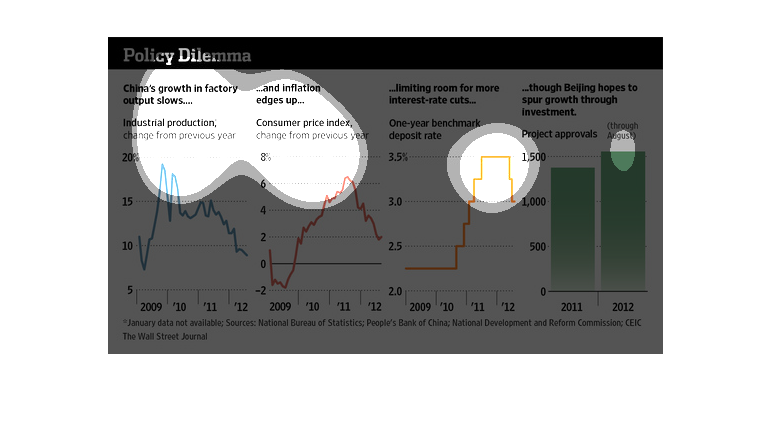
Shows China's industrial production over the years and also shows the spur they thought Beijing
olympics would have. This infor is from the people's bank of China and published in the Wall
Street journal.
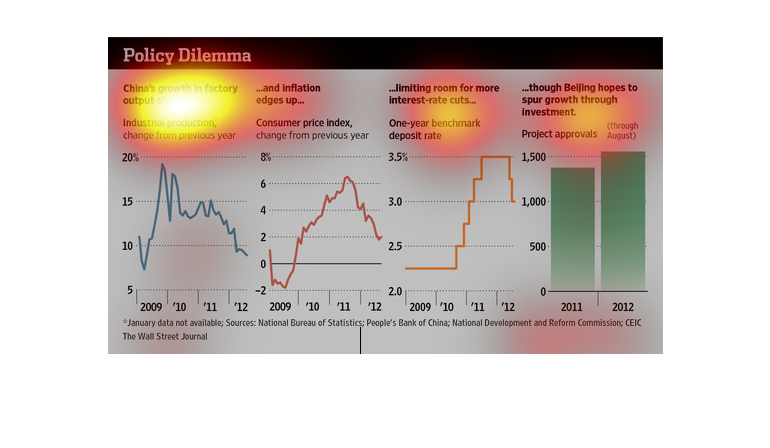
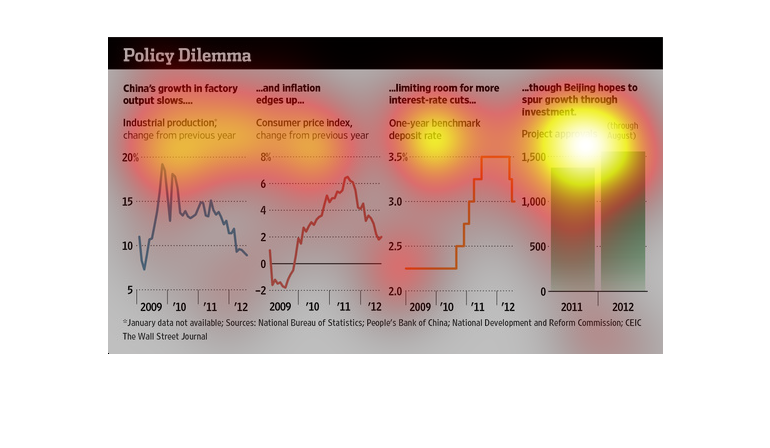
The image depicts China's growth in factory output slowing, with inflation increasing, which
disallows for more interest rate cuts. The Chinese government is looking to increase growth
by instead choosing to invest in their country to offset output slowdown.
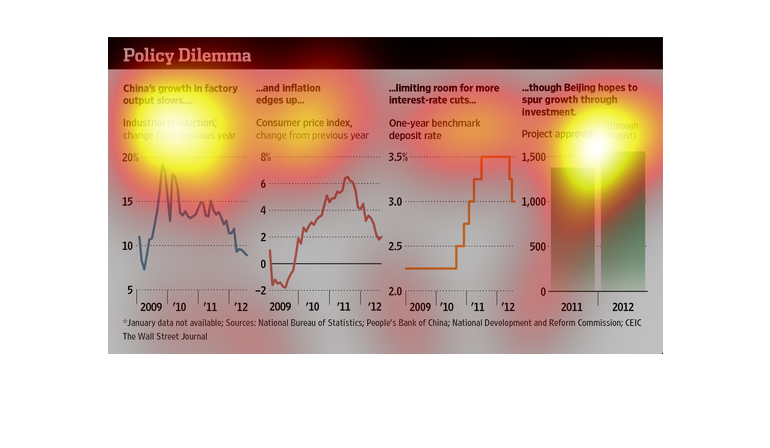
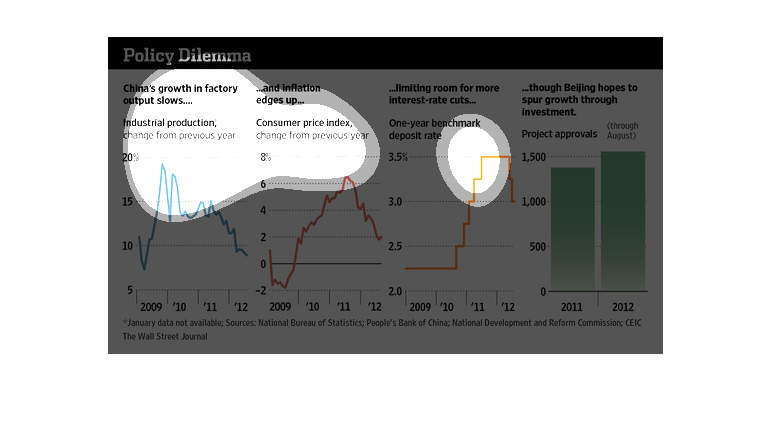
This is a series of color coded charts, graphs and related statistics depicting the challenges
for Chinas economy as factory output declined and inflation grew.
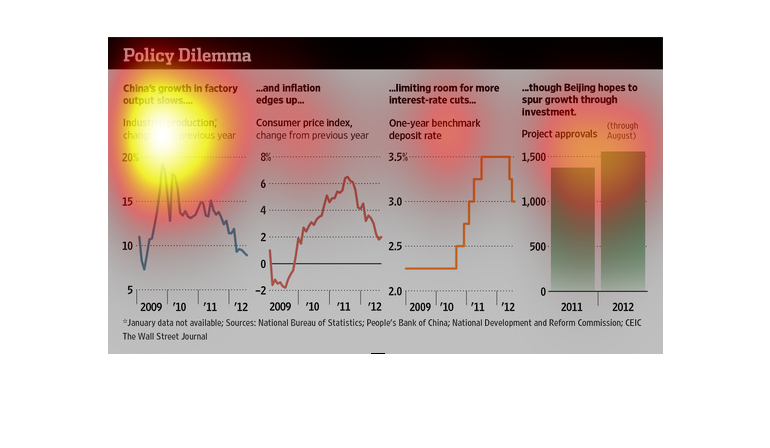
This graph illustrates policy dilemma with figures such as industrial production rates, consumer
price index, one year benchmark deposit rates, and project approvals.
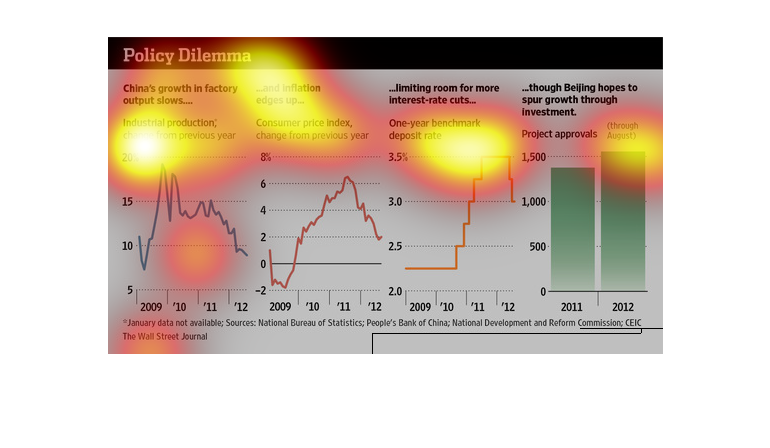
This is a series of color coded charts and graphs depicting the challenges China faces as
it's growth in factory output slows and inflation edges upward.
There are four different graphs shown: Graph #1: "China's growth in factory output slows..."
Graph #2: "...And inflation edges up... Graph #3: "... Limiting room for more interest-rate
cuts... Graph #4: "... Though Beijing hopes to spur growth through investment."