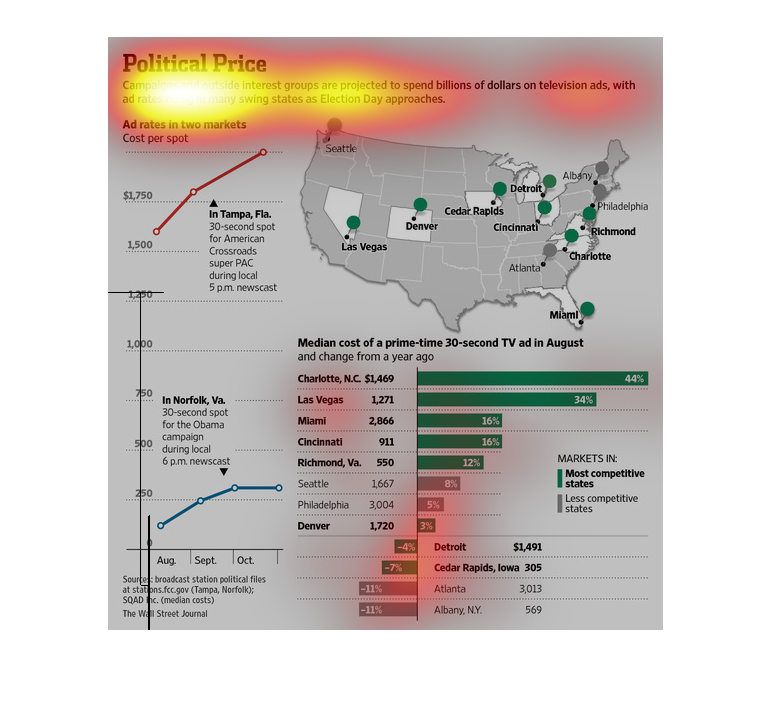
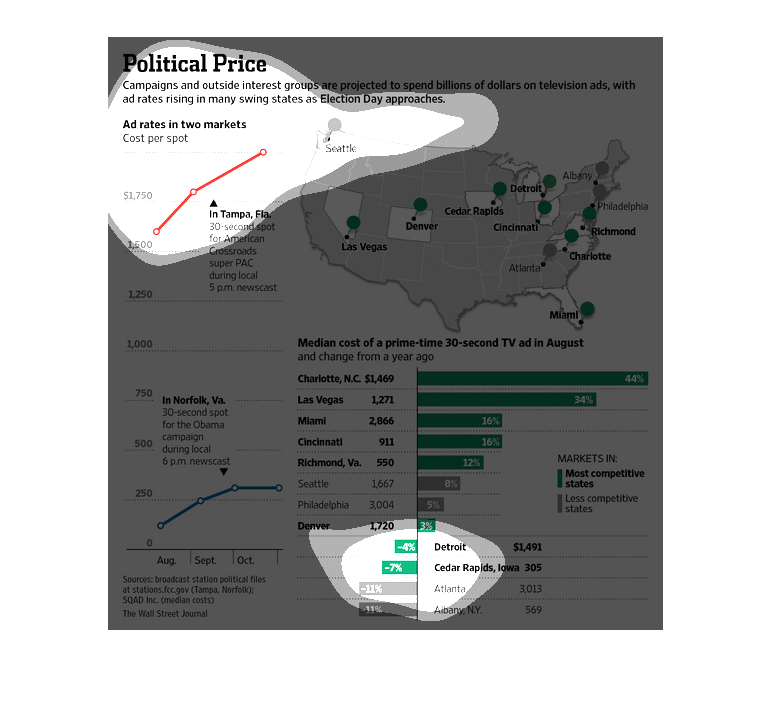
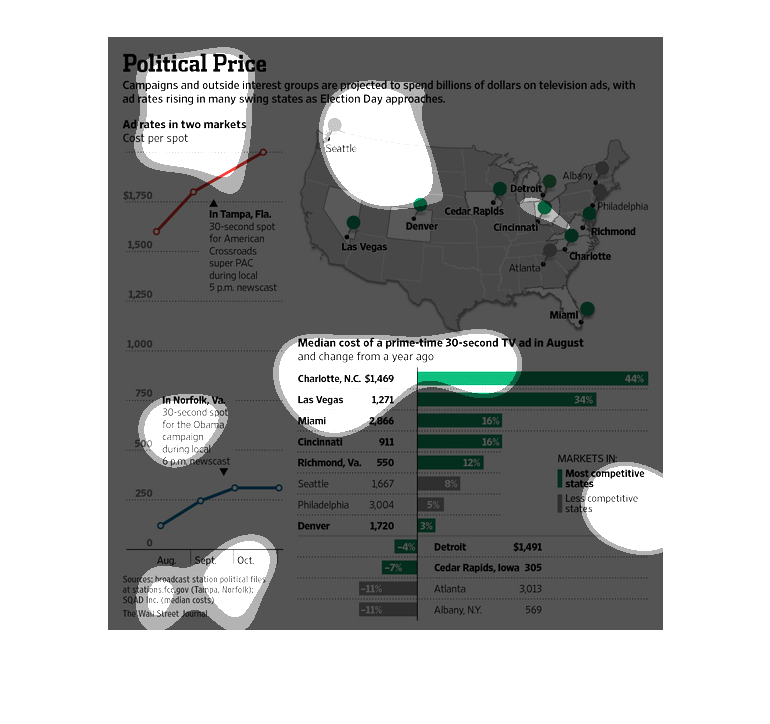
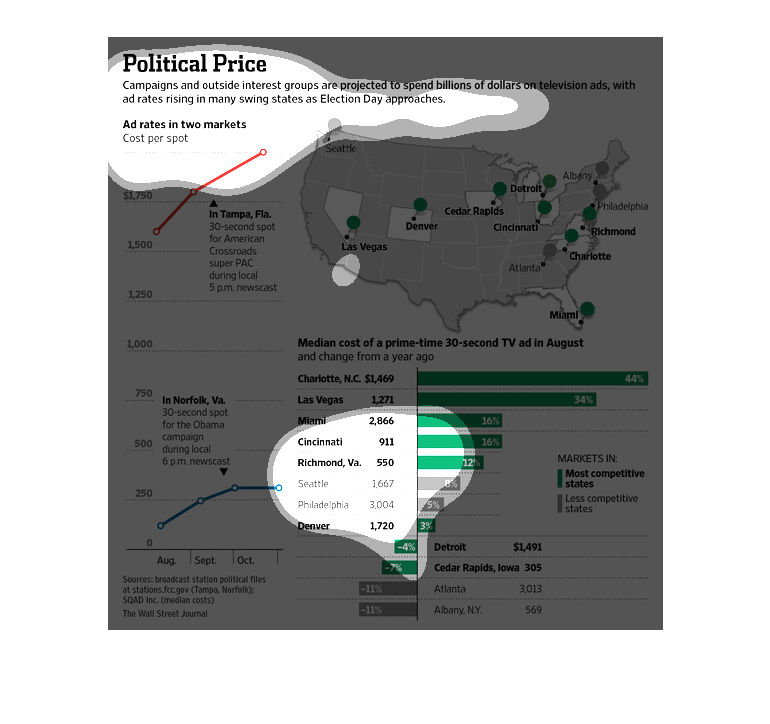
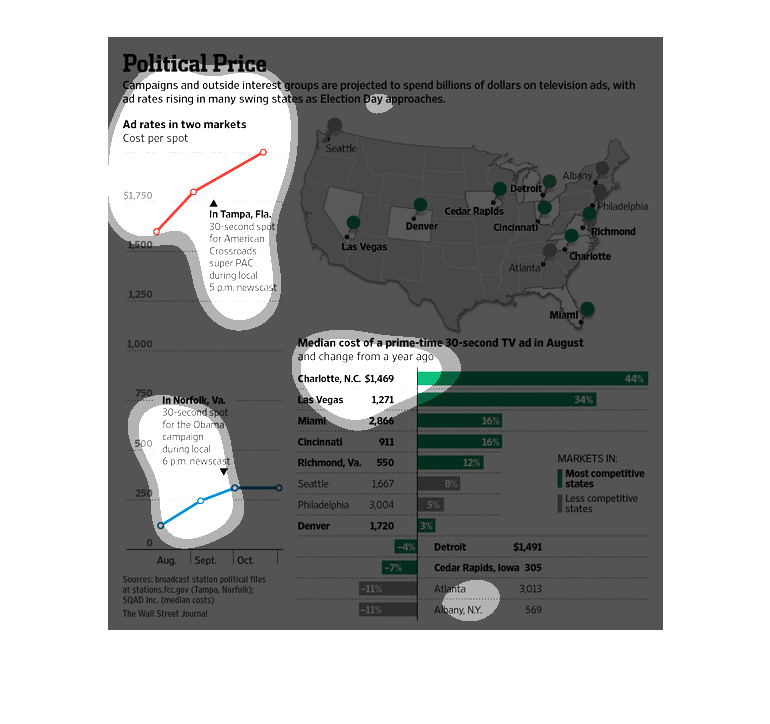
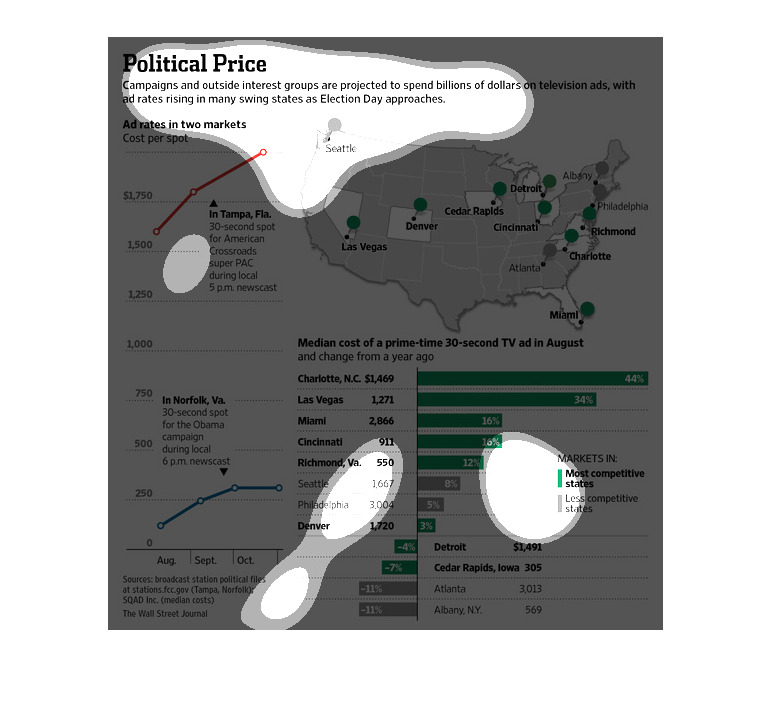
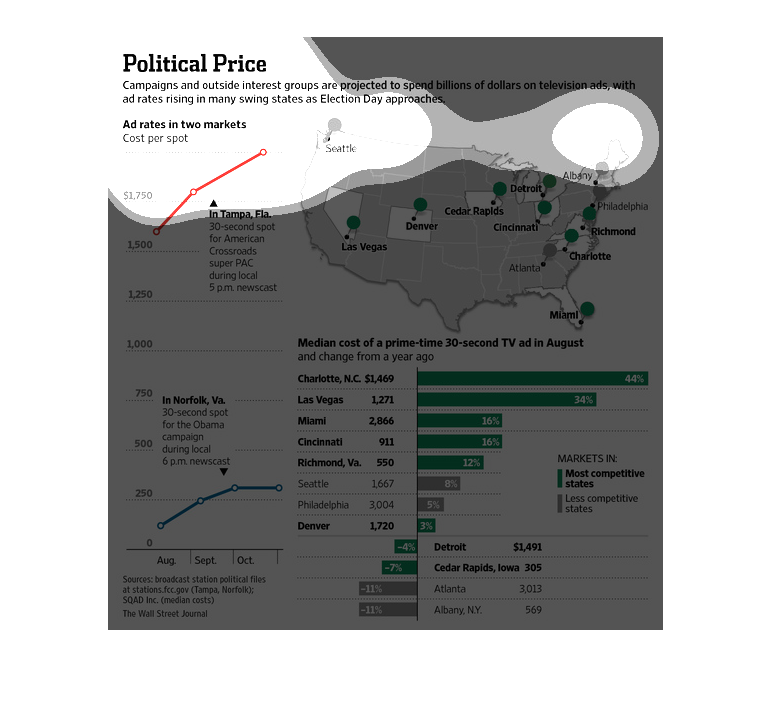
This graph describes the increasing cost of television advertisements, looking specifically
at multiple cities in the United States, such as Las Vegas NV and Charlotte NC. While most
cities show an increase in ad cost, some cities such as Detroit and Atlanta show a decrease
in cost.


The graph is titled "Political Price" and depicts the amount of money that campaigns and outside
groups are proposed to spend on television ads. The graph explores ad rates in varying states
and the media cost of a 30 second television show.
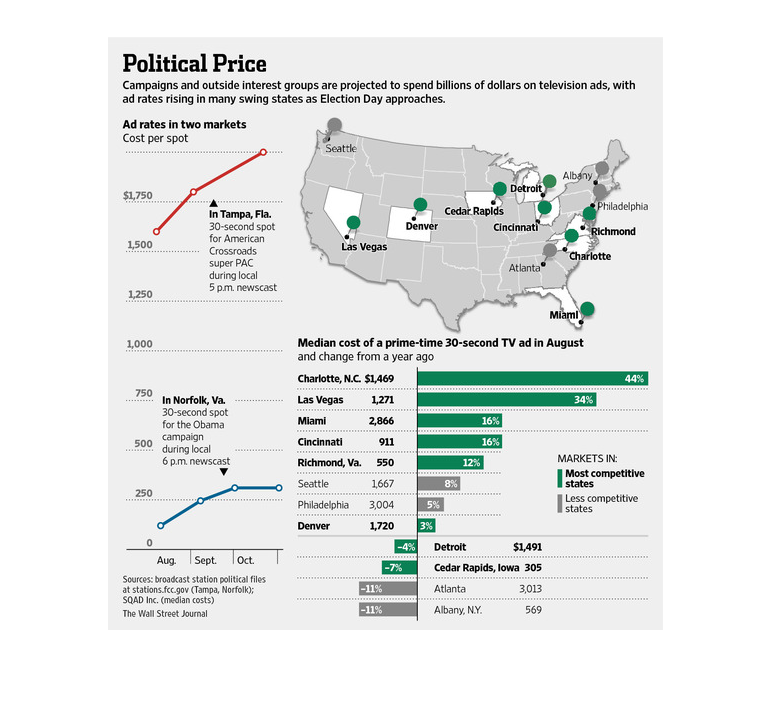
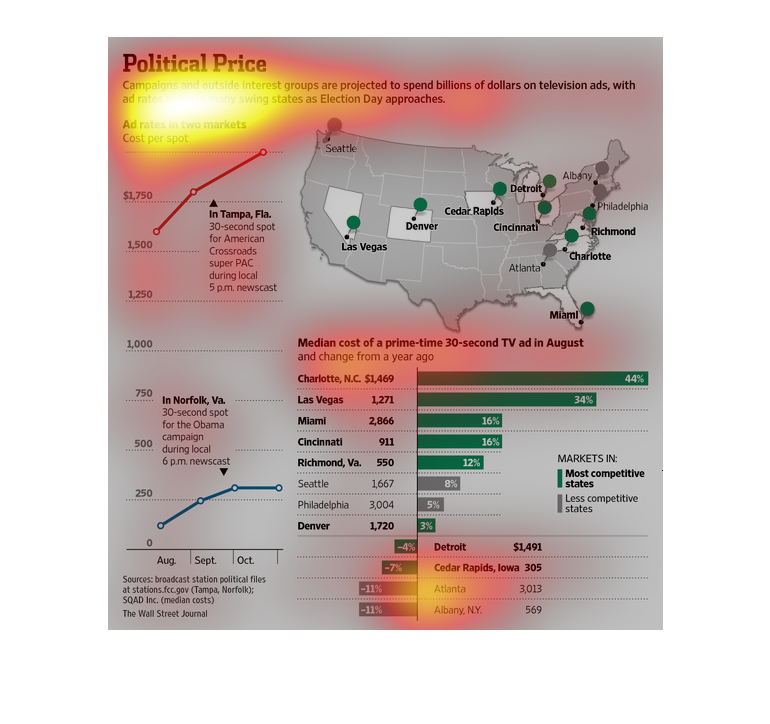
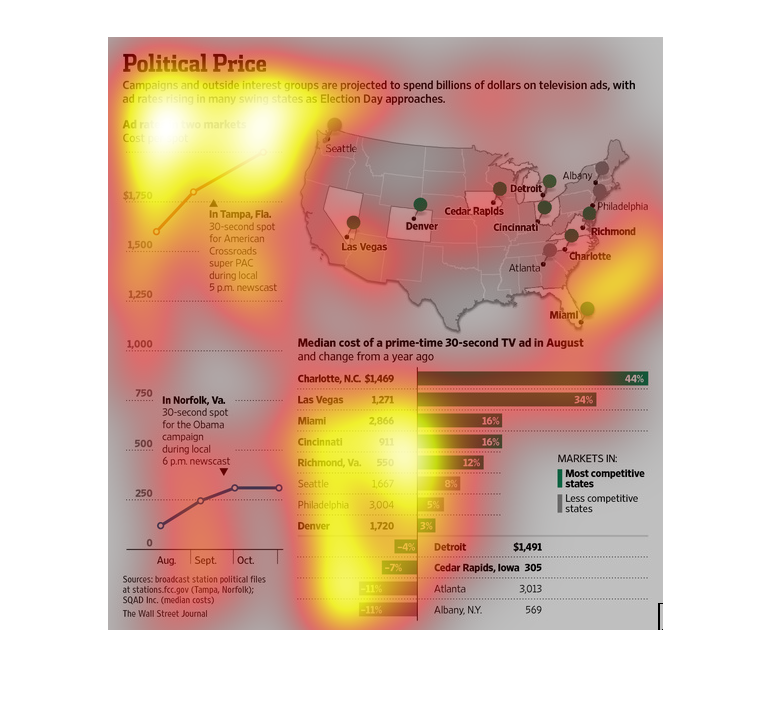
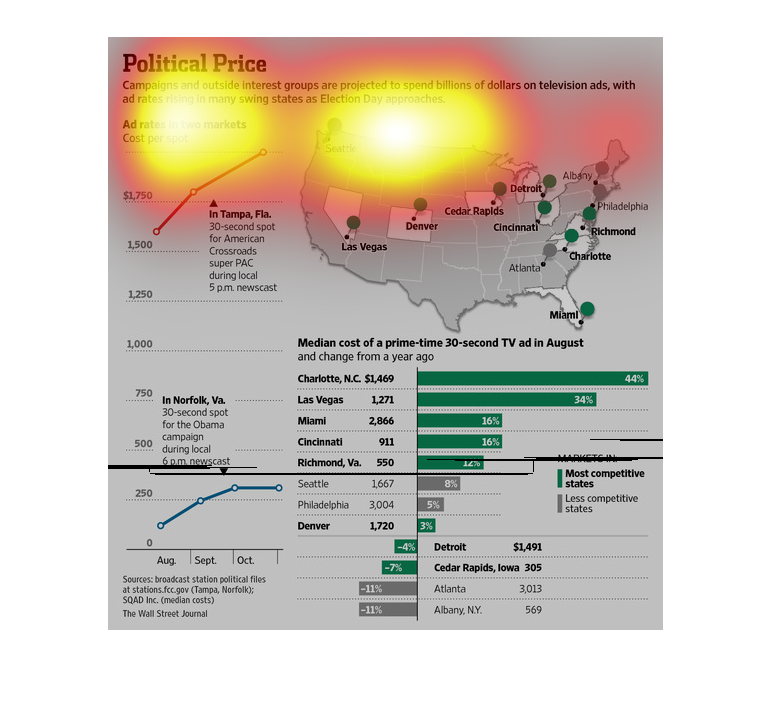
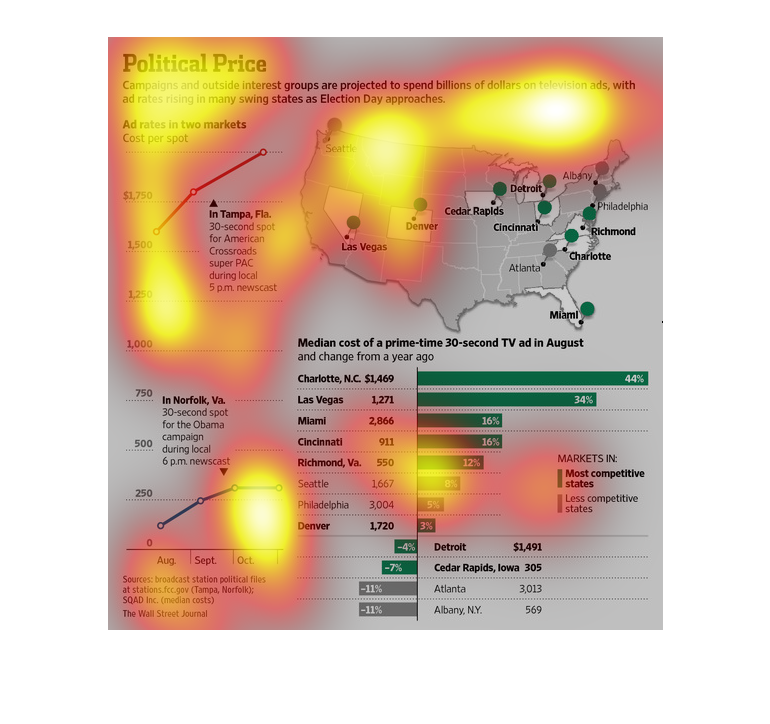
This chart describes political price. Specifically, campaigns and outside interest groups
are projected to spend billions of dollars on television ads.
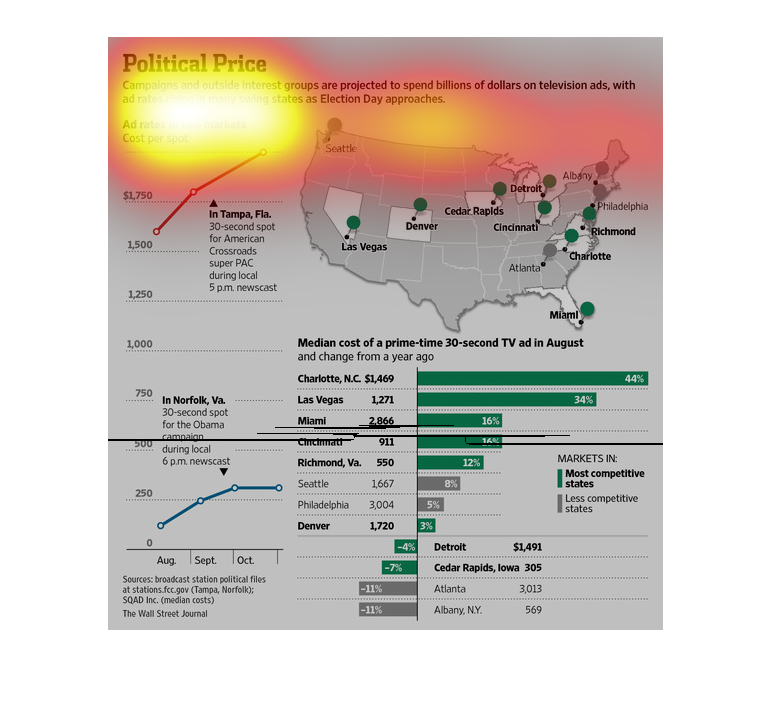
This is a series of charts and graphs that illustrated ad rates by medium for politic and
the cost of 30 second prime time ads by city for most competitive and least competitive markets,
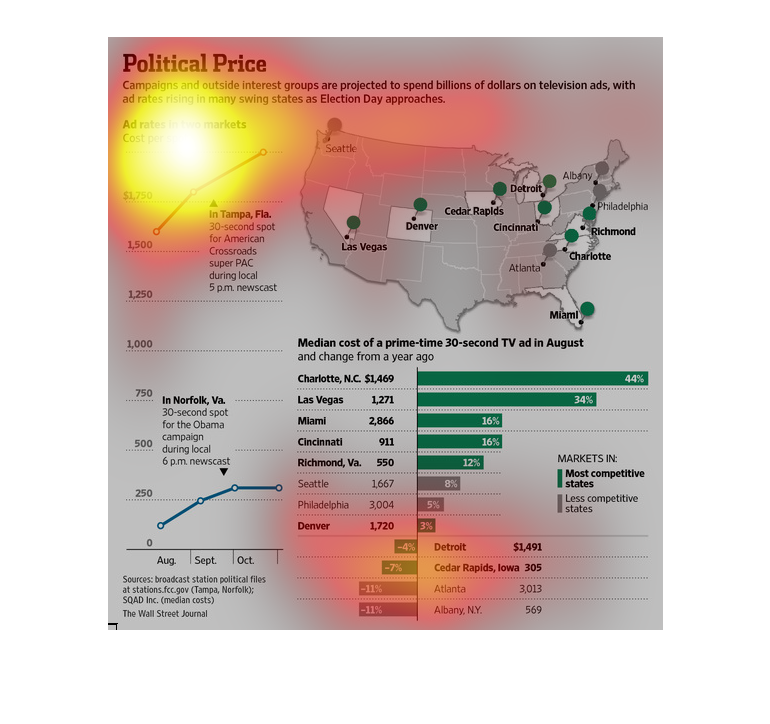
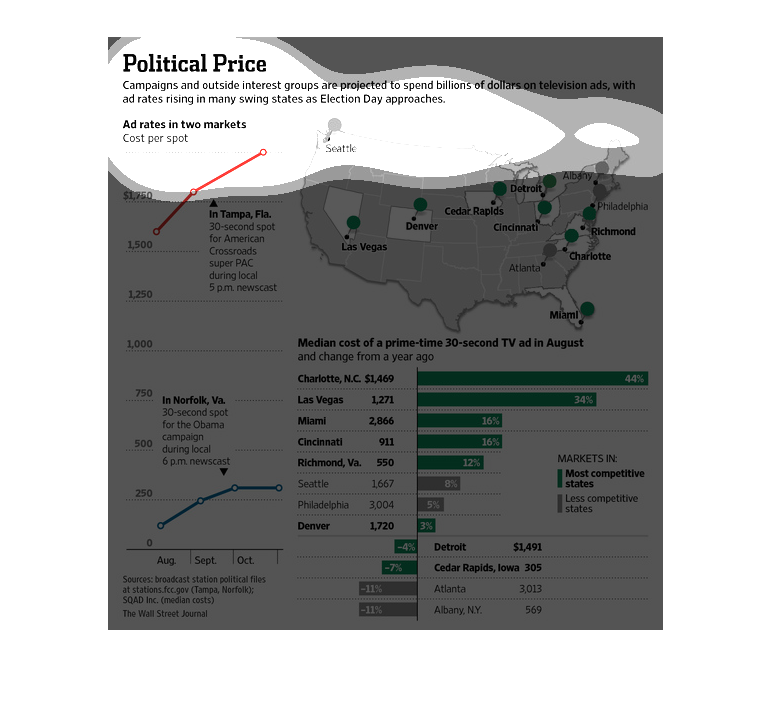
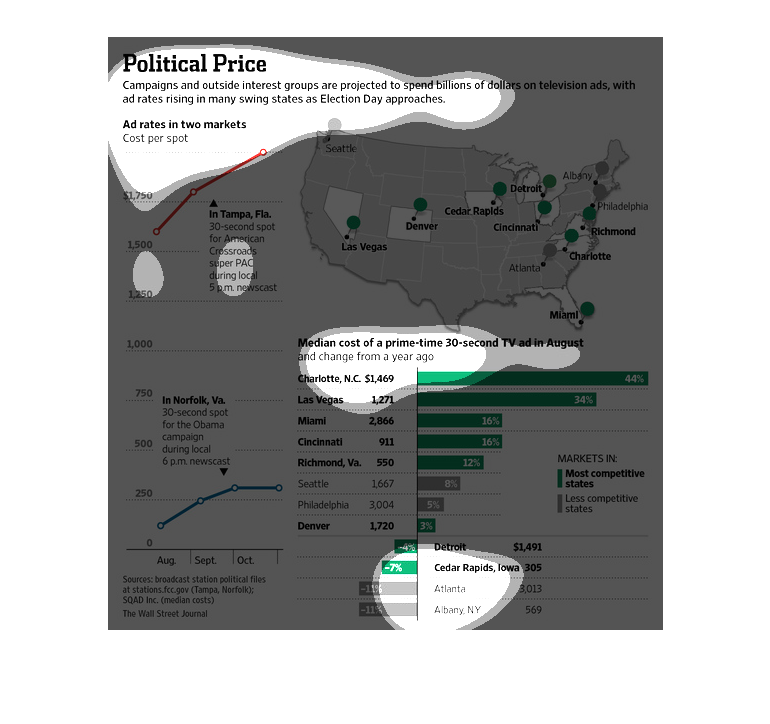
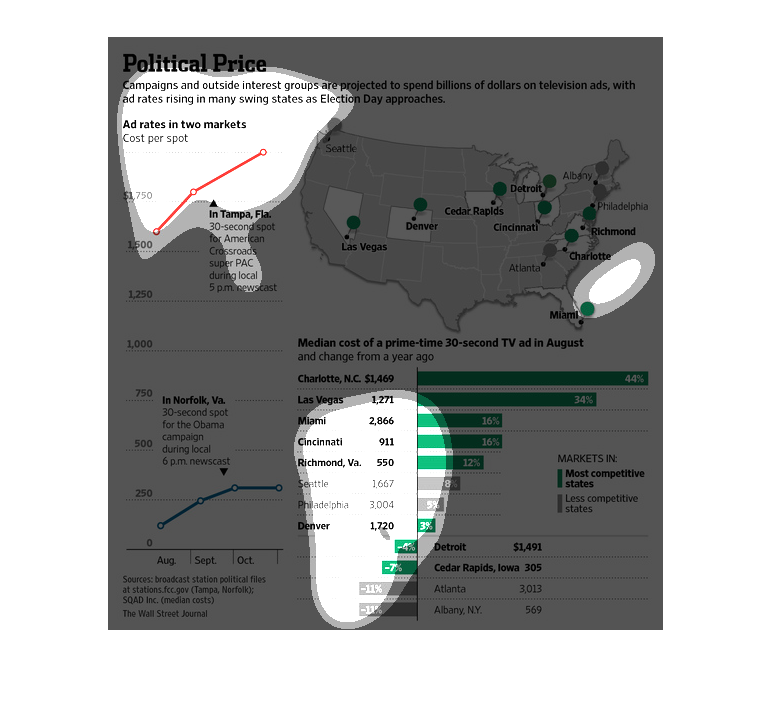
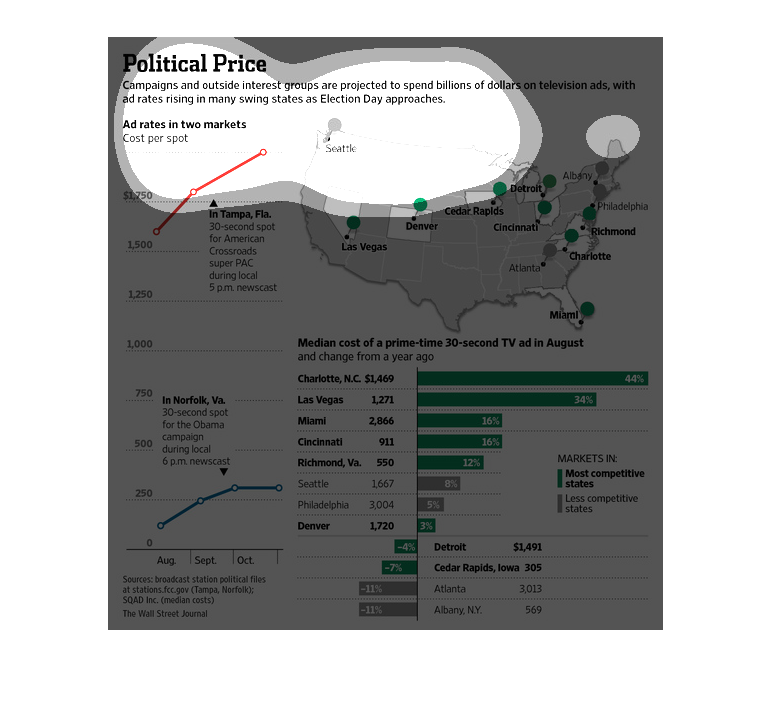
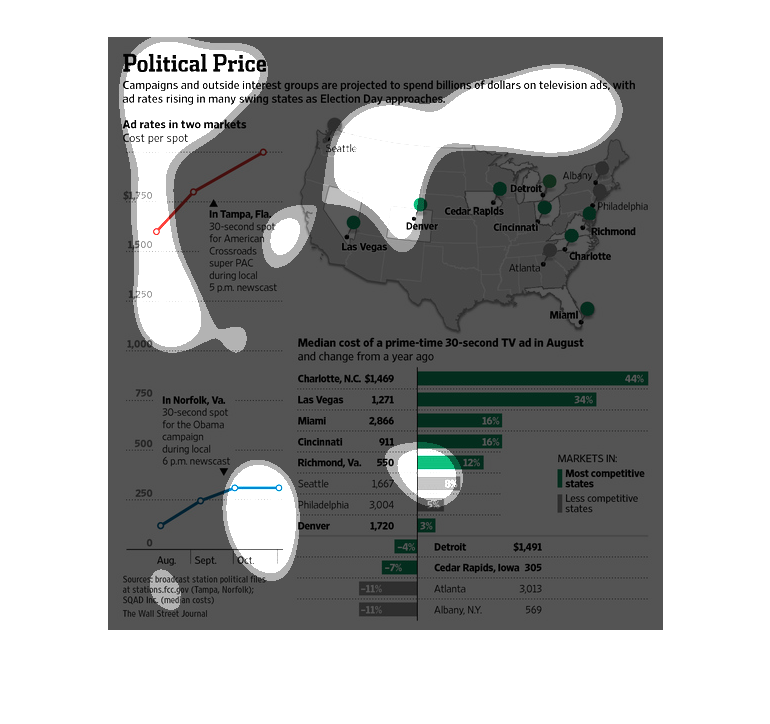
This chart describes political price. Specifically, it states that campaigns and outside interest
group are projected to spend billions of dollars on television ads.
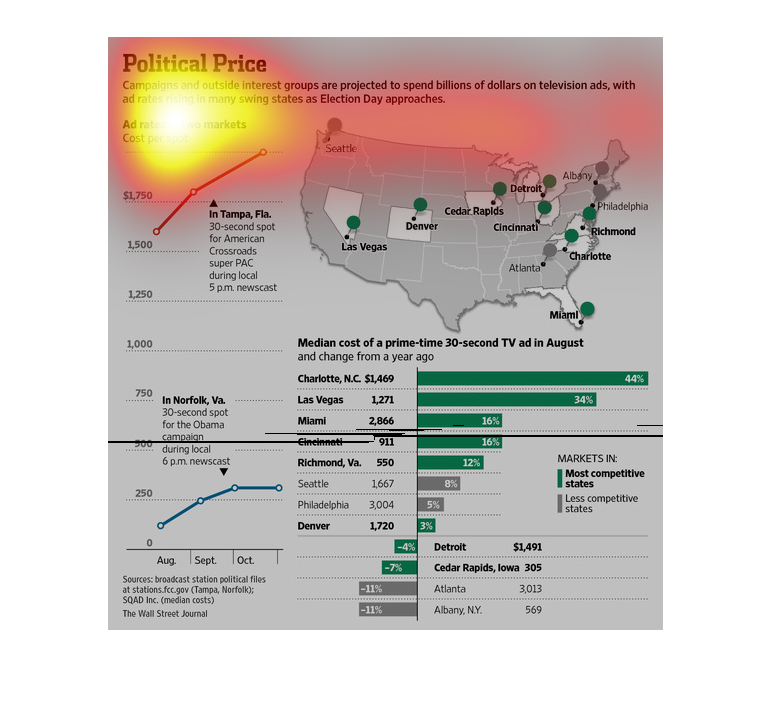
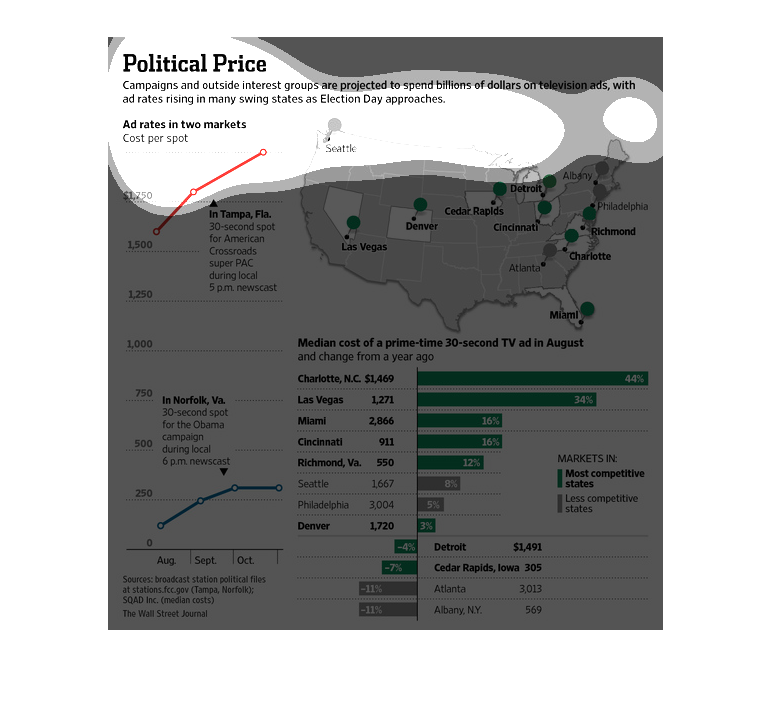
This is an infographic detailing the rise in cost for political advertisements, especially
in the wing states. It seems that Charlotte, North Carolina, and Las Vegas, Nevada are 2 of
the most expensive to campaign in.
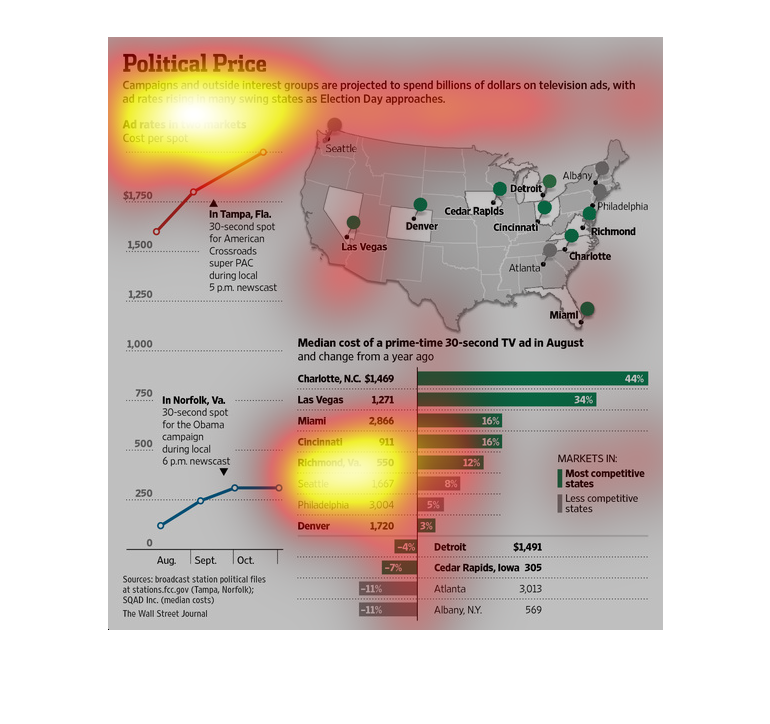
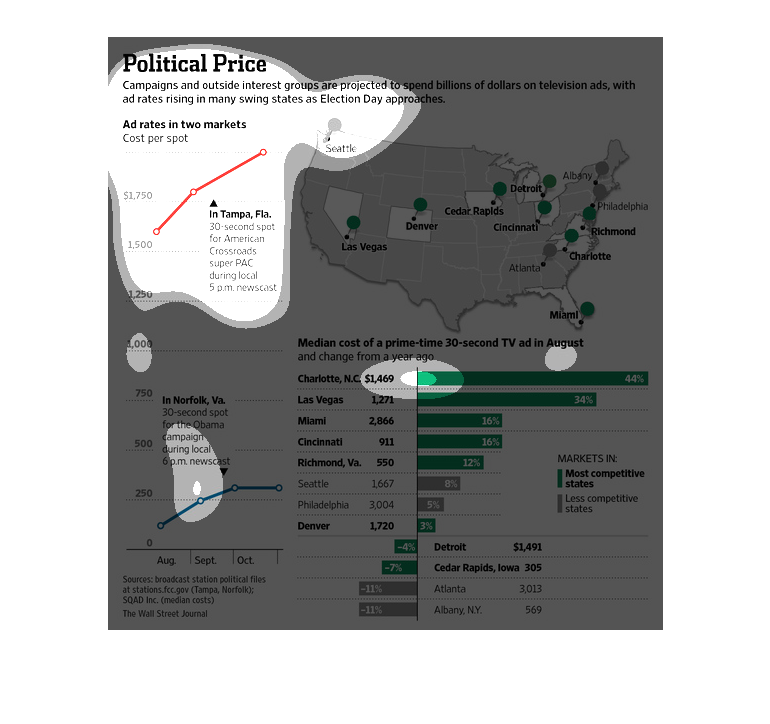
This series of charts shows the growing rise of commericial air time costs relative to various
cities across the country.  Ad prices have risen in all markets shown except four: Detroit,
Cedar Rapids, Atlanta, and Albany.
This chart shows how much money is spent on campaign advertising. It compares ad rates in
Tampa and Norfolk. In Tampa a 30 second spot costs over $1700. Ad costs have increased in
Charlotte by 44% in the past year but have decreased in Cedar Rapids. Iowa.
Two parts to the image. Top part shows the political campaign spending for ads. It compares
some markets across US. Bottom part of the image shows the data in a comparative way.
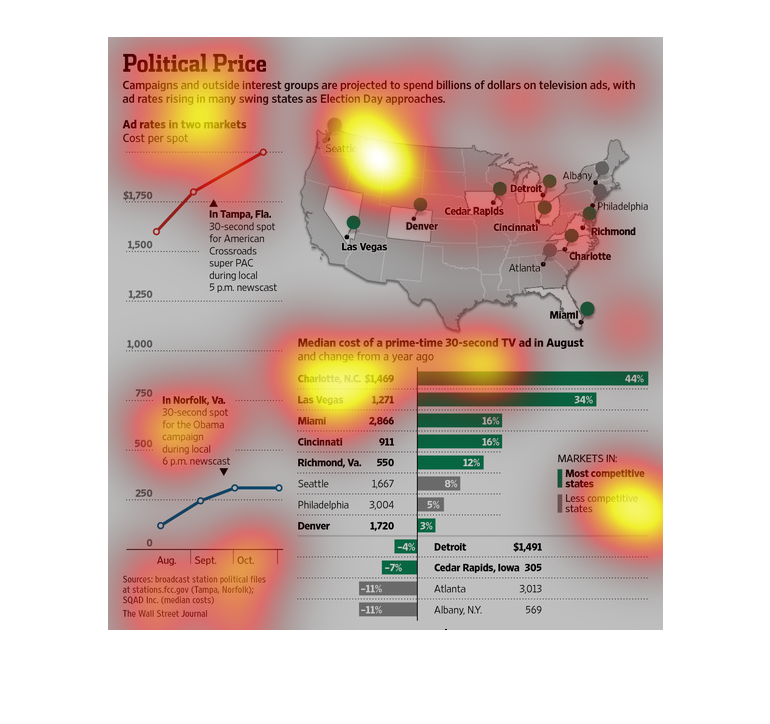
The image depicts how campaigns and outside interest groups are projecting billions in ad
spending within battleground states, as well as high ad rates within those states versus other
states.
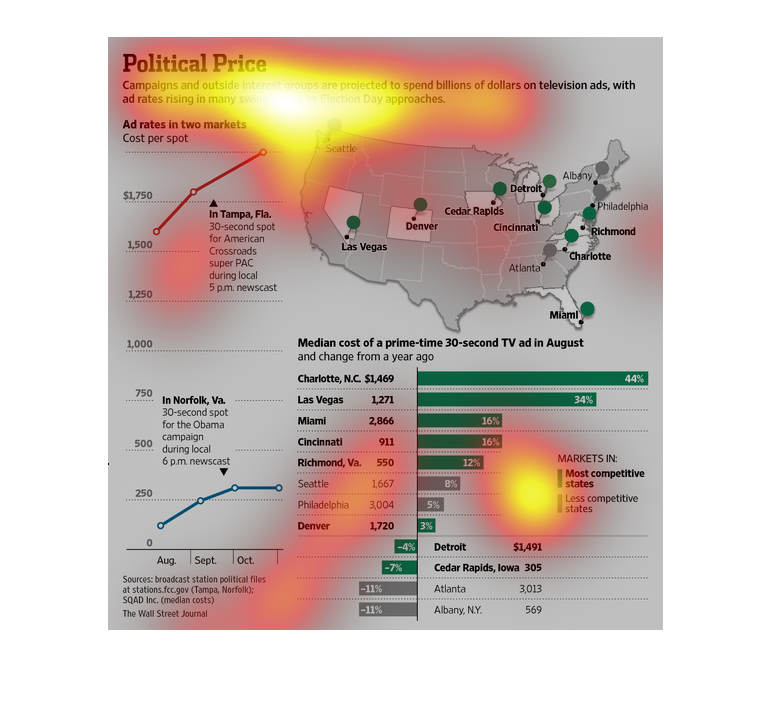
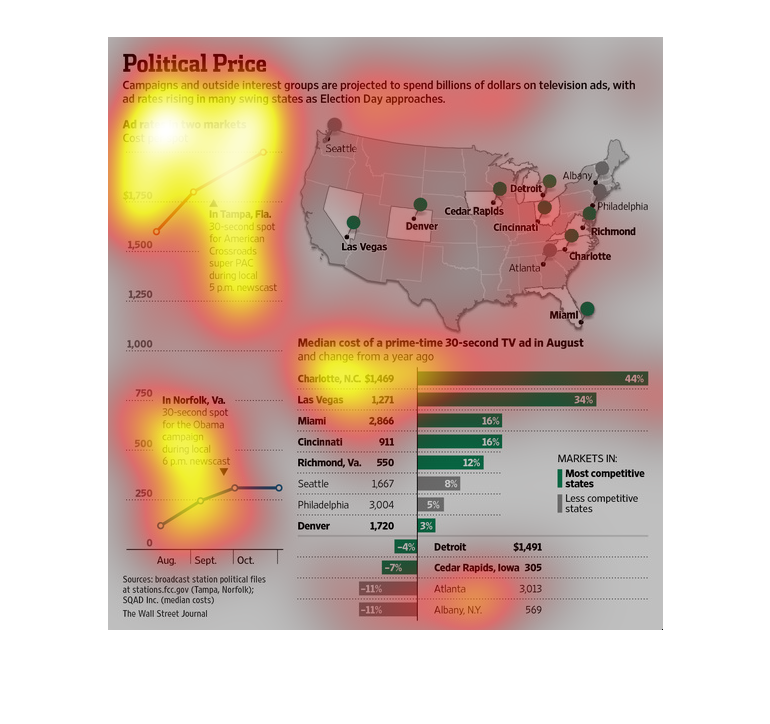
This says that campaigns and other political interest groups are projected to spend billions
of dollars on television ads, with ad prices rising in swing states.
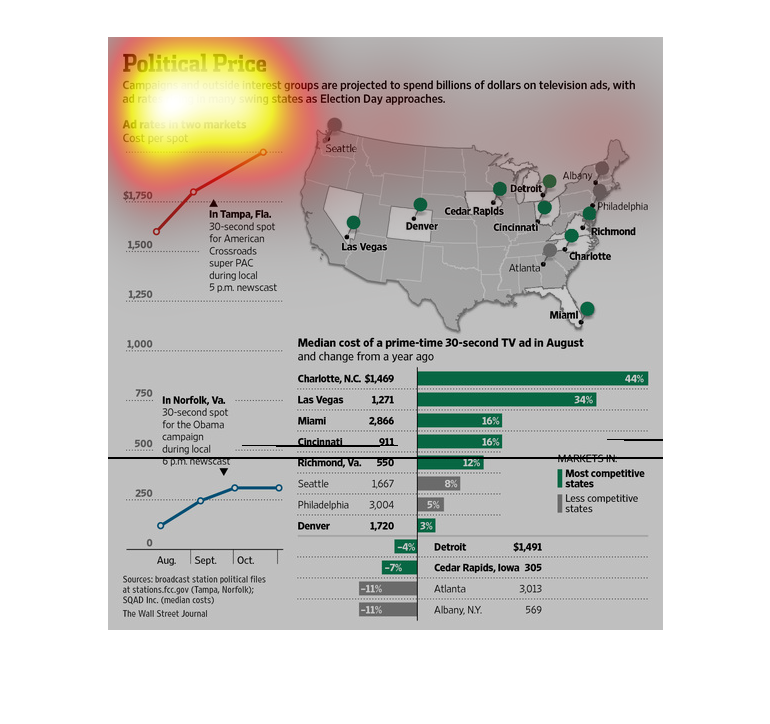
it is passage about political prices and how much they spend on the ad to promote there campaign.it
is passage about political prices and how much they spend on the ad to promote there campaign.
This is a chart showing the amount of money spent in politics. There are charts showing how
much money was spent on ad's in politics in different times.
This shows how the price of a 30-second political campaign ad has risen from a year ago. Campaigns
and outside interest groups are spending more on prime-time ads.
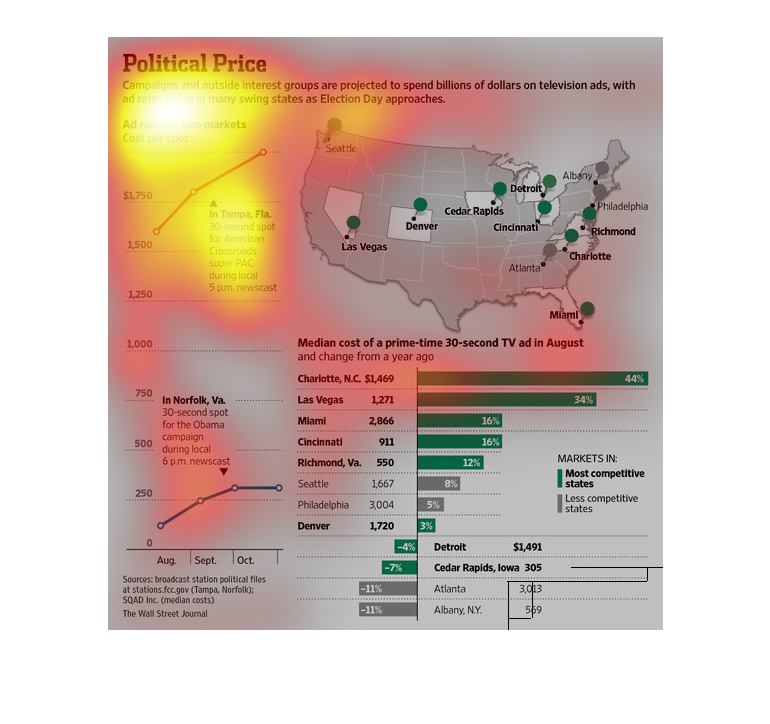
The image depicts how campaigns and outside interest groups are planning to spend billions
of dollars on television advertising in battle ground states, with ad rates rising in battleground
states.