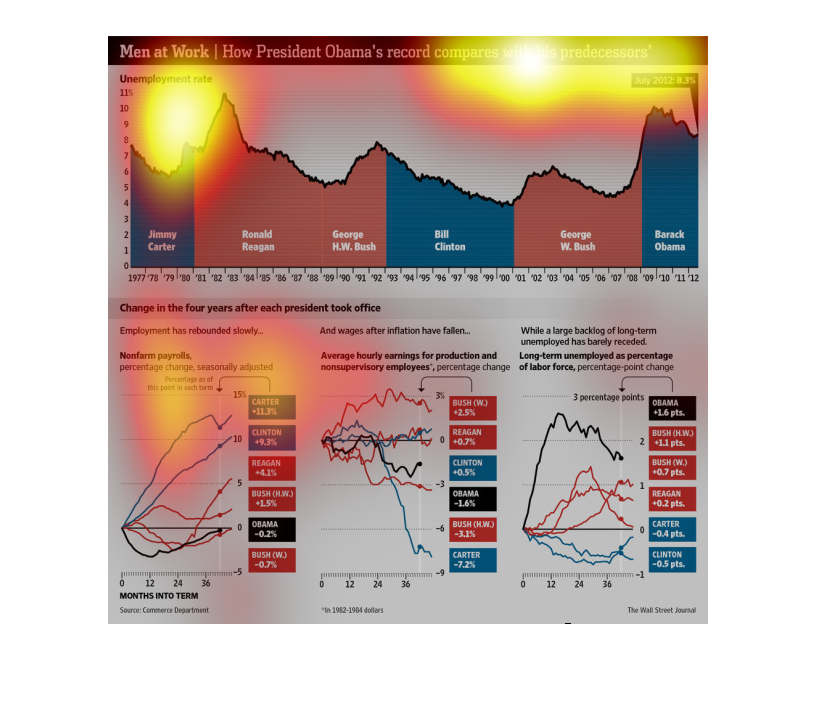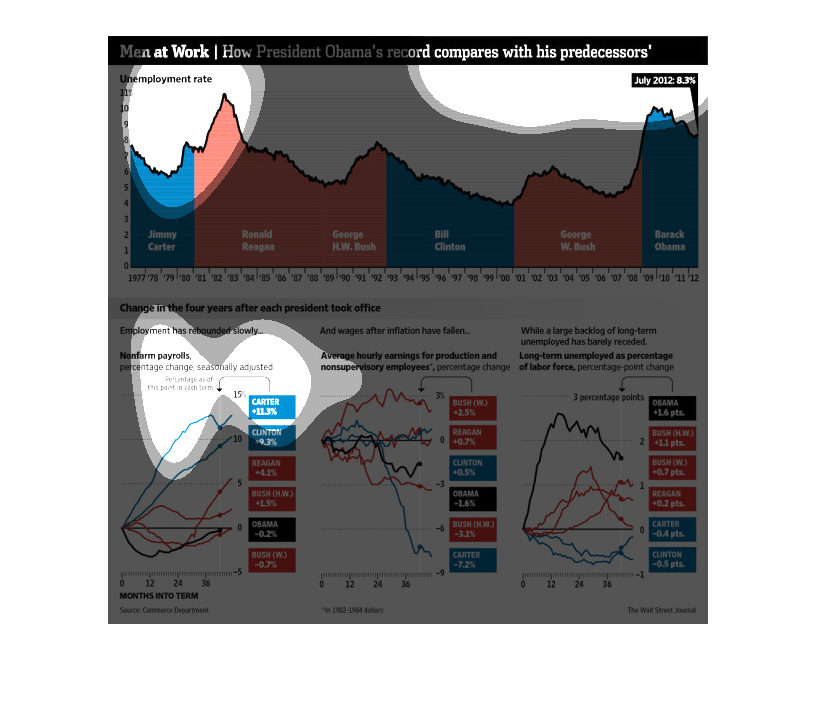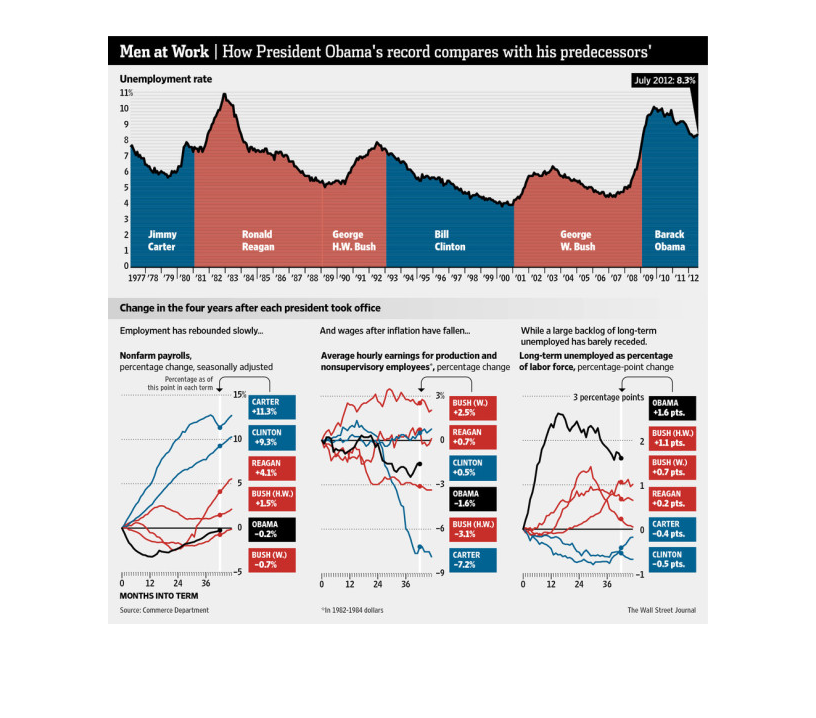
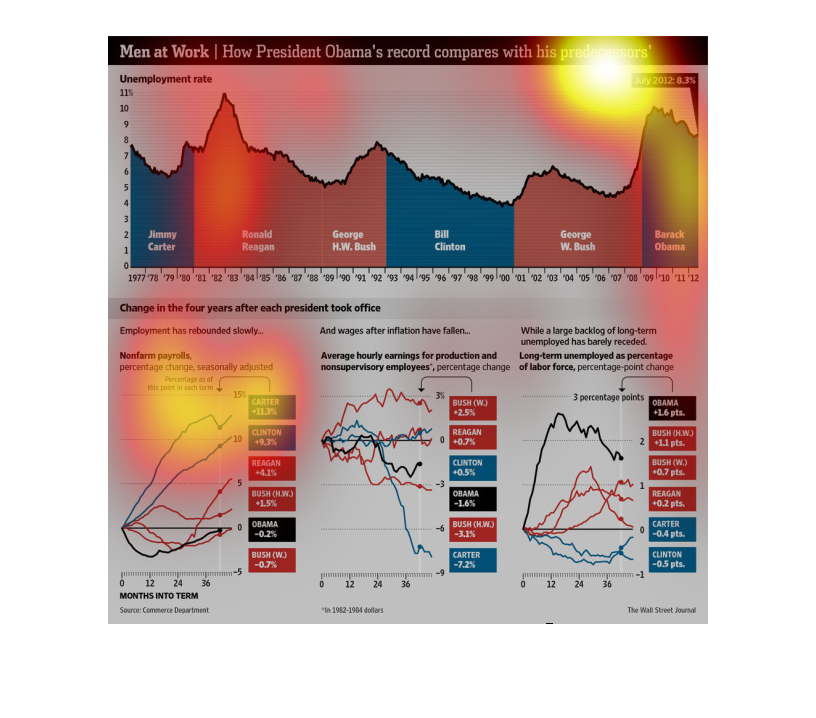
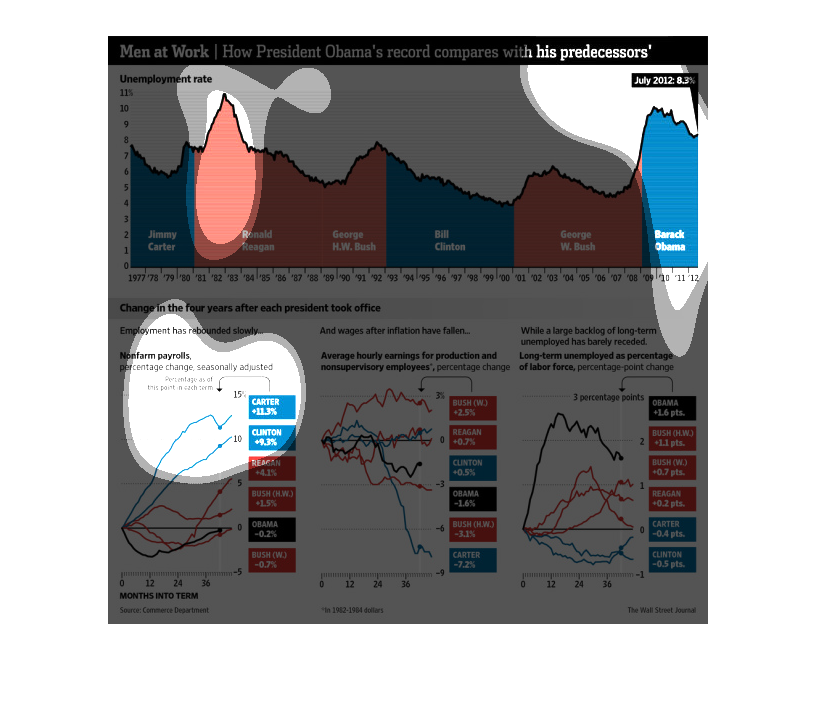
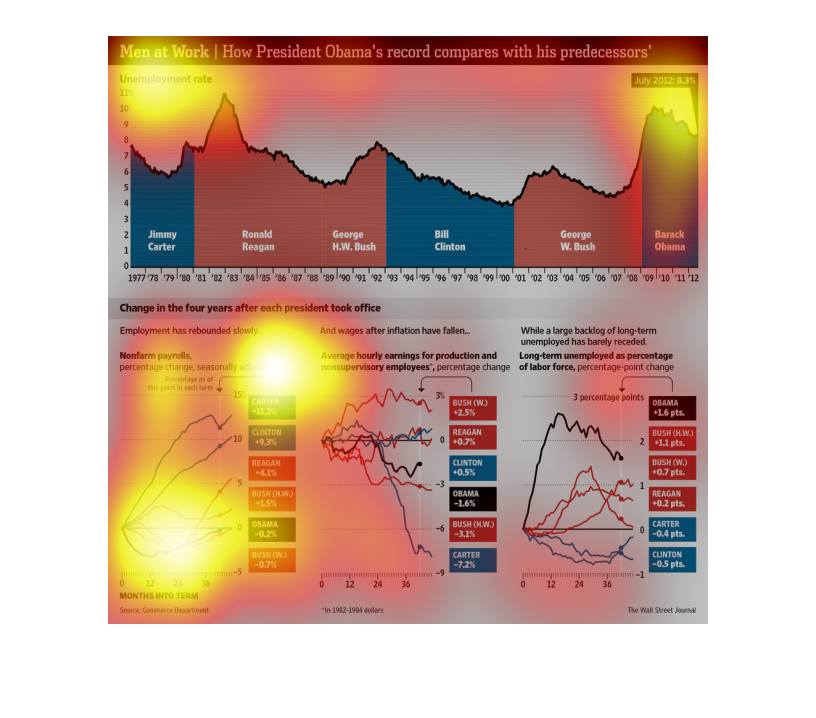
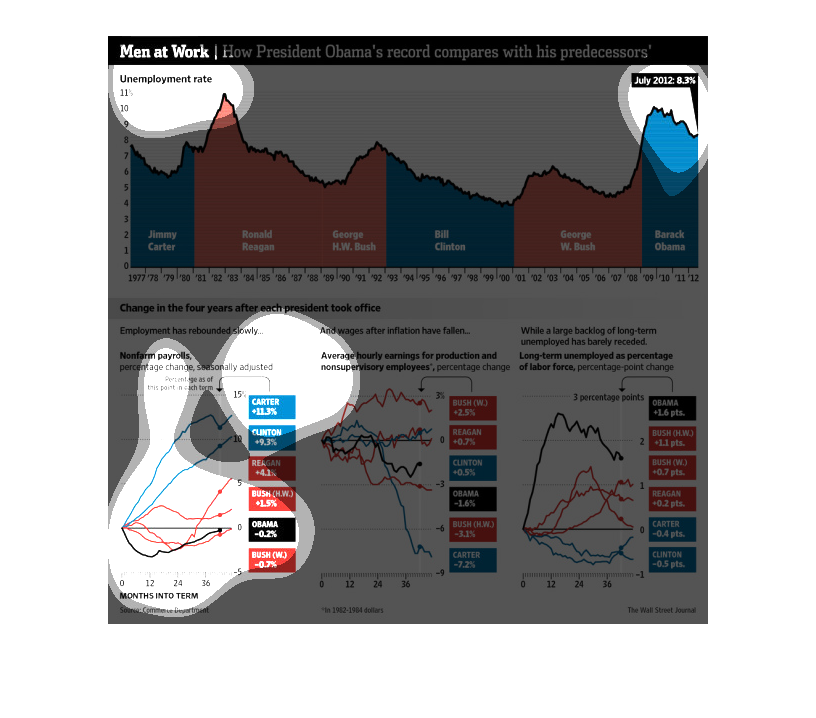
This chart describes men at work. Specifically, how president Obama's record compares with
his predecessors'. Different categories on the chart are represented by different colors.
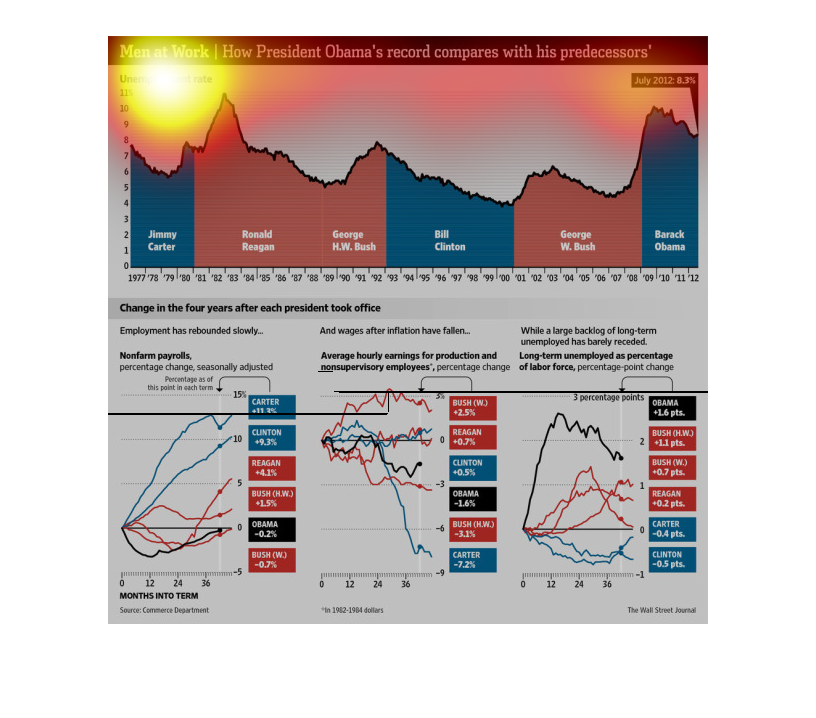

The image depicts how president Obama's record compares with his predecessors. In terms of
unemployment, Ronald Reagan did a far worse job within the context of job security for America,
with democrats reducing unemployment while republicans increase it over the decades. Overall,
Obama stacks up pretty well against both past republicans and democrats, even within the context
of the worst economic crisis since the Great Depression.
This is a graph of how President Obama's record compares to that of his predecessors. The
data shows that the unemployment rate under Obama is the highest since Ronald Reagan.
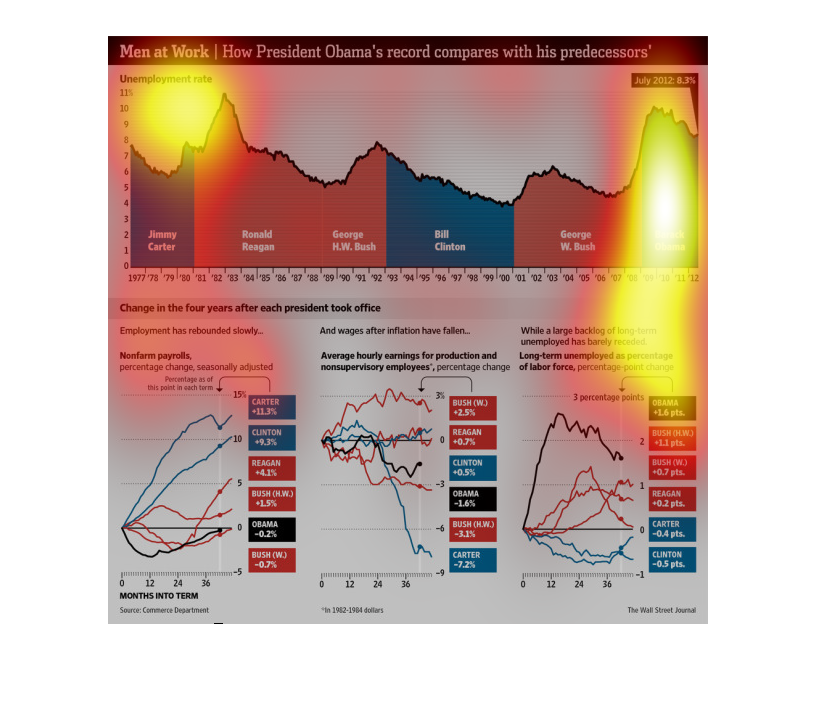
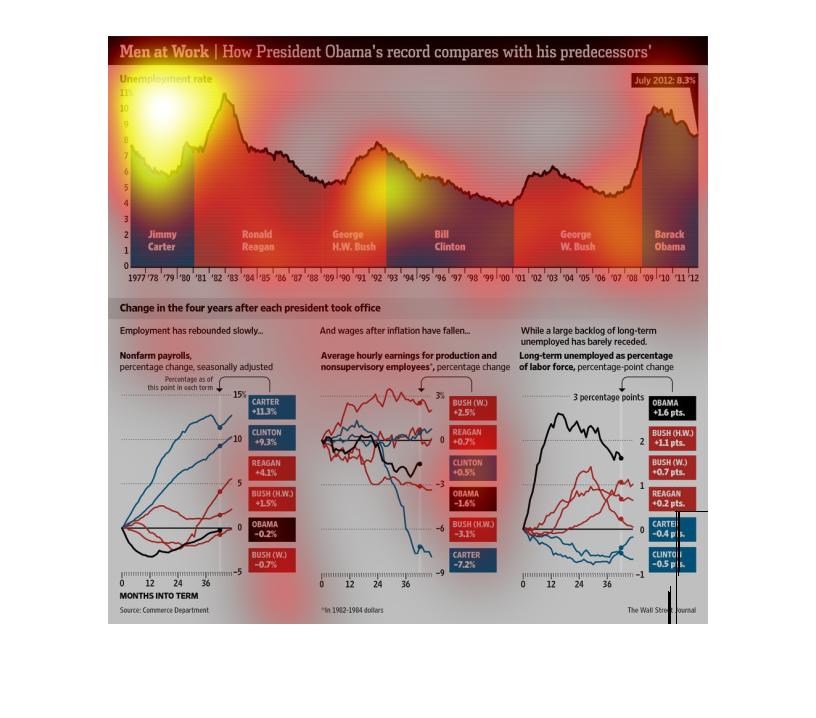
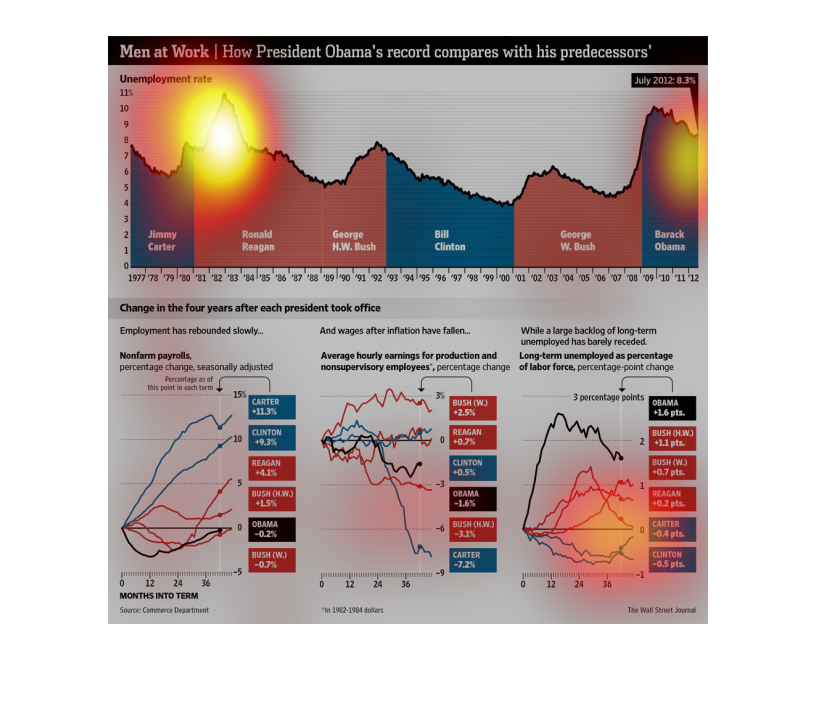
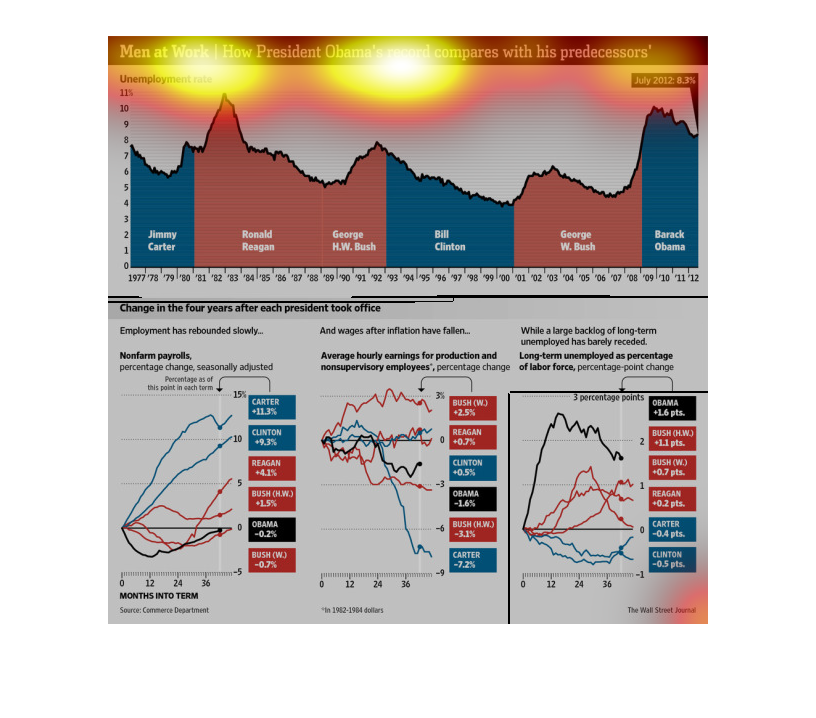
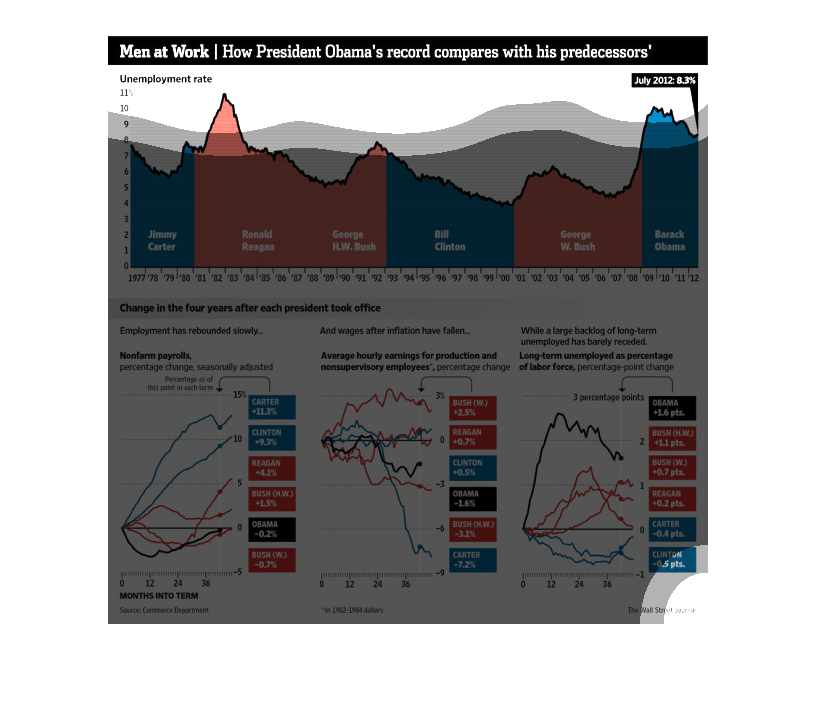
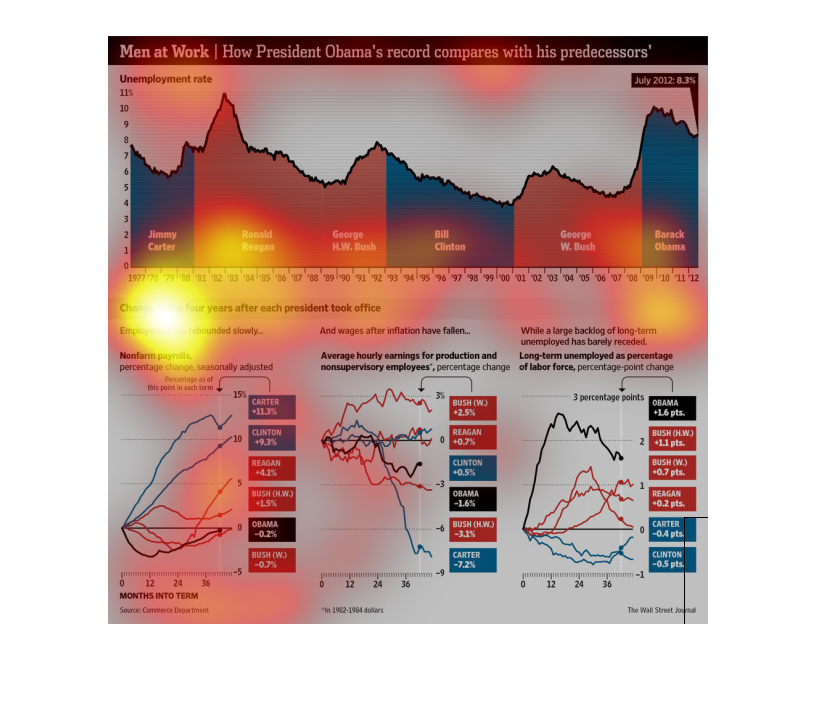
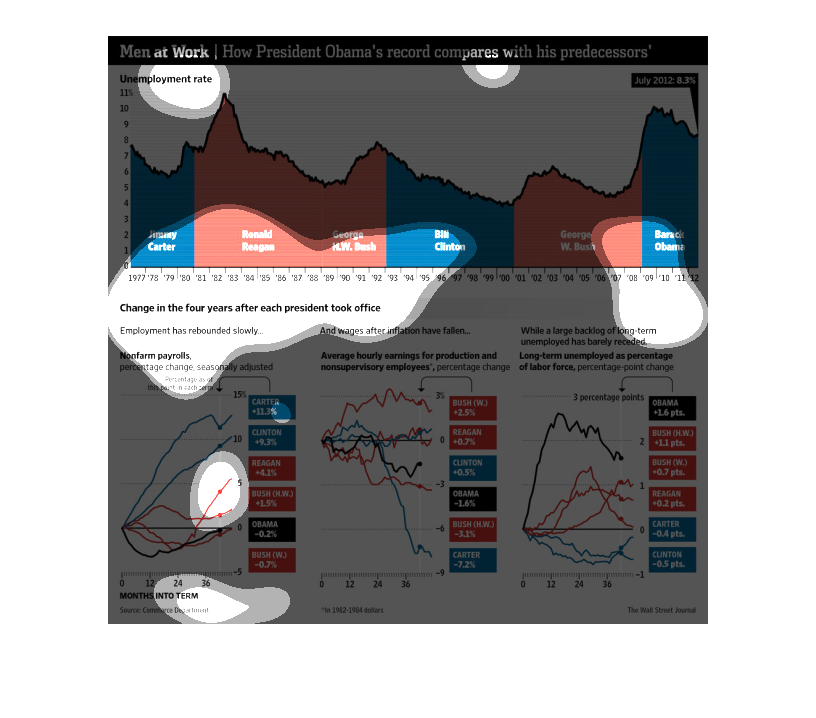
The top chart strives to compare the unemployment rate from Barack Obama's presidency against
his predecessors. The presidents are aligned along the X axis by year, labeled by color according
to their party affiliation, with the unemployment rate on the Y axis. The top chart shows
that the unemployment rate spiked during Obama's presidency (following the end of Bush's term)
with percentage comparable to Reagan's presidency. However, the rate of unemployment shows
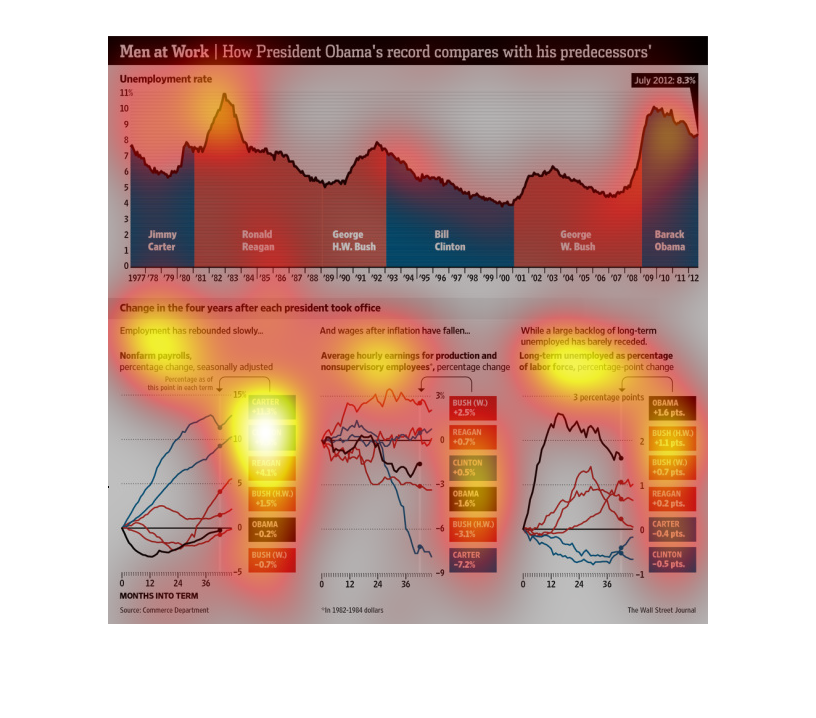
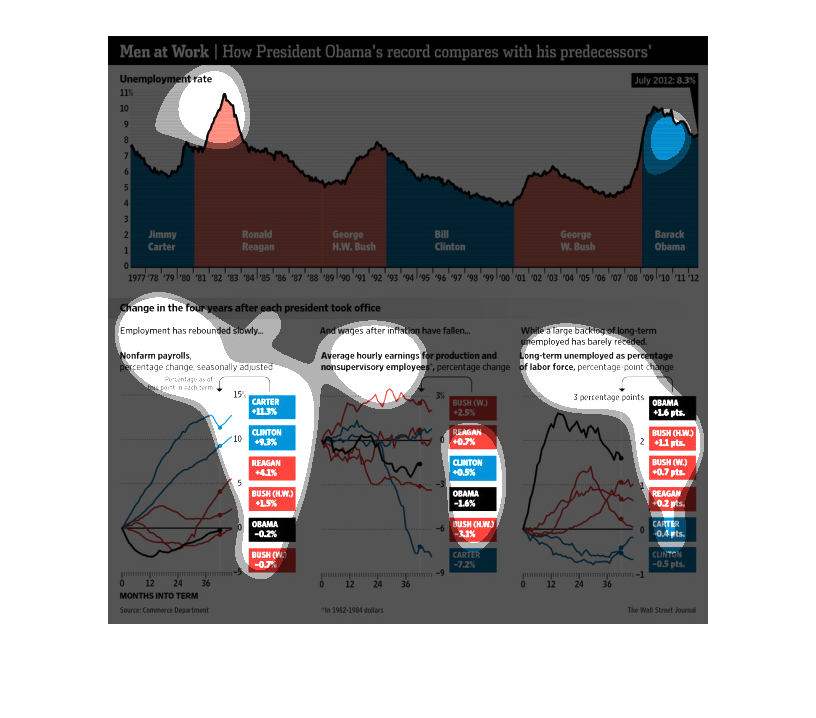
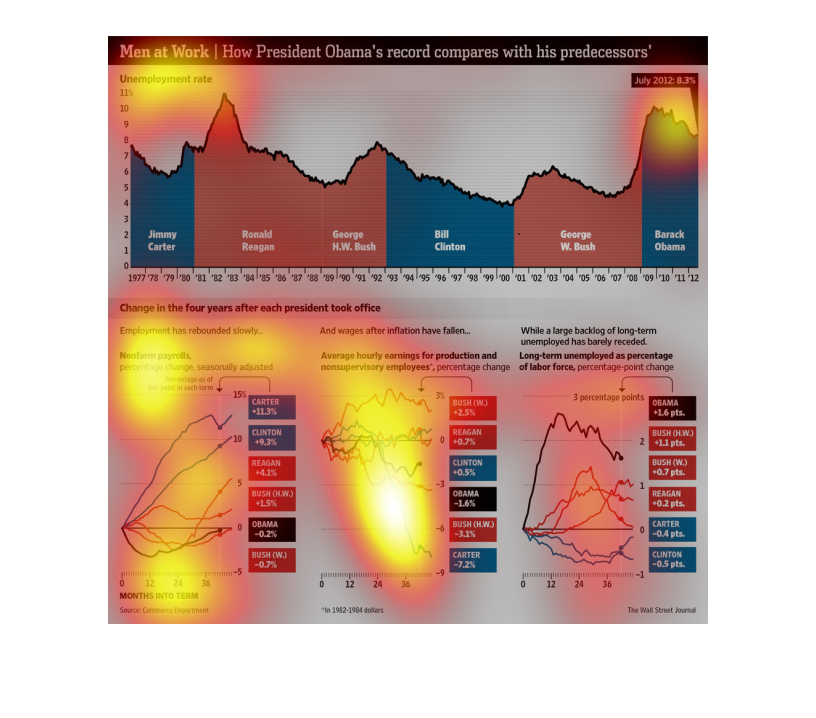
to be declining, similar to his predecessors. The bottom three charts compare Non-Farm Payrolls,
Average Hourly Earnings, and Long-Term Unemployment in each president's first three years.
The first chart (Non-Farm Payroll) shows a steady increase for democrats, and an initial decline
and rise for Obama and Republicans. The second chart, (Average Hourly Earning) has each president
all over the board. The last graph (Long-Term Unemployment) shows a dip for democrats, and
a rise for Republicans and Obama.
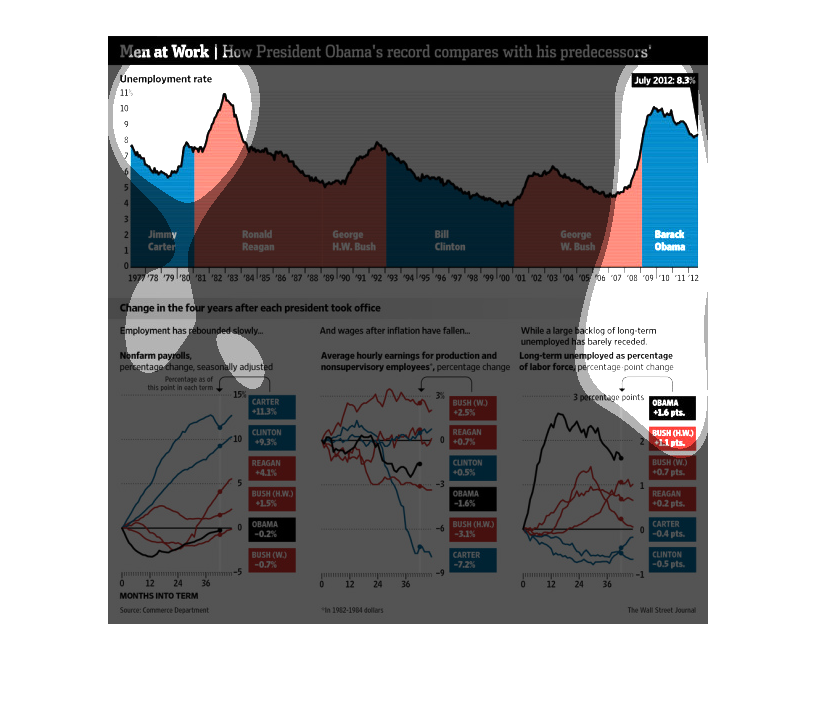
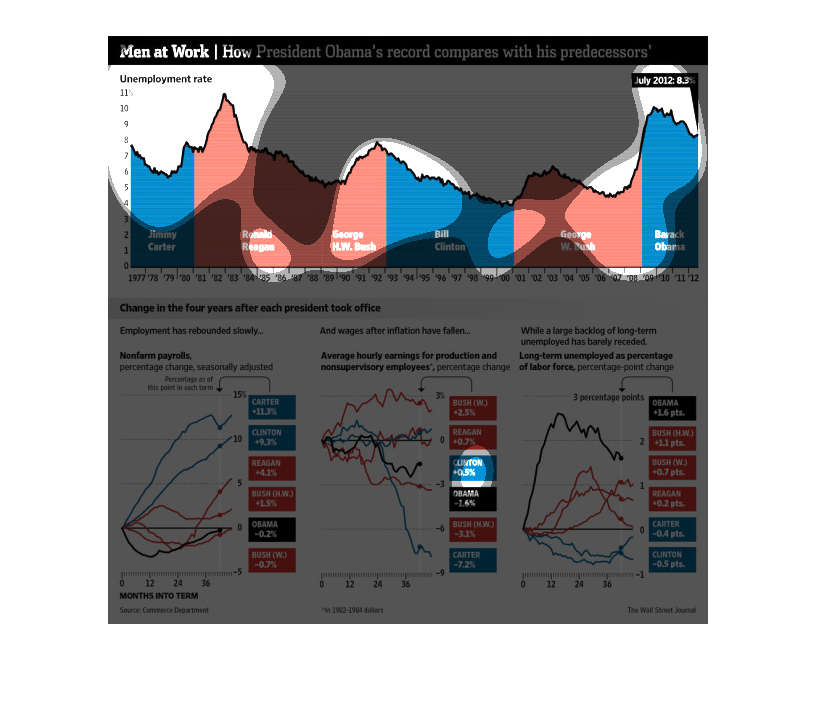
THE following chart shows the unemployment rate for different presidents during their time
in office. It shows that most presidents has a decrease in their unemployment rates further
into their presidency.
The image depicts a comparison of the unemployment rate under Barack Obama compared to past
presidents. The unemployment rate under Obama has been heavily affected by the near-collapse
of the US economy, but still lower than under Reagan in it's worst year.
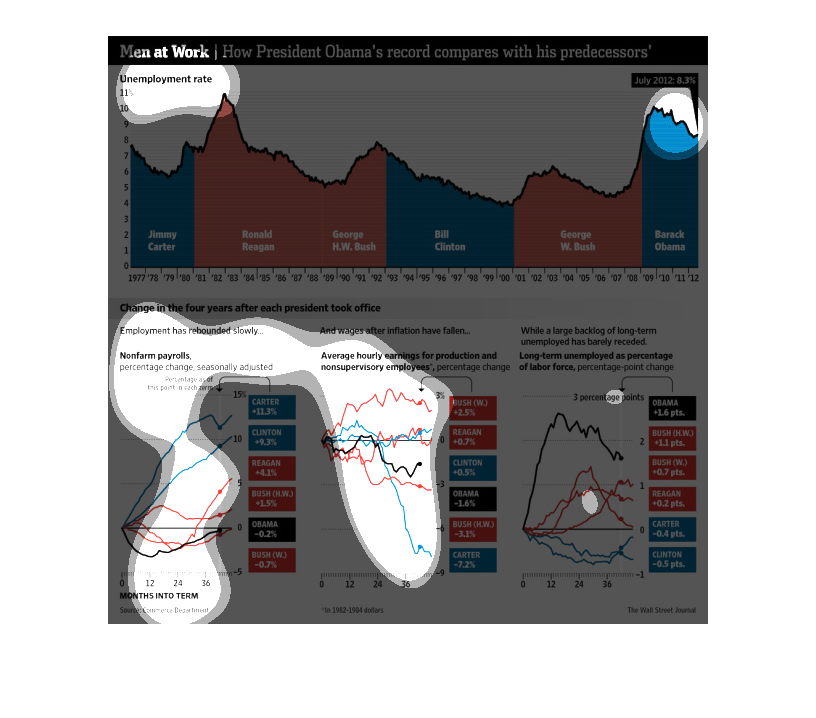
This is a chart showing how Obama compares to past presidents. Being compared to Ronald Reagan,
George Bush, Bill Clinton and others. Wages after inflation have fallen but employment has
slowly risen under Obama.
Men at work, how president obama's record compares with his predecessor's, reagan saw a rise
shortly after carter was out of office, but obamas spike lasted longer, years 1977-2012.
The image is titled "Men at work: How president Obama's record compares with his predecessors'"
It has two graphs on it; Unemployment Rate and Change in the four years after each president
took office.
This chart describes men at work. Specifically, how President Obama's record compares with
his predecessors'. Different categories are represented by different colors.
The top graph shows how President Obama compares to previous presidents in terms of gains
in employment. The graph is organized horizontally. The bottom half of the image puts the
information into more detail, with both line and bar graphs organized vertically.
This chart/graph shows how Obama is doing in comparison to the former presidents before his
rule. It shows the unemployment rate of Jimmy Carter, Ronald Reagan, Bill Clinton, George
W. Bush, and Barack Obama. It is also colored red or blue by what party the president is with.
All time high employment with Obama.