This was a very interesting chart to view. It shows The graying of science. What that means
is that over the past century Nobel prizes have been awarded to many people in their later
stages in life.
This chart describes the graying of science. Specifically, over the past century, Nobel prizes
have been awarded for work done later in life. The chart is divided into two categories.
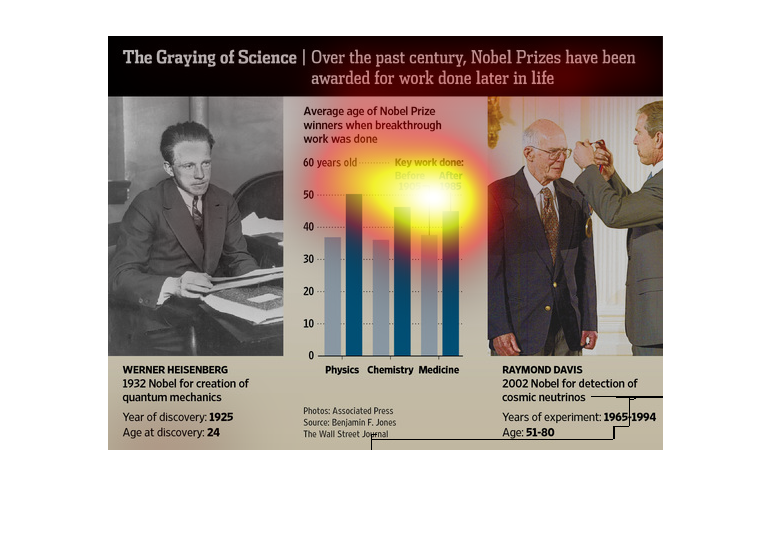
Heisenberg, Neutrinos; this illustration tries to showcase that it is never too late to reach
a milestone in ones life. Life isn't over till its over. Here, we see many individuals received
their noble peace prices well into their later years.
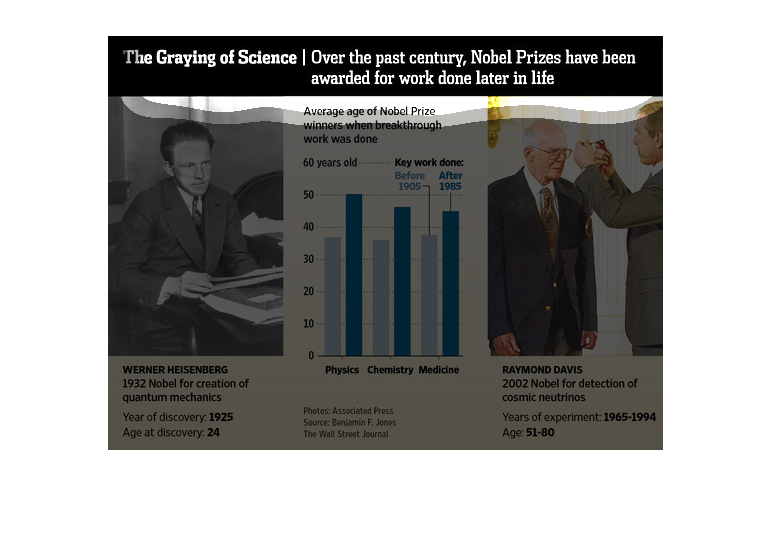
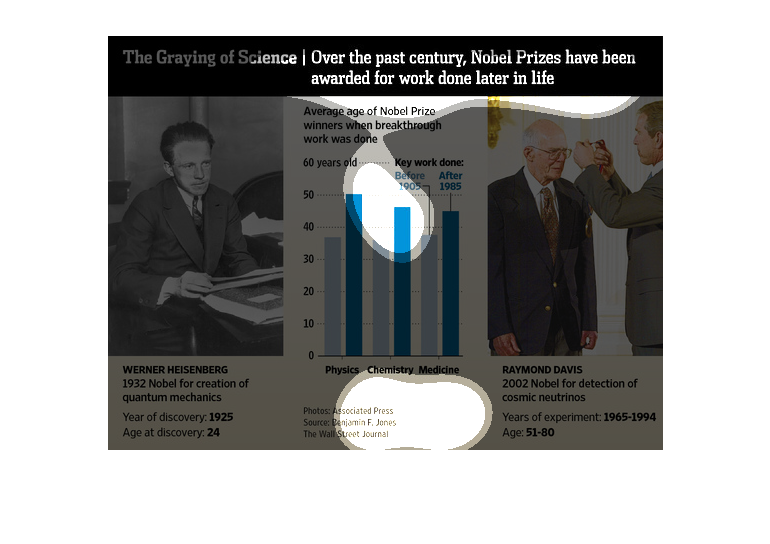
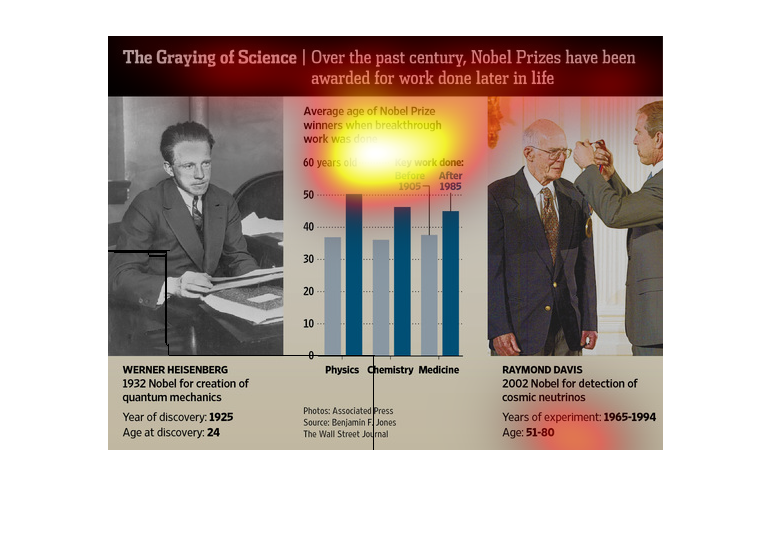
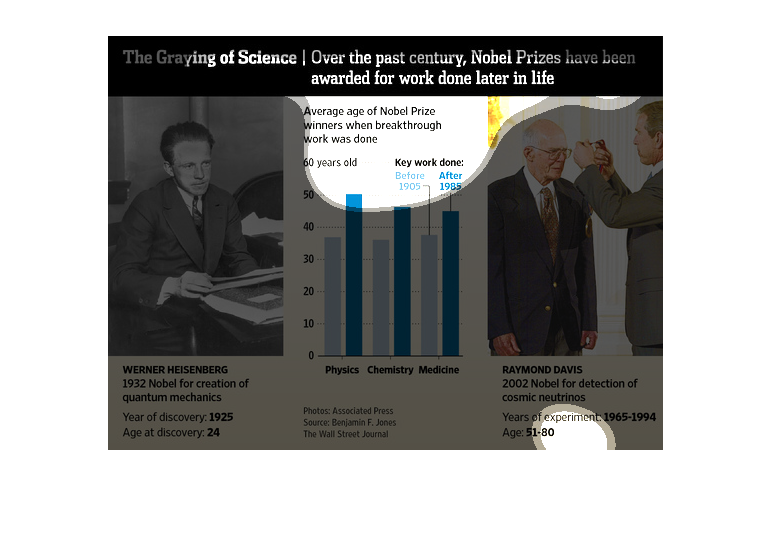
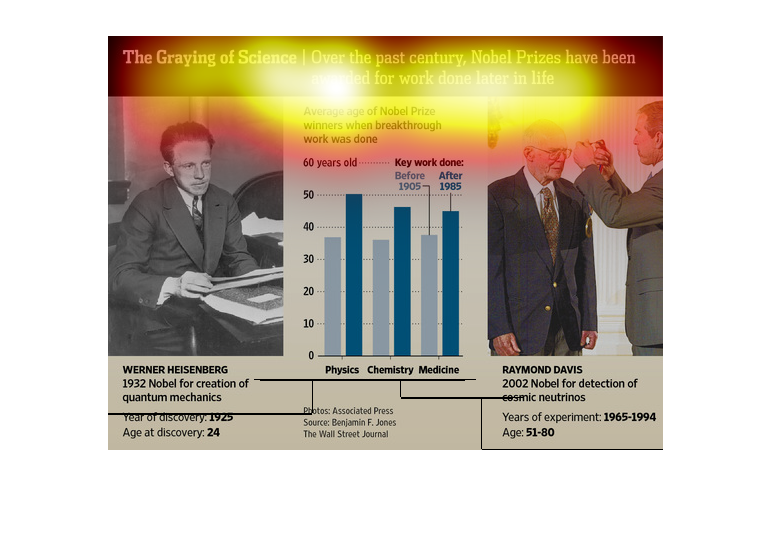
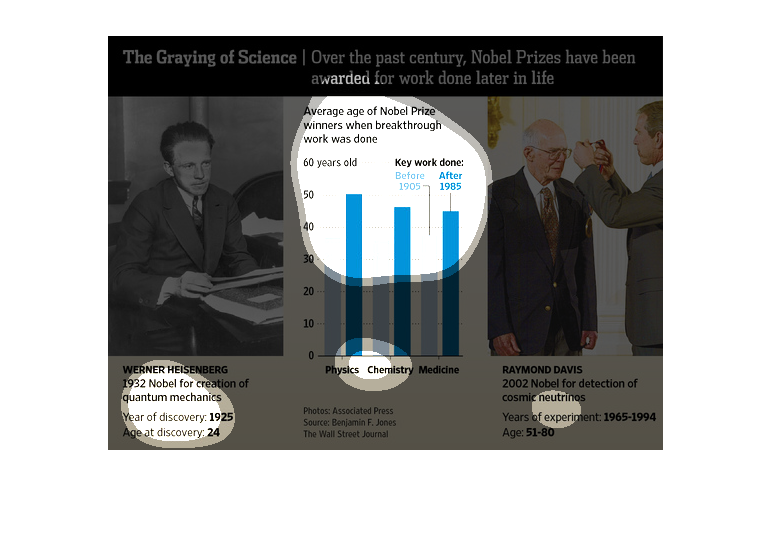
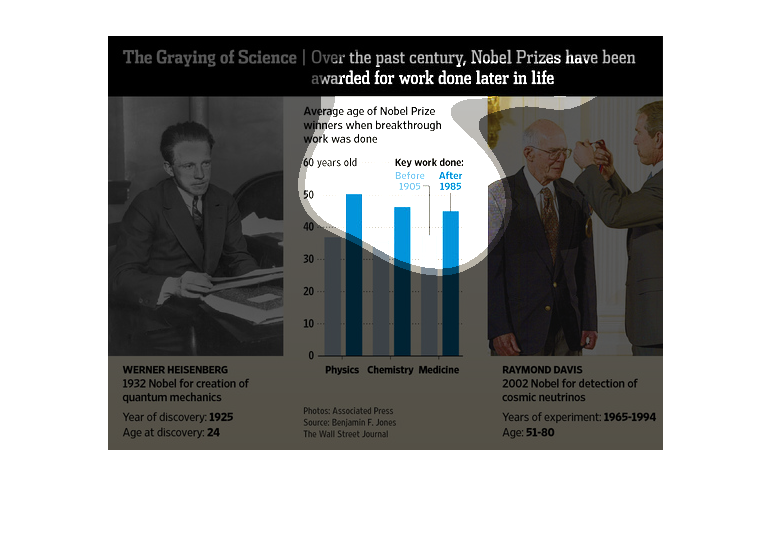
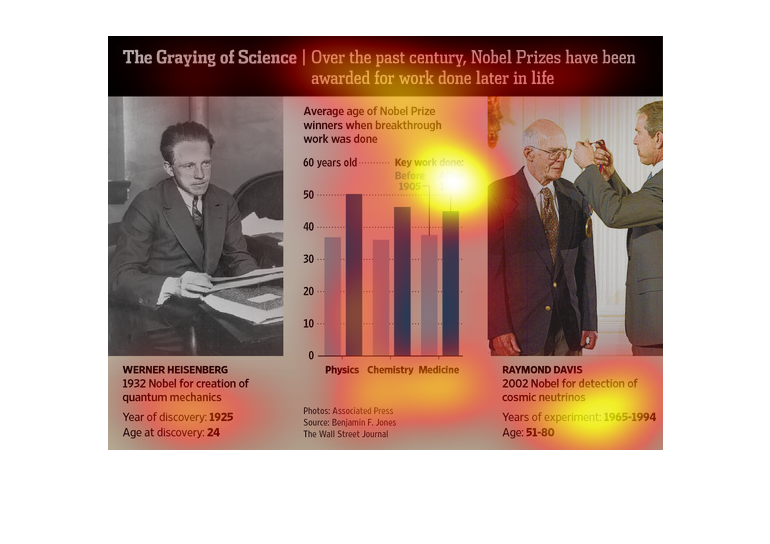
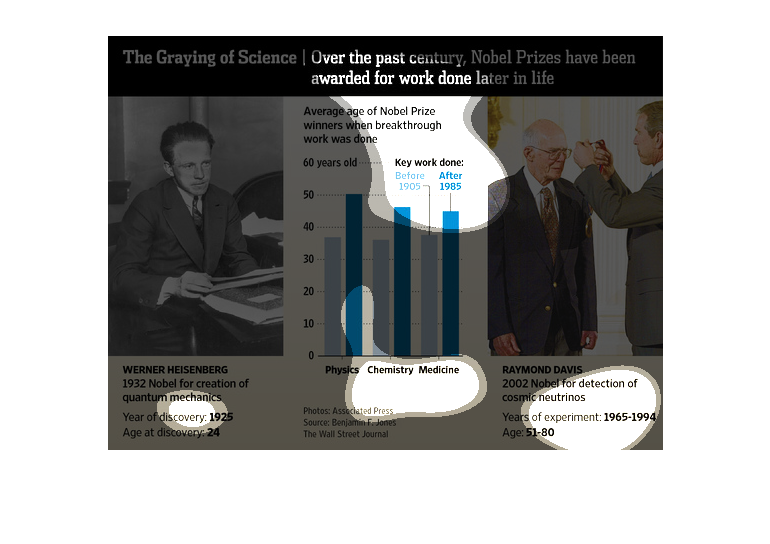
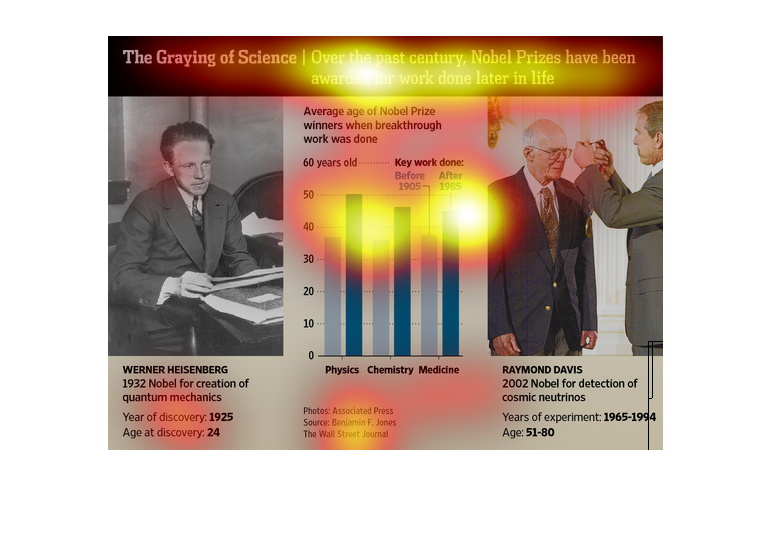
This chart shows the average age of Nobel prize winners when their breakthrough work was done
in the areas of Physics, Chemistry and Medicine highlighting later years of excellence.
This chart clearly displays the age groups that have received the Nobel piece prize at some
point and time in their life. The chart is divided into the categories Physics, Chemistry,
and Medicine.
This chart describes the graying of science. Specifically, over the past century, Nobel prizes
have been awarded for work done later in life. Including foe Raymond Davis.
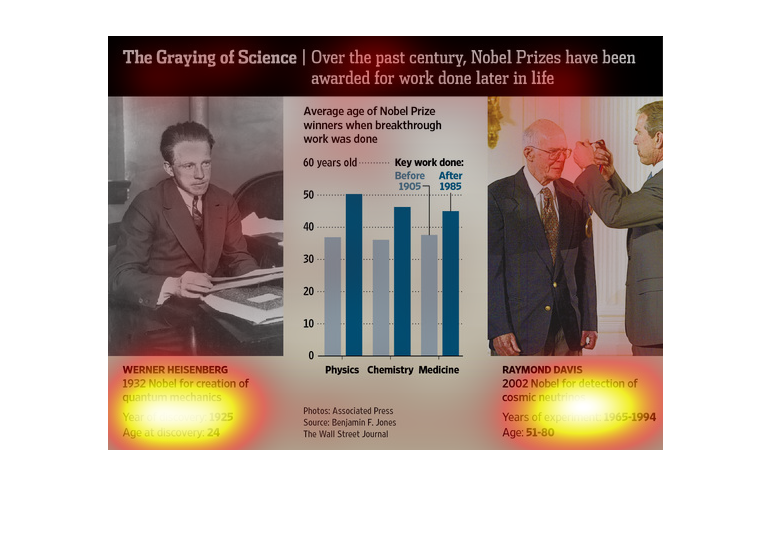
The following chart is labeled the graying of science. It shows that the age of Nobel Prize
winners has been gradually getting older and older and that they are saving their best work
for later in life.
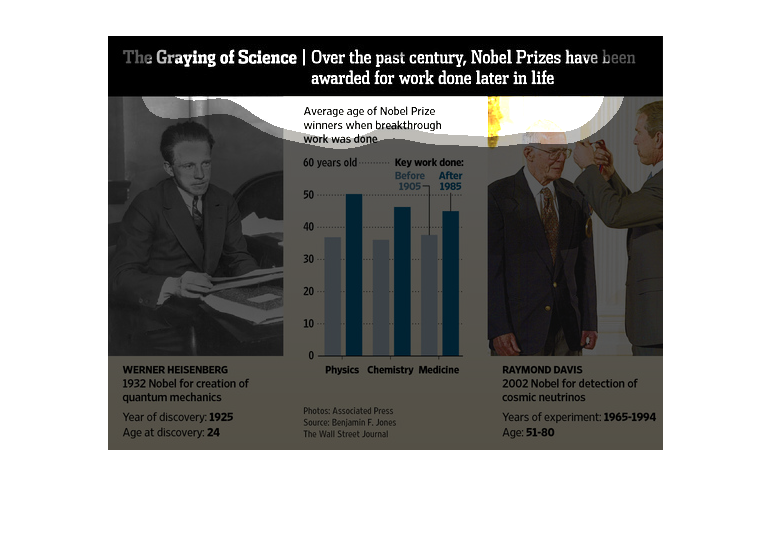
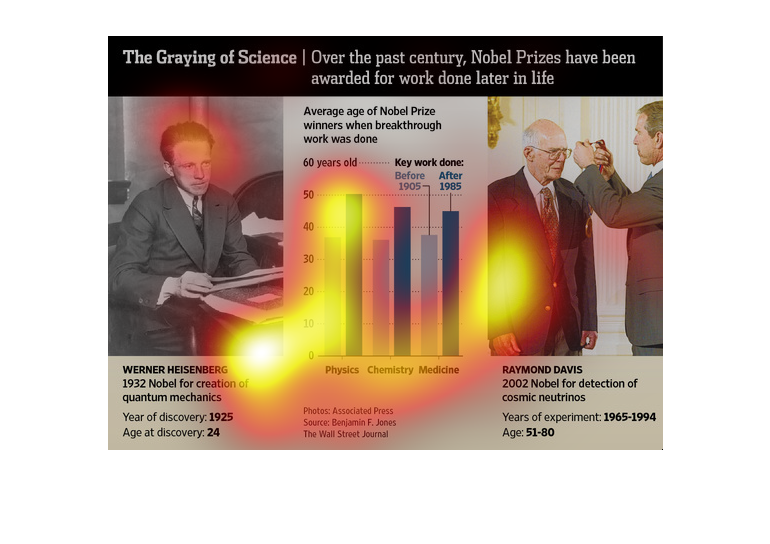
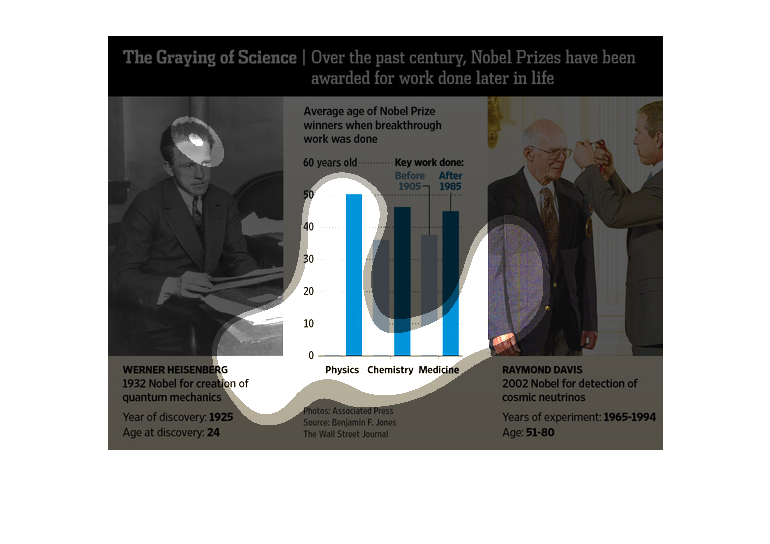
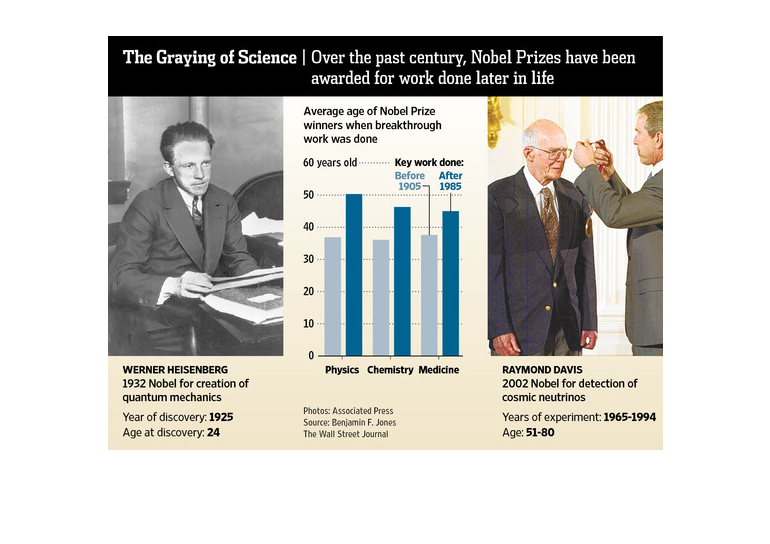
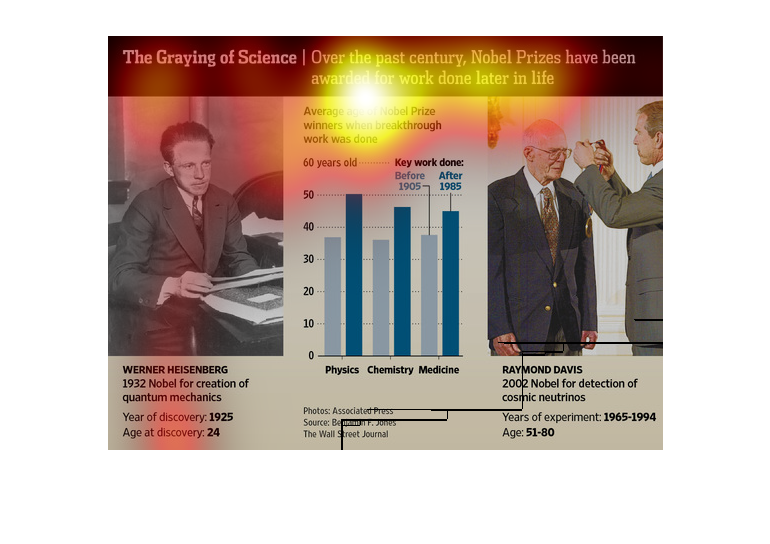
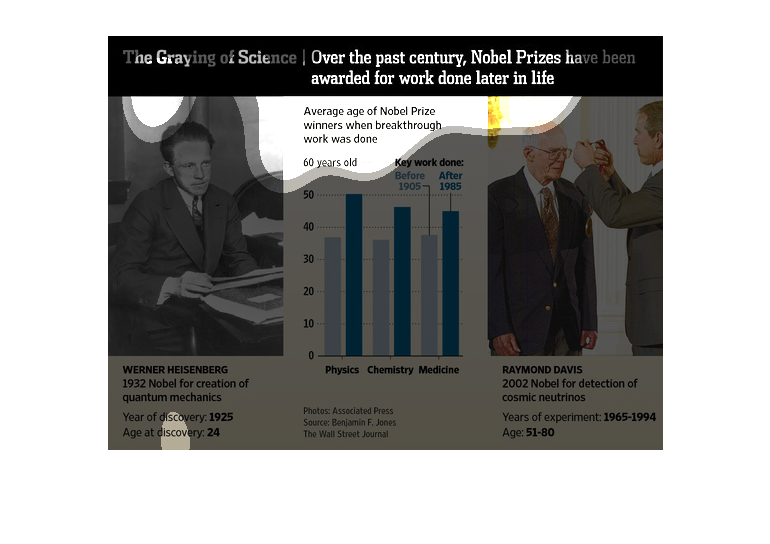
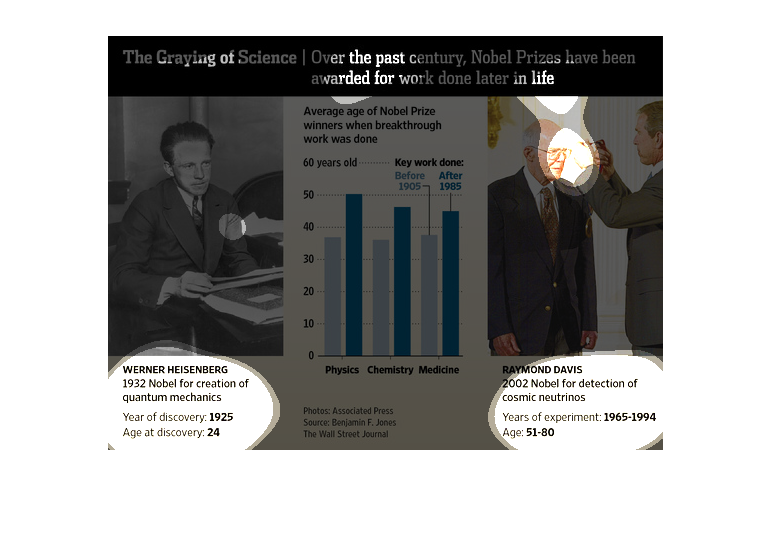
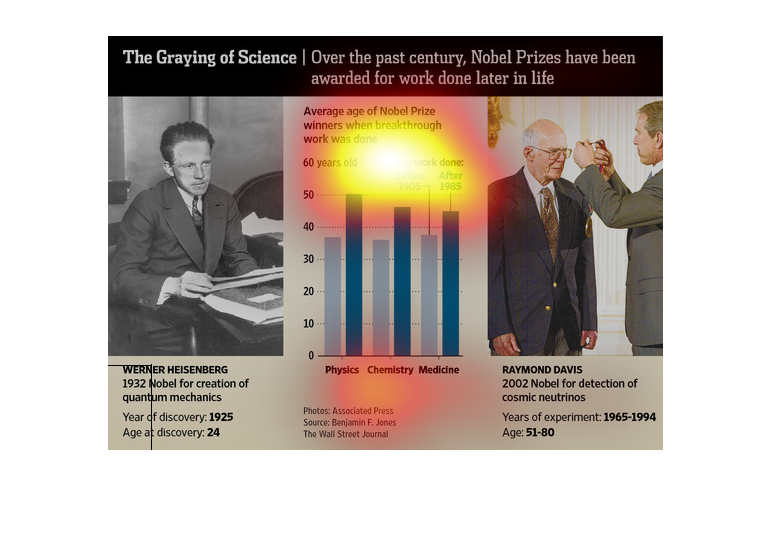
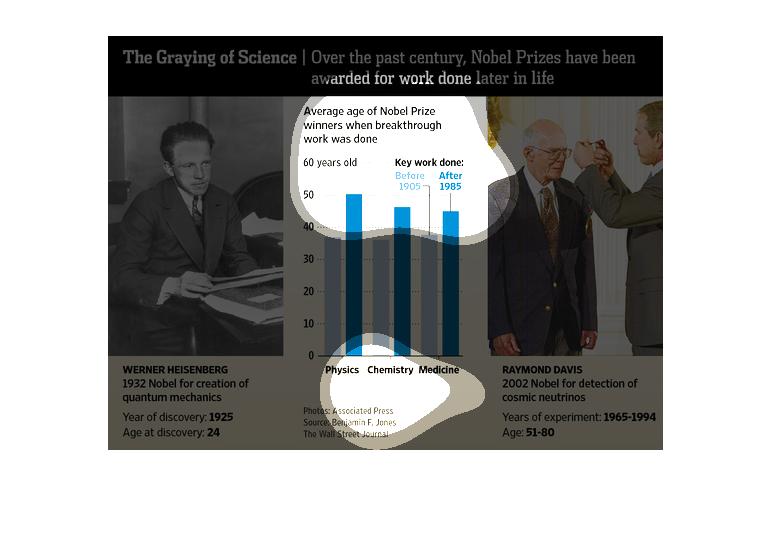
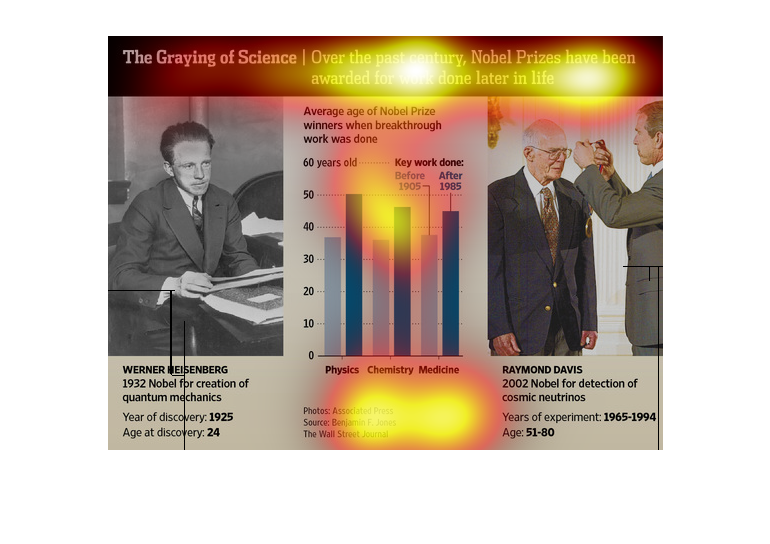
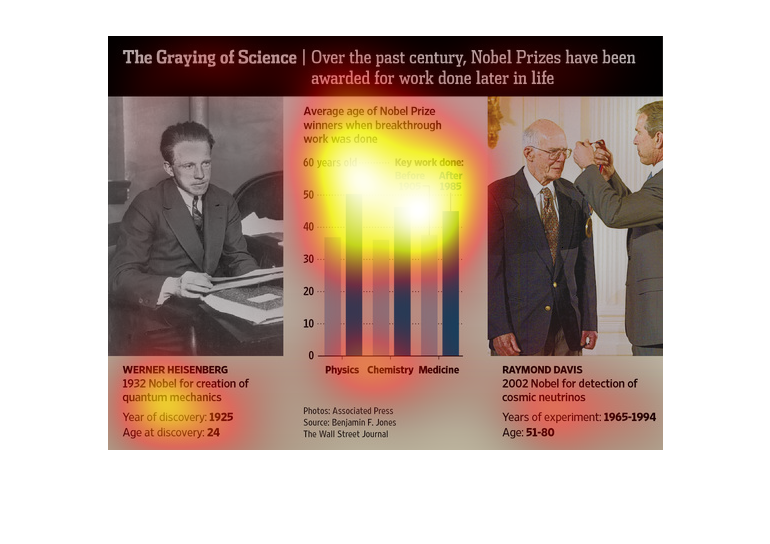
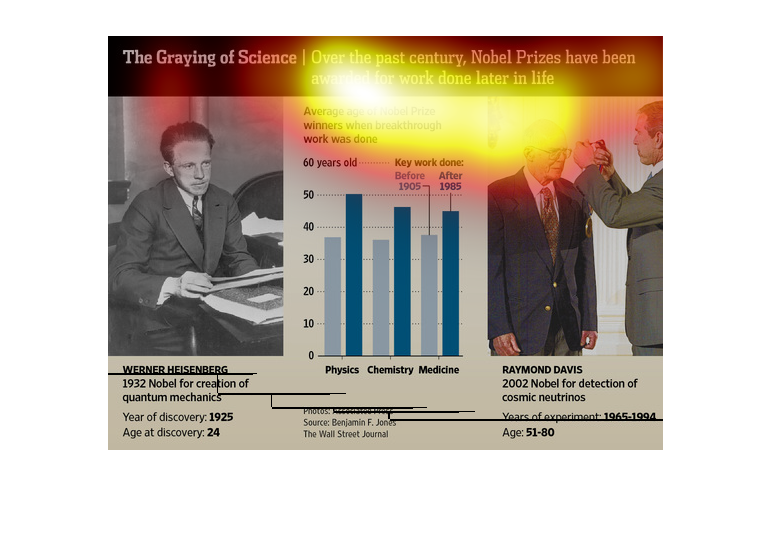
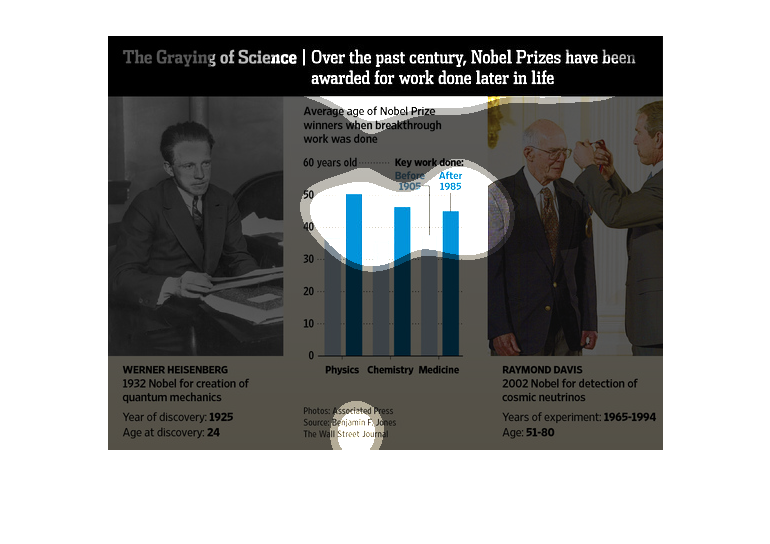
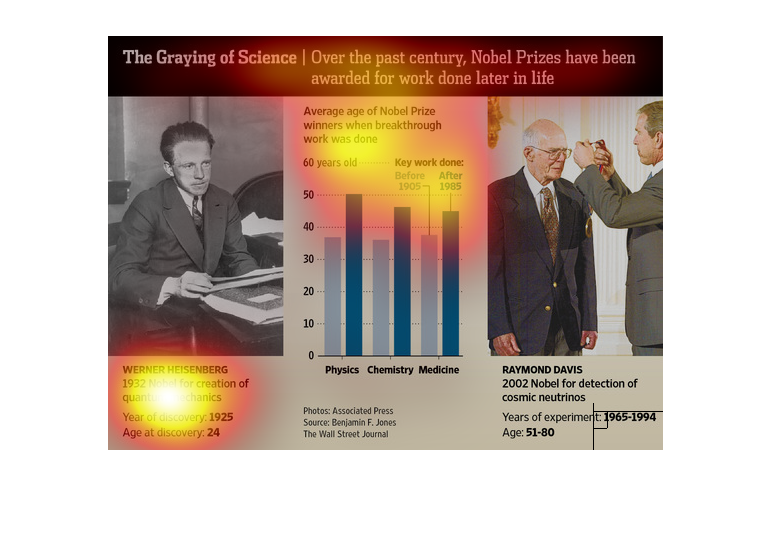
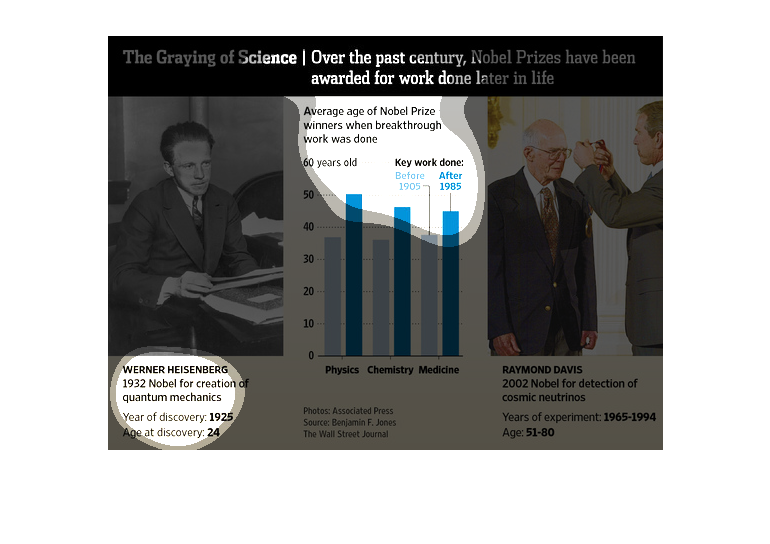
The graying of science over the past century, nobel prizes have been awarded for work done
later in life. A graph is shown, the Y axis is age, there are three categories for physics,
chemistry and medicine. Major accomplishments are increasingly happening later in life.
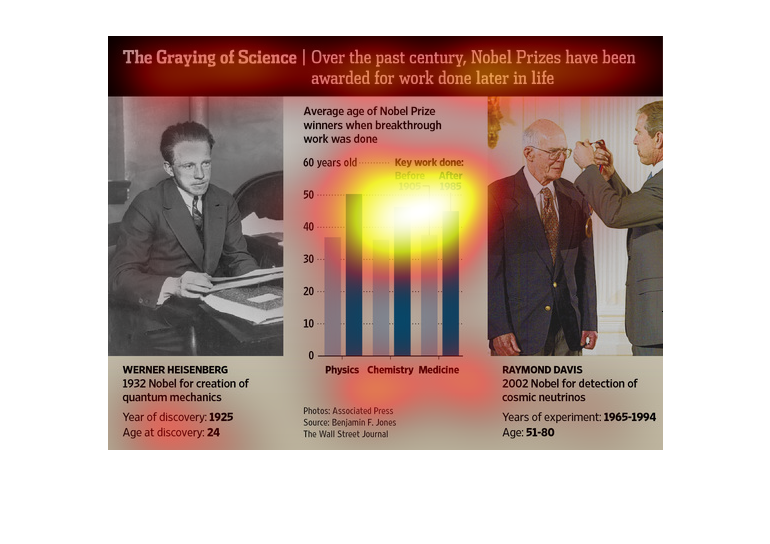
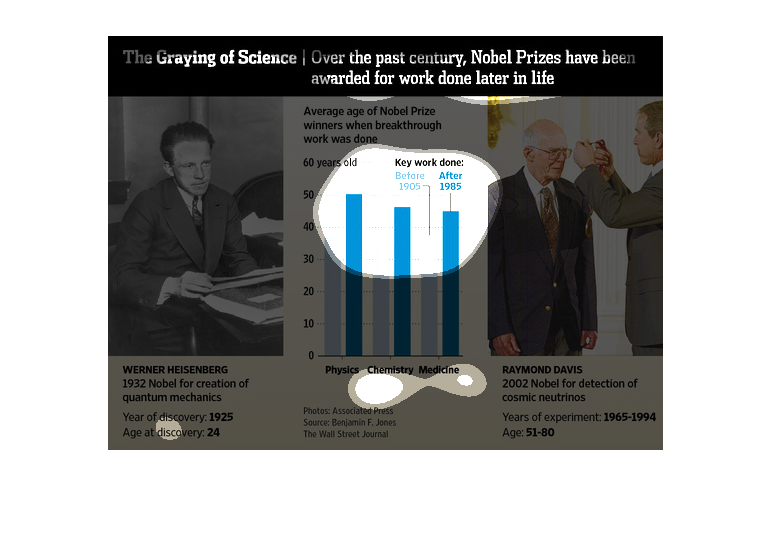
The chart shows the average age of Nobel Prize winners before 1905 and after 1985. In physics
the average age has risen from about 37 to 50. In Chemistry and Medicine the average age has
risen from around 37 to about 45. The graphic also shows two examples of Nobel Prize winners
from these times and their ages (24 vs. 51-80)
This is a series of diagrams and color coded bar graphs depicting that over the past century
Nobel Prizes have been awarded for work being done later in life.
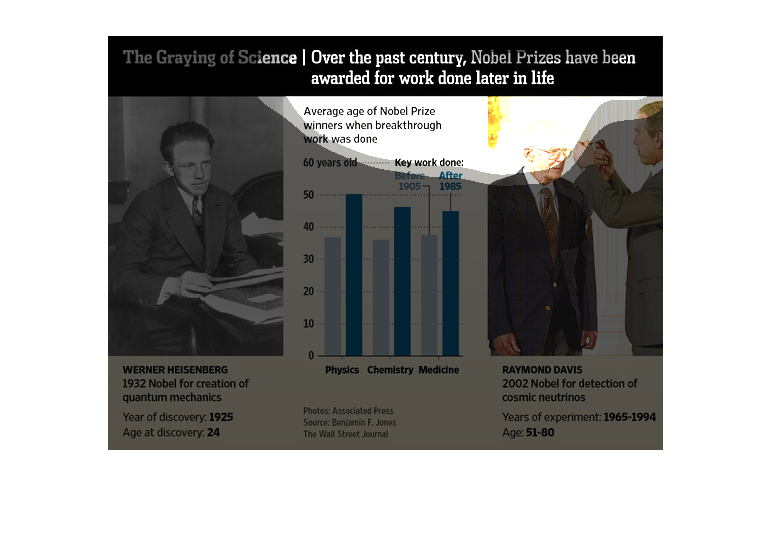
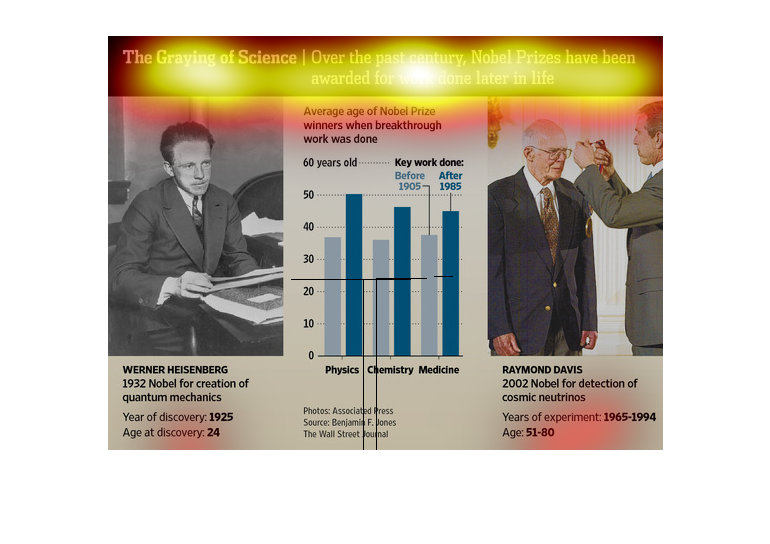
The image depicts how in science, nobel prices have been awarded for work done later in life
rather than earlier in life. The data indicates that around age 60 is when the key work is
done.
This graph represents the number of Nobel Prize winners in the areas of Physics, Chemistry
and Medicine have been awarded to people over the age of 65 before 1905 and after 1985.
This is a series of graphs and statistics depicting how over the past century, Nobel Prizes
have been awarded for work done later in life. It shows an average age trending towards 50.
This chart shows the Nobel Peace Prizes awarded during the last century have been granted
for work done later in life.  The average age of Nobel Peace Prize recipients before 1905
was approximately 34 years while the average age of Nobel Peace Prize recipients after 1985
was 40550 years.
Often you try and you try in your youth and things don't work out like you'd hoped; that is
life. In this illustration we see that over the years a new trend has developed where a lot
of people in their third age are getting awarded the nobel peace prize.