The image is titles feeling the pain. It list many graphics and graphs that explain the trouble
in investing and hedge funds. It list the percentages and problems that people are seeing
in the hedge funds and investing.
This is a series of color coded charts and graphs depicting the holdings and health of the
hedge fund market and the various positions that they currently hold.
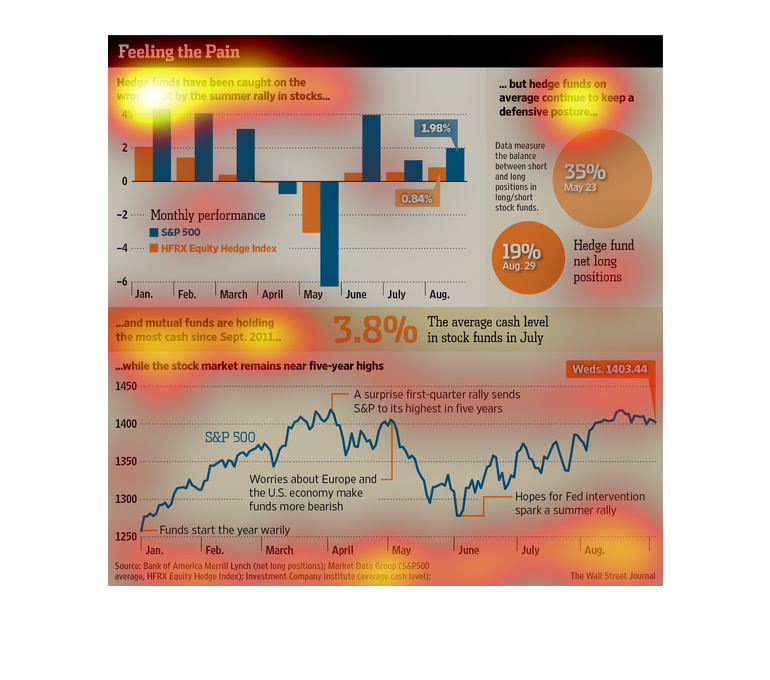
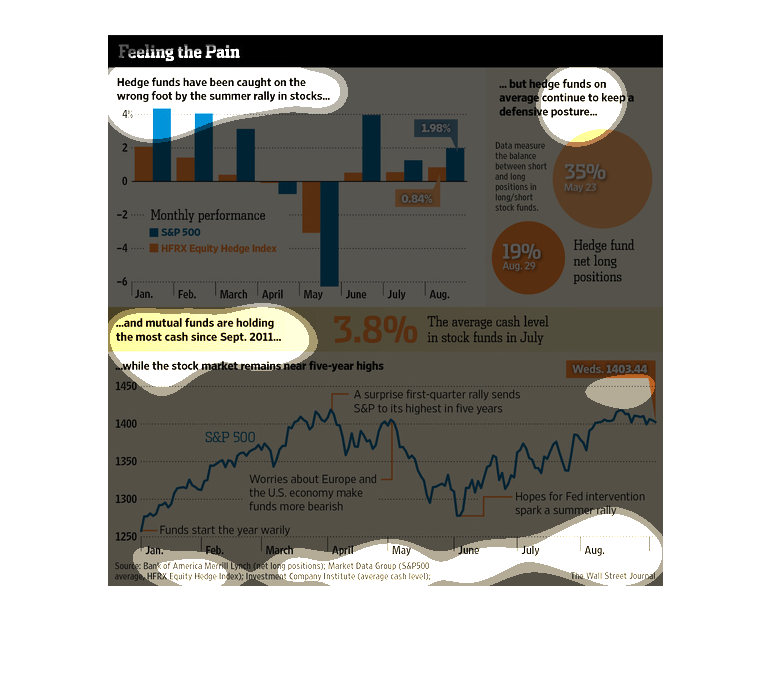
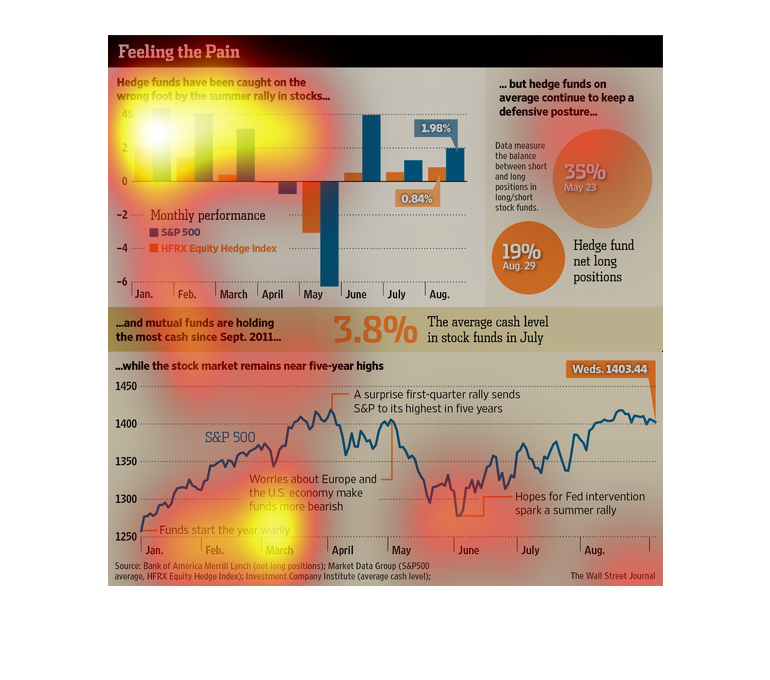
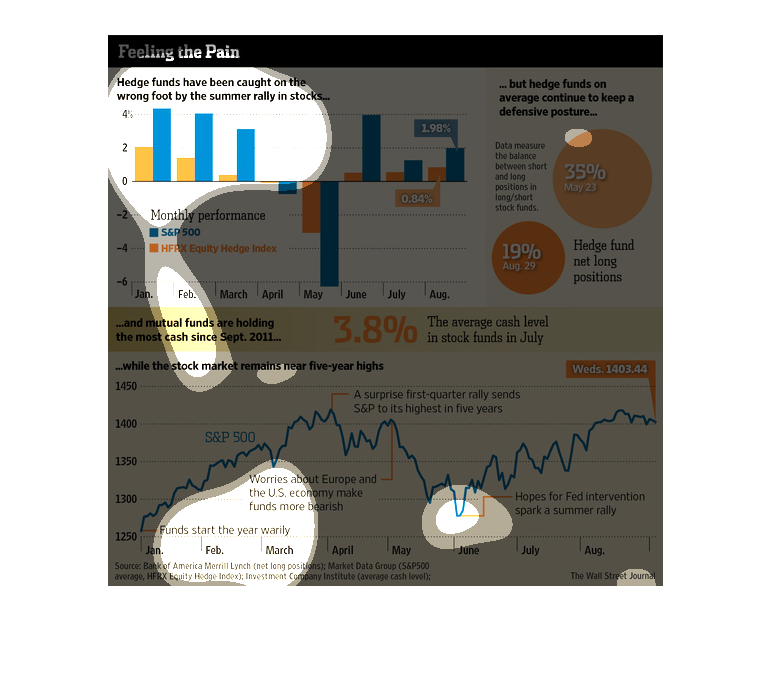
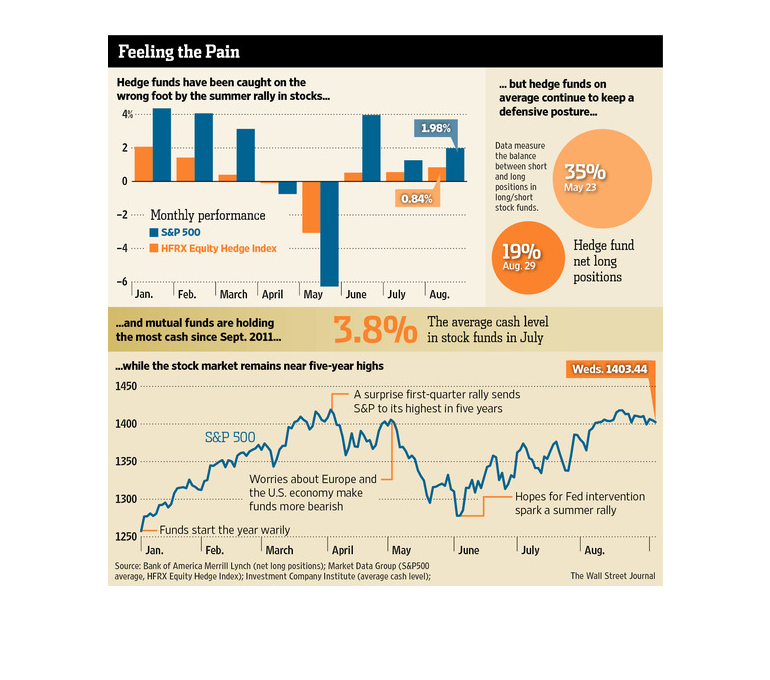
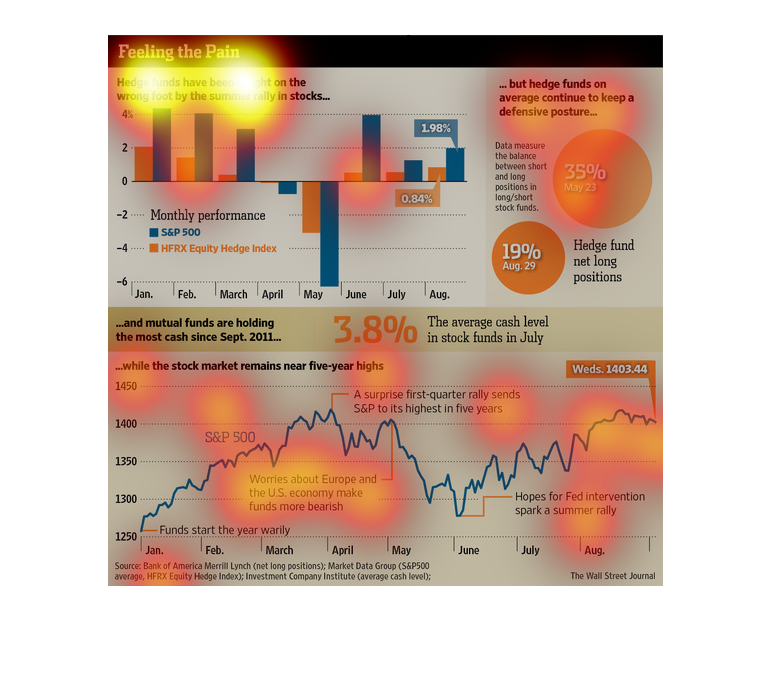
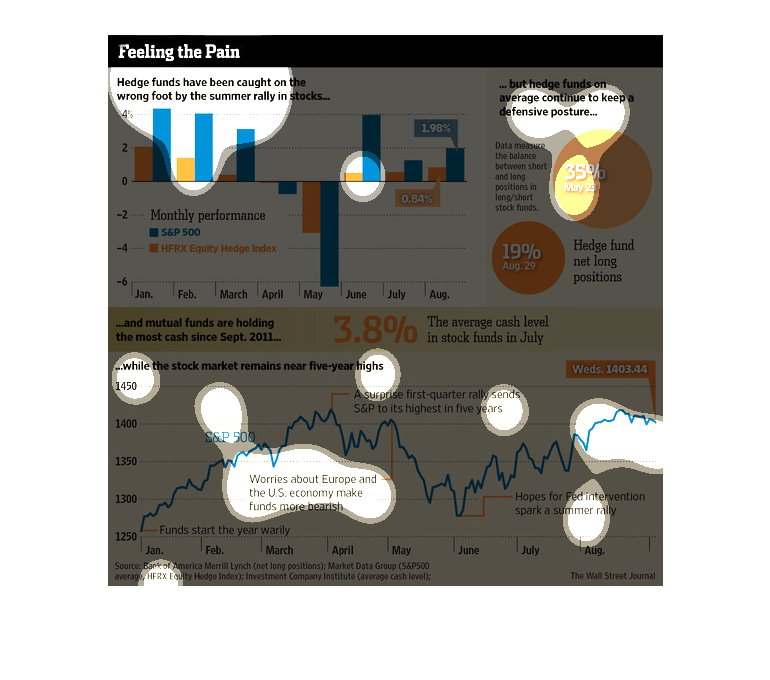
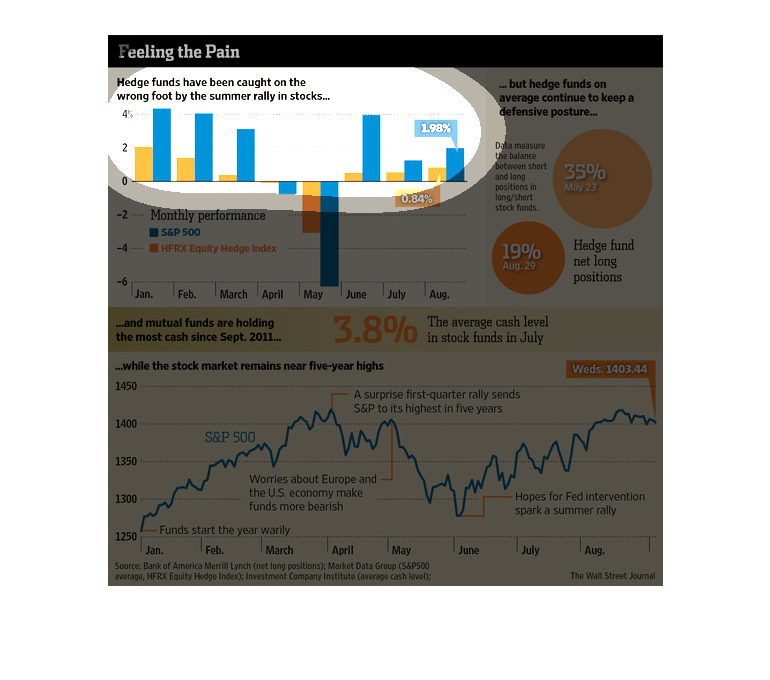
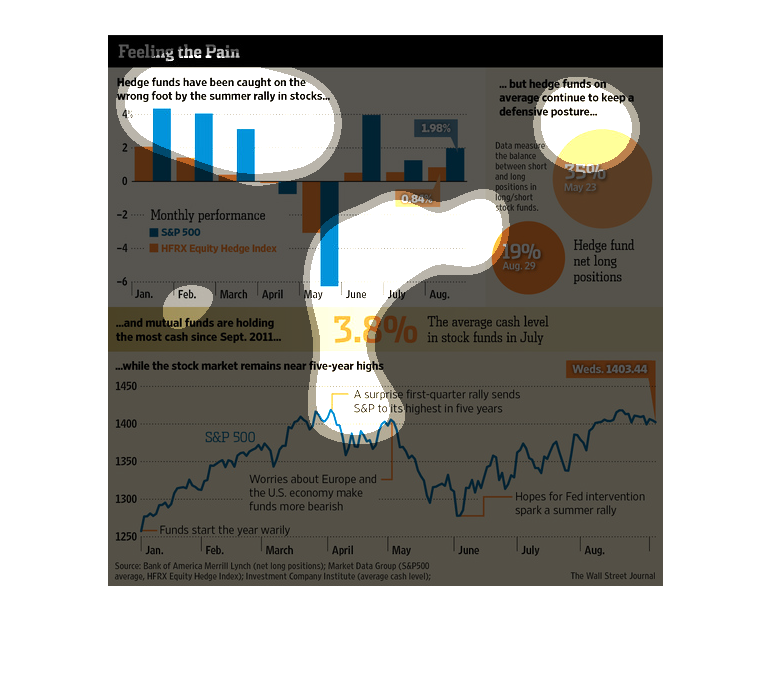
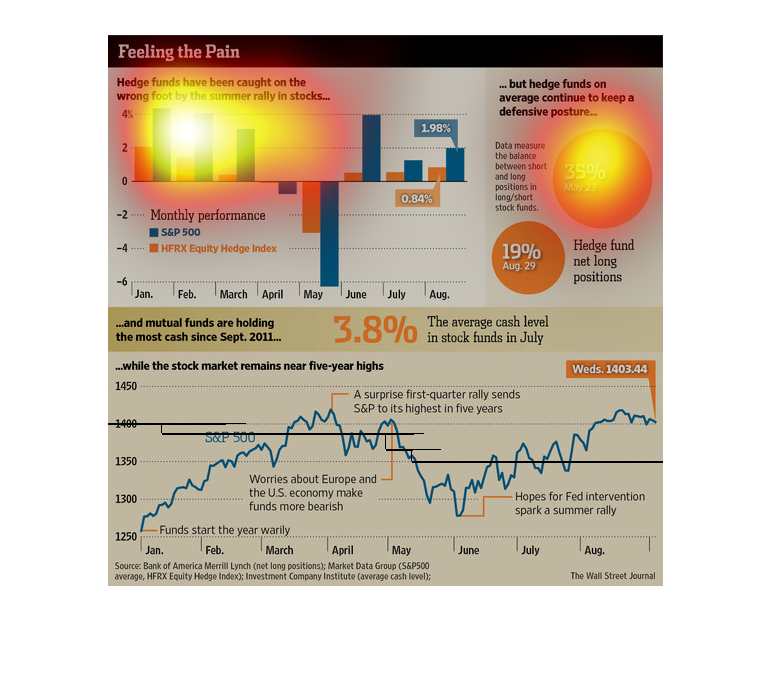
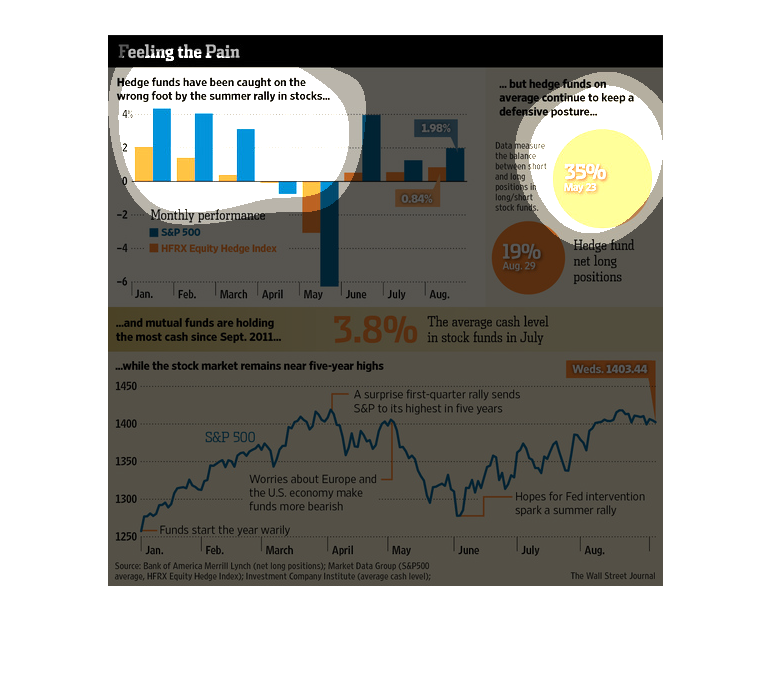
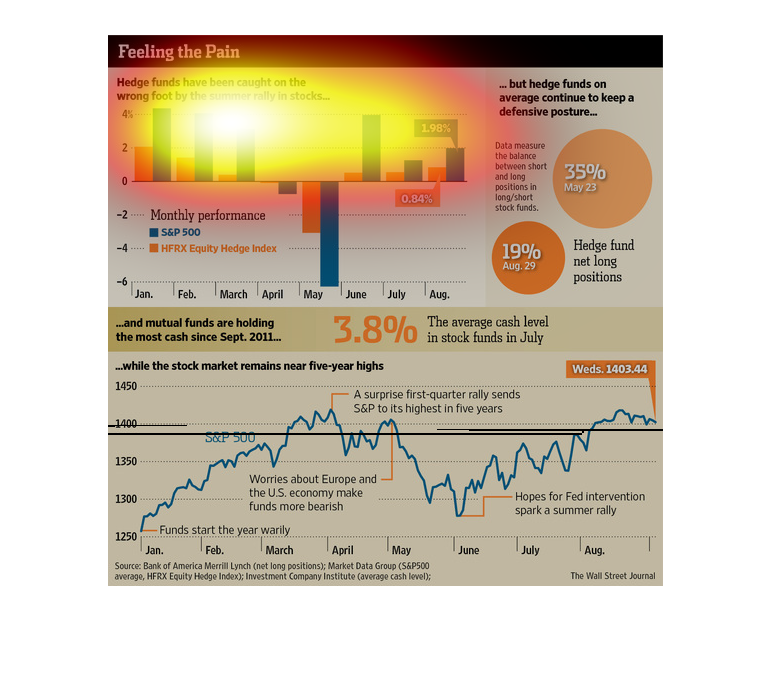
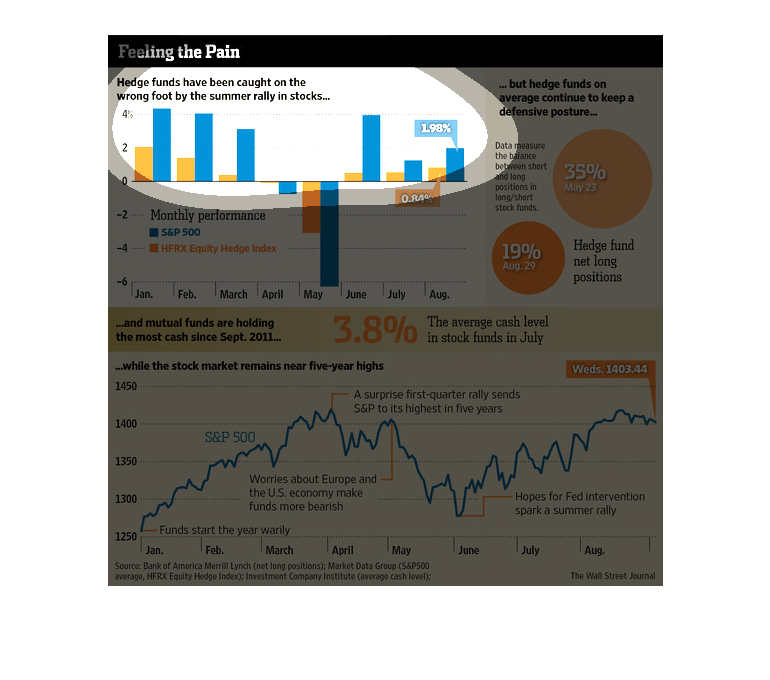
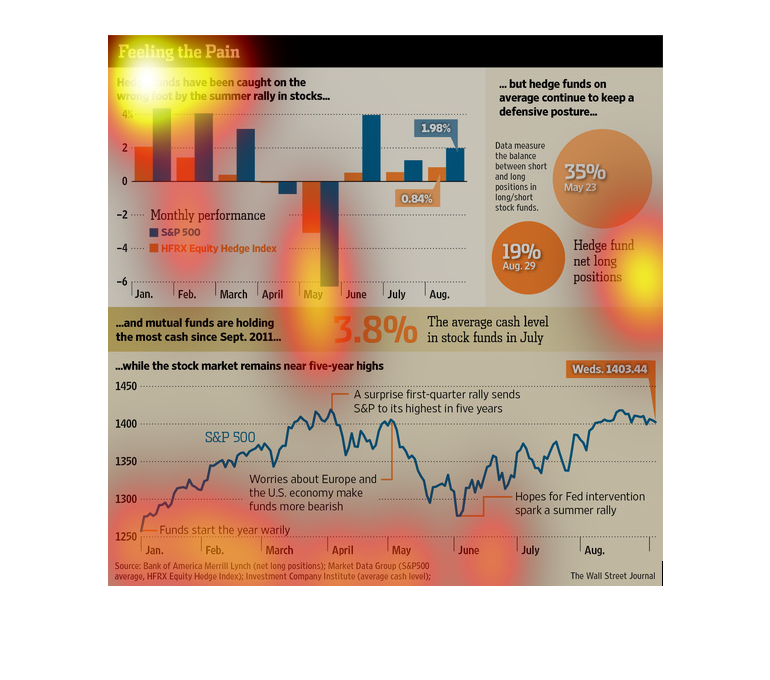
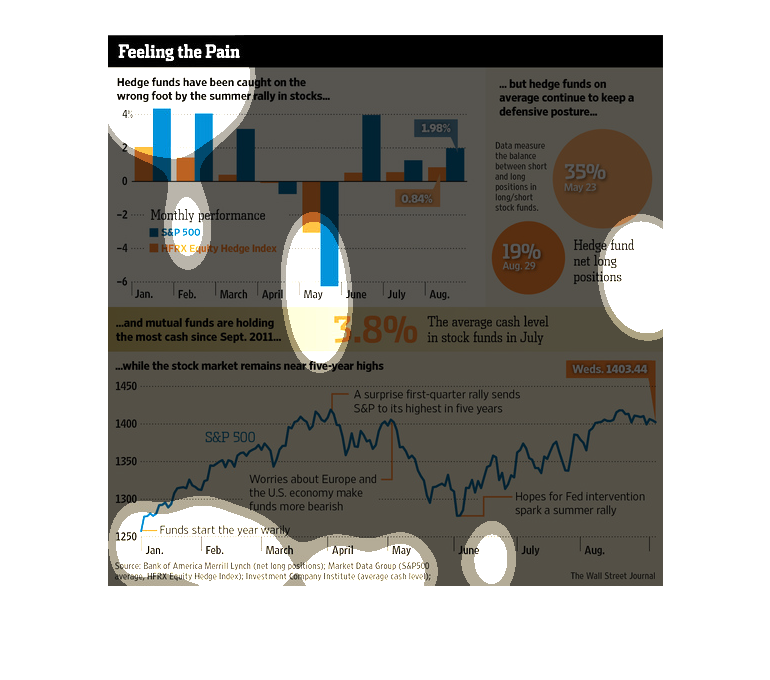
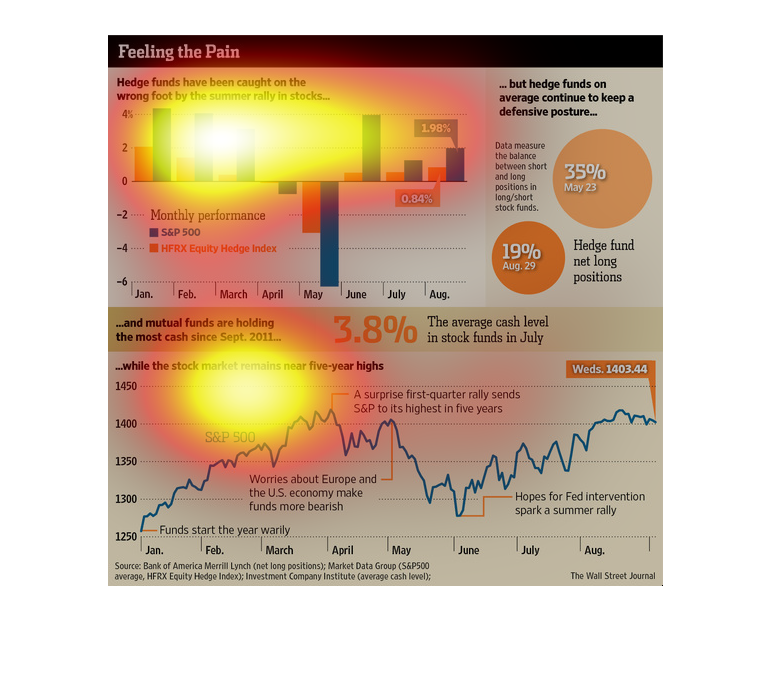
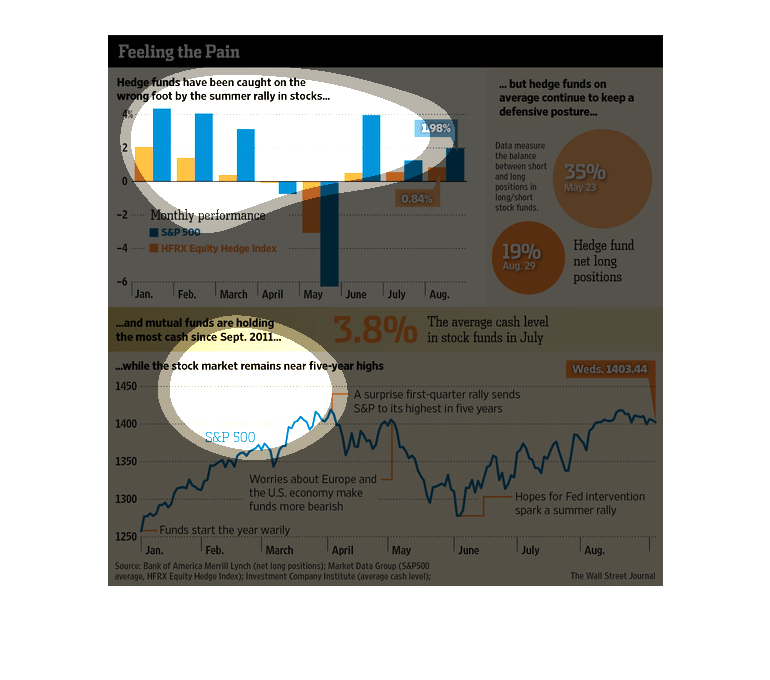
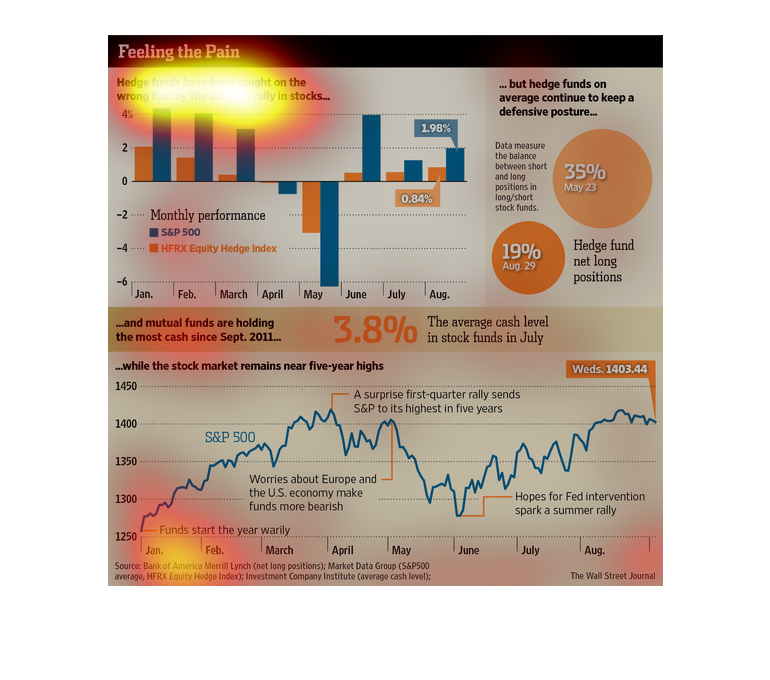
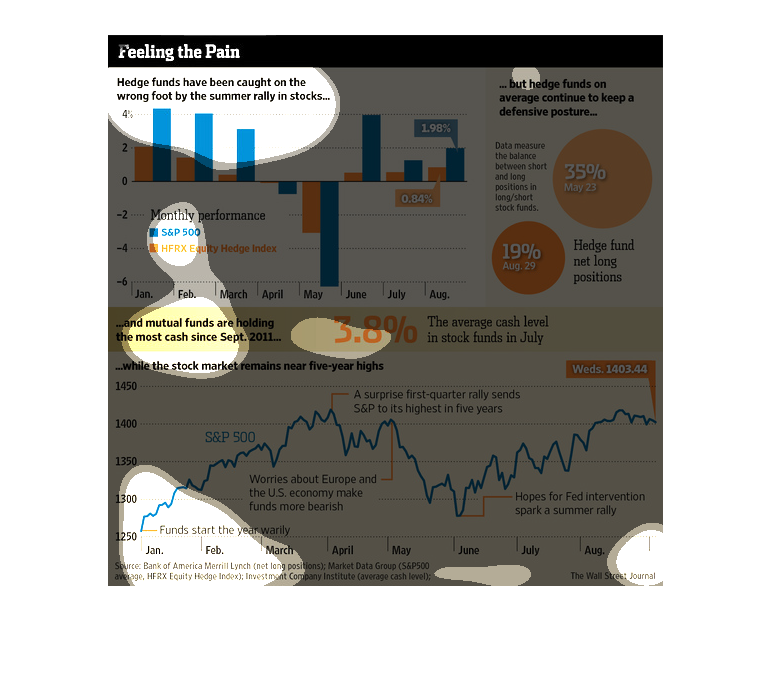
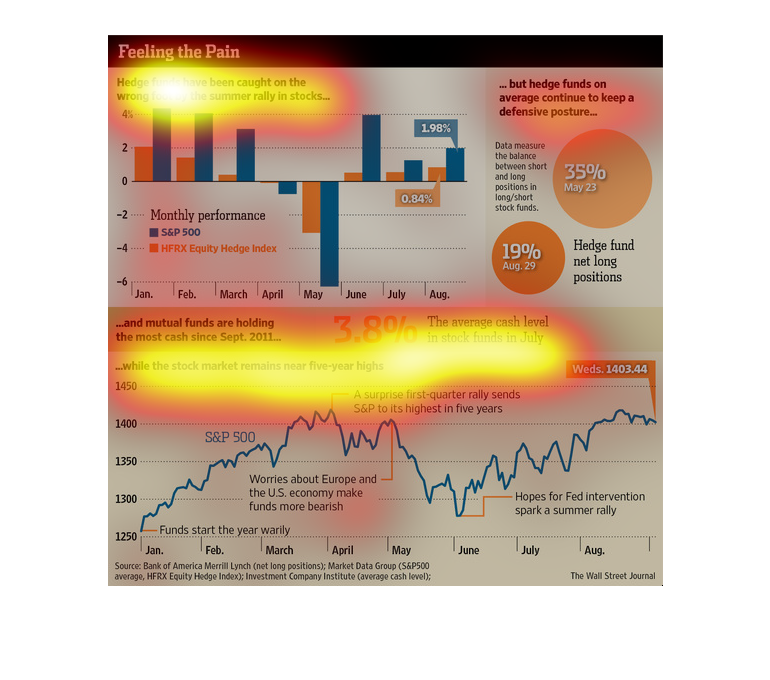
This chart describes feeling the pain. Specifically, hedge funds have been caught on the wrong
foot by the summer rally in stocks. Different categories are represented by different colors.
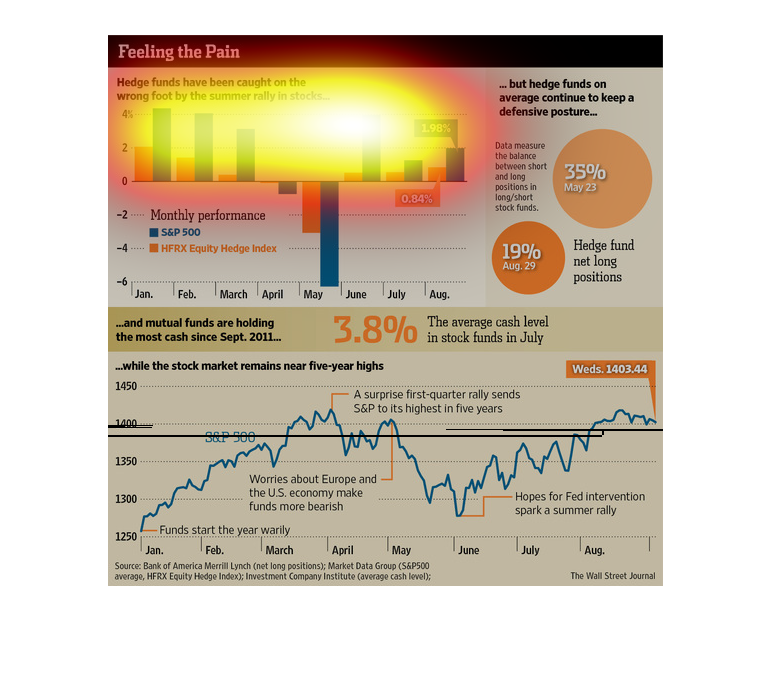
This series of graphs deals with hedge funds. It shows that while hedge funds went down in
the summer, they continue to be reliable. The stock market, on the other hand, is continuing
to rise.
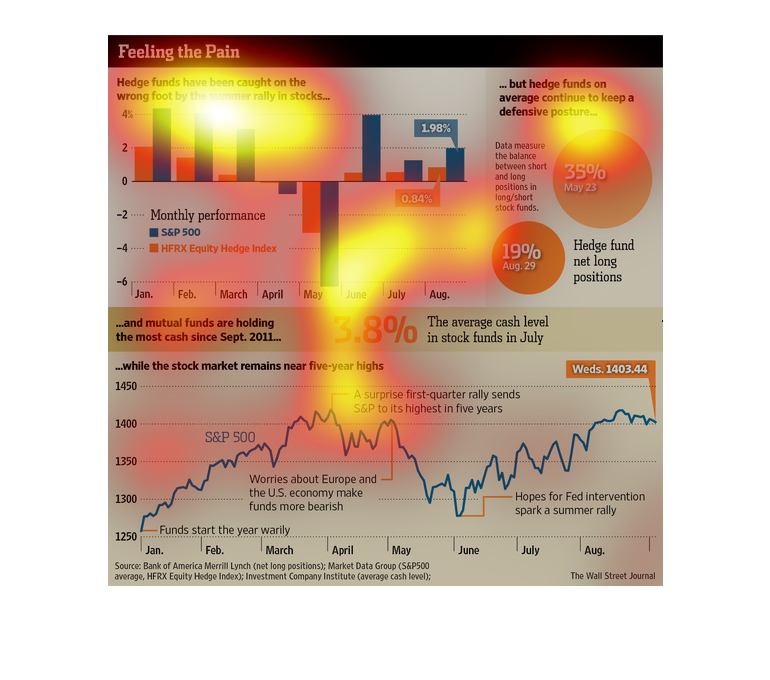
The image depicts how hedge funds saw losses by the time of the summer rally, and then managed
to slightly recover in the following months post-drop off.
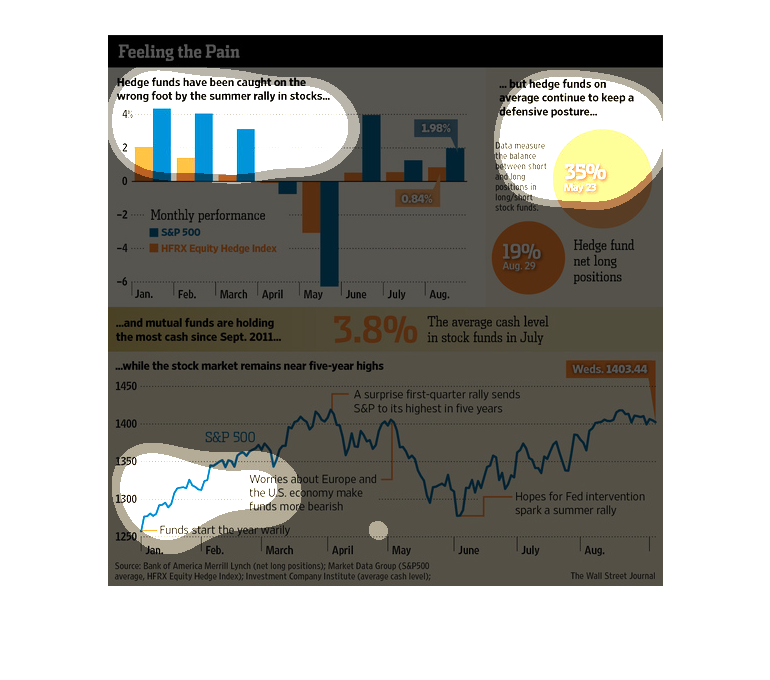
This is a series of graphs, diagrams and charts depicting that hedge funds had been caught
on the wrong foot by the summer rally in stocks but that overall they had maintained a defensive
posture.
This chart describes feeling the pain. Specifically, hedge funds have been caught on the wrong
foot by the summer rally in stocks. Different categories represented by different colors.
the name of this graph is called feeling the pain. this graph has circle graph and bar graphs
and there are 3.8% of people in the world that needs help
This image shows or depicts in statistical bar, line and circle graph formats data concerning
feeling the pain of hedge funds caught on the wrong foot.
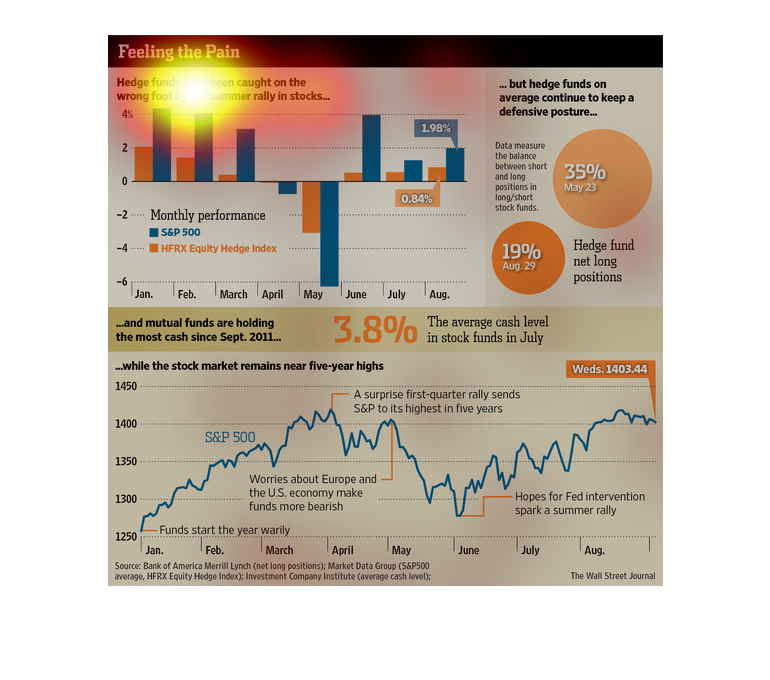
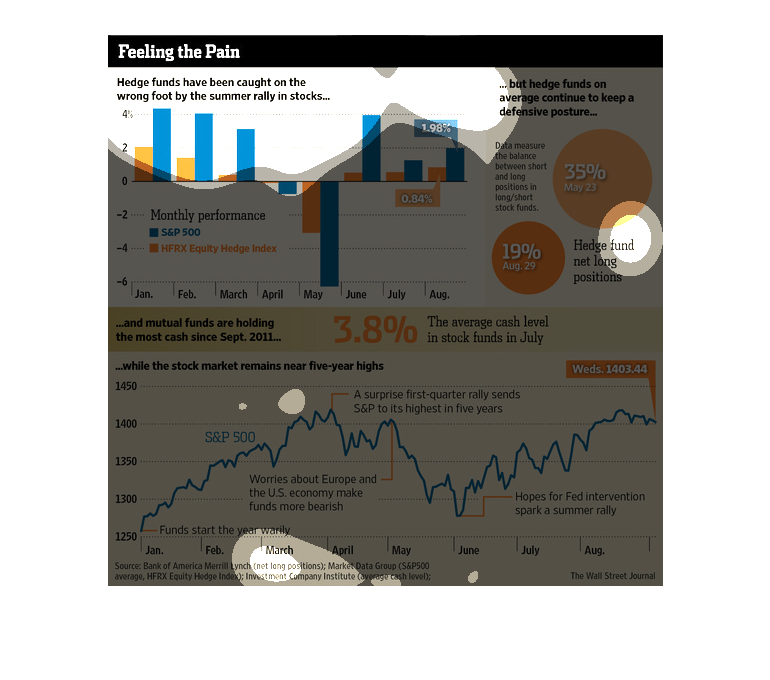
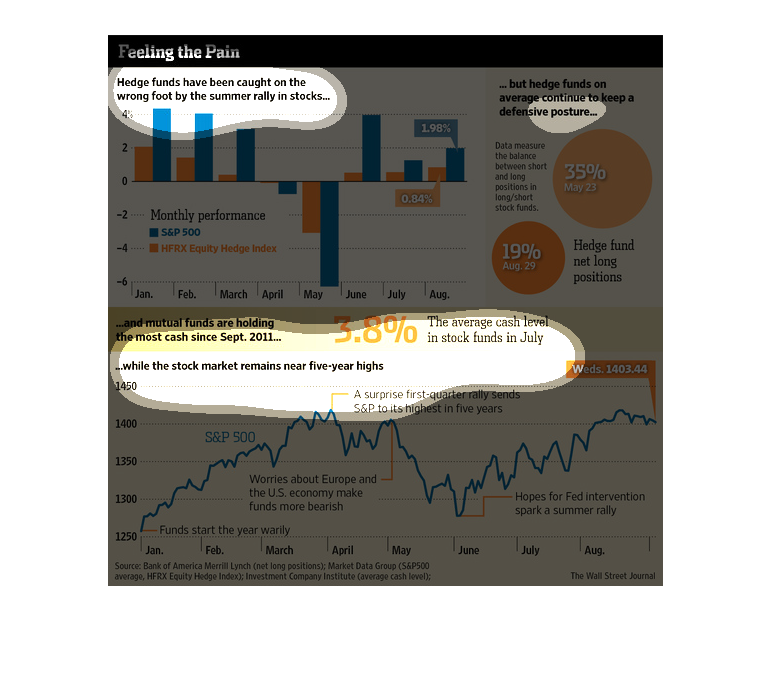
The graph show how the rate of return on hedge funds has been diminished by the increase in
the price of stocks over the summer. It shows the monthly performance of the S&P 500 and HFRX
Equity.
A 2011 economic study conducted by the Wall Street Journal shows that hedge fund bosses where
hit with a major loss that they couldn't have possibly foreseen.
This chart is titled Feeling the pain. It shows Hedge funds have been caught on the wrong
foot by the summer rally in stocks. This is a very interesting, and somewhat intricate chart.
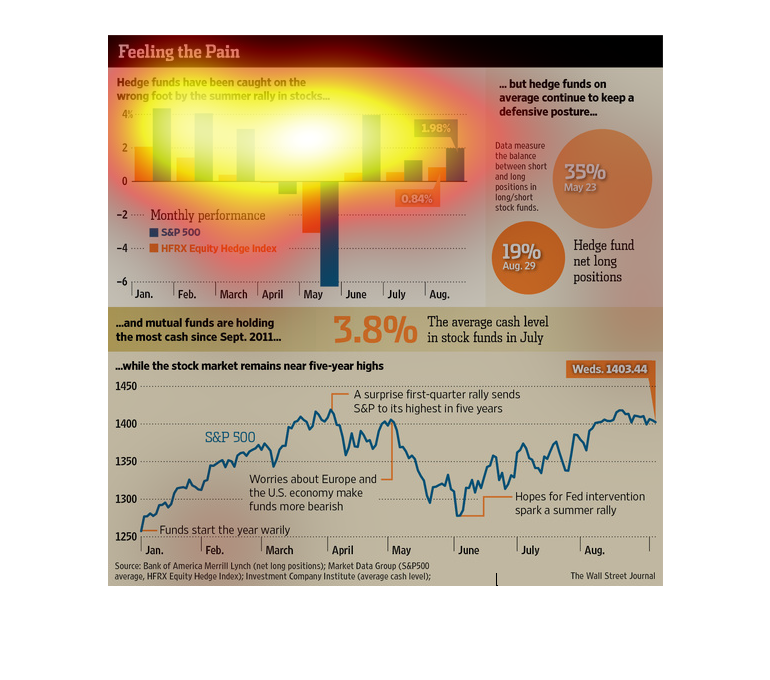
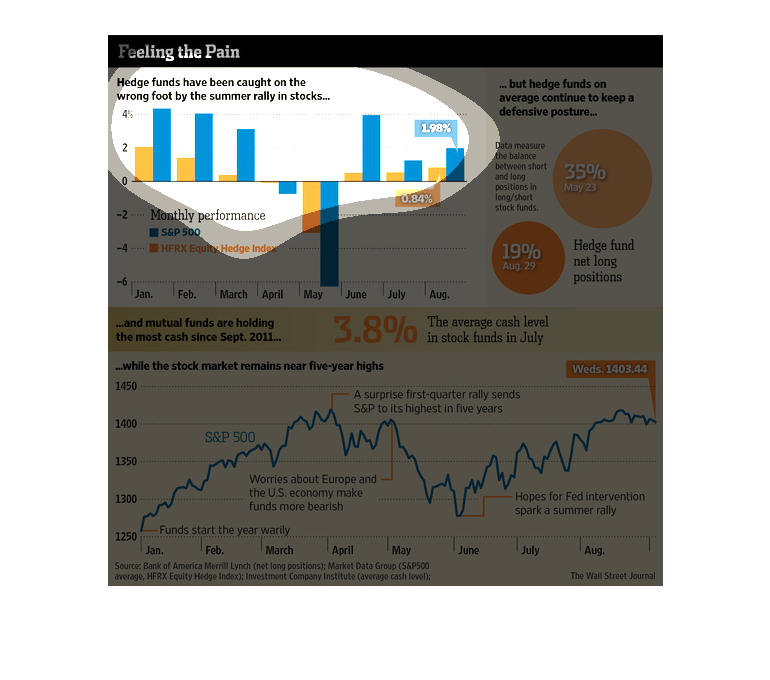
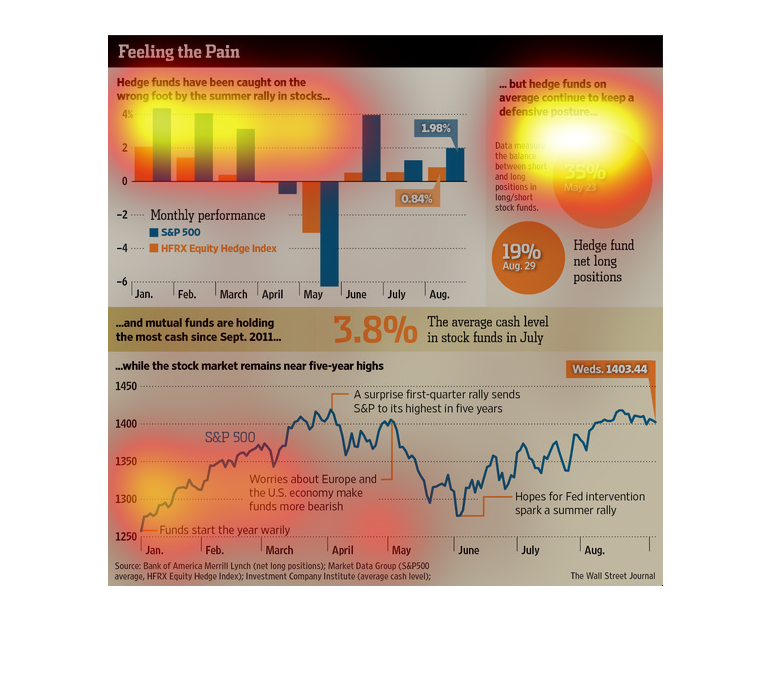
These images are showing the decrease in the hedge fund stocks by the summer rally. 3.8% was
the average cash level in stock funds in July. Still stock markets remain near five year highs.
This is a graphic that is illustrating that new hedge funds have been caught on the wrong
foot by the summer rally in stocks. The trend is covers all the years after September 2011.