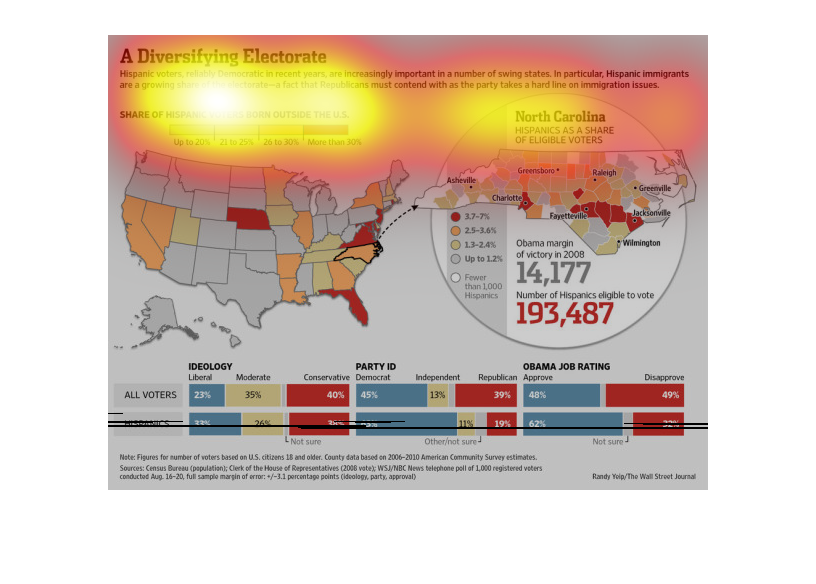
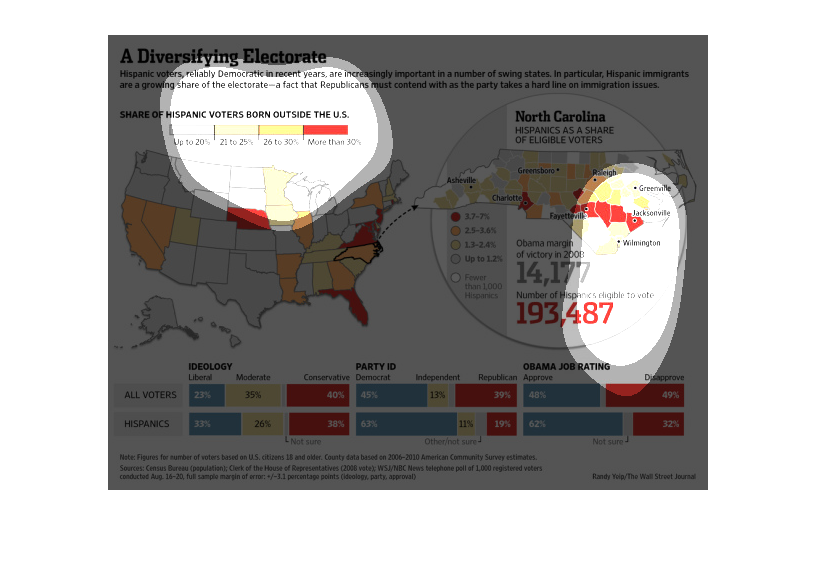
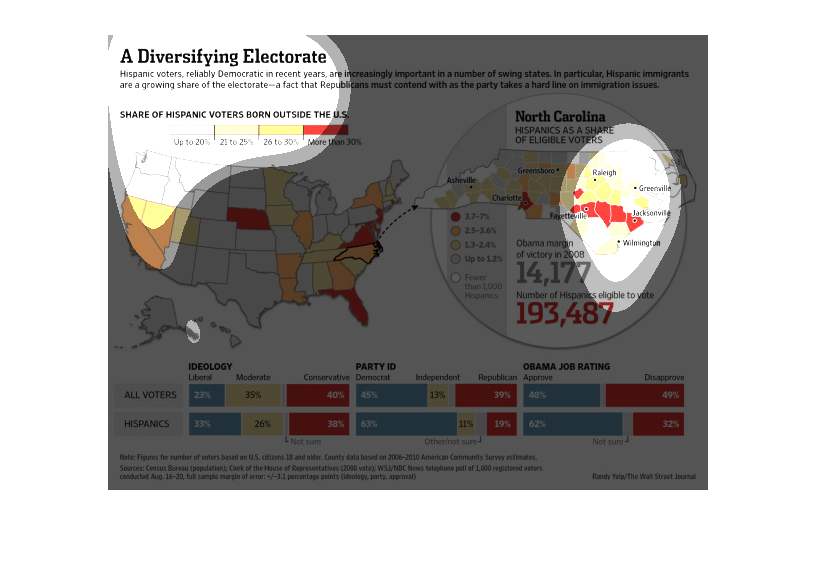
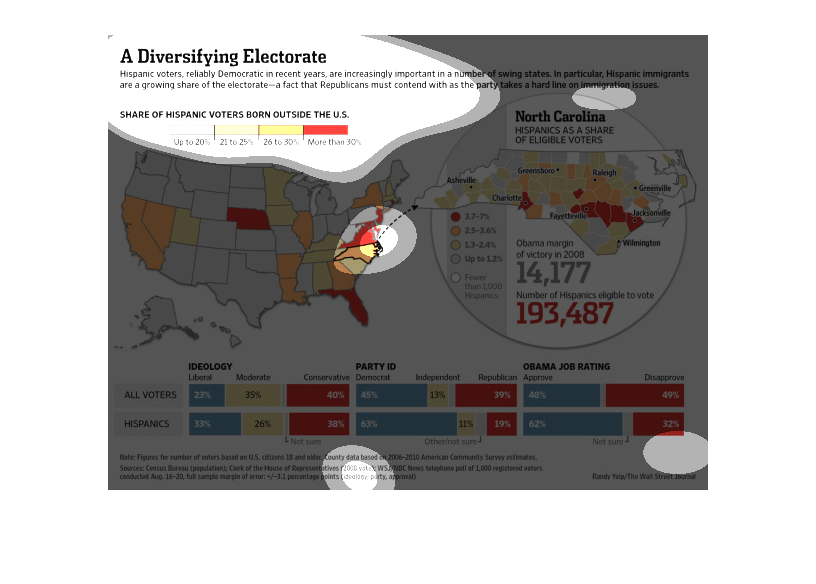
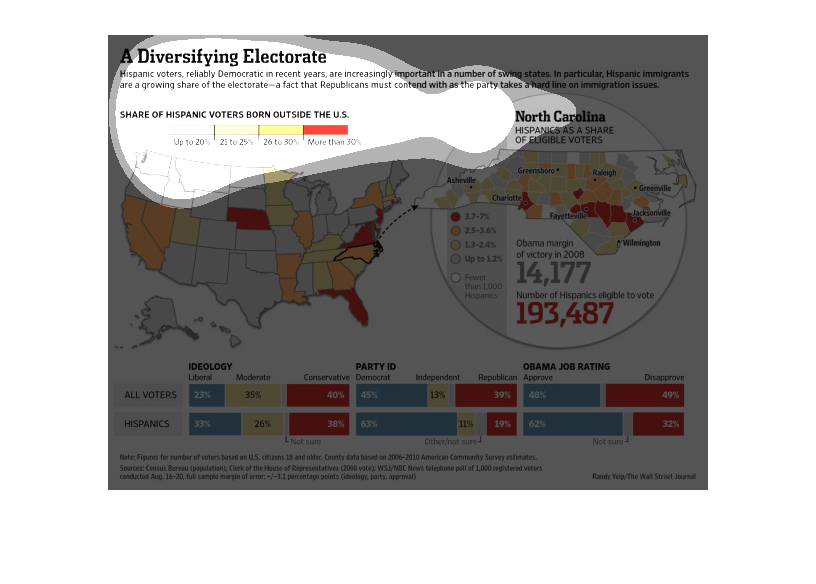
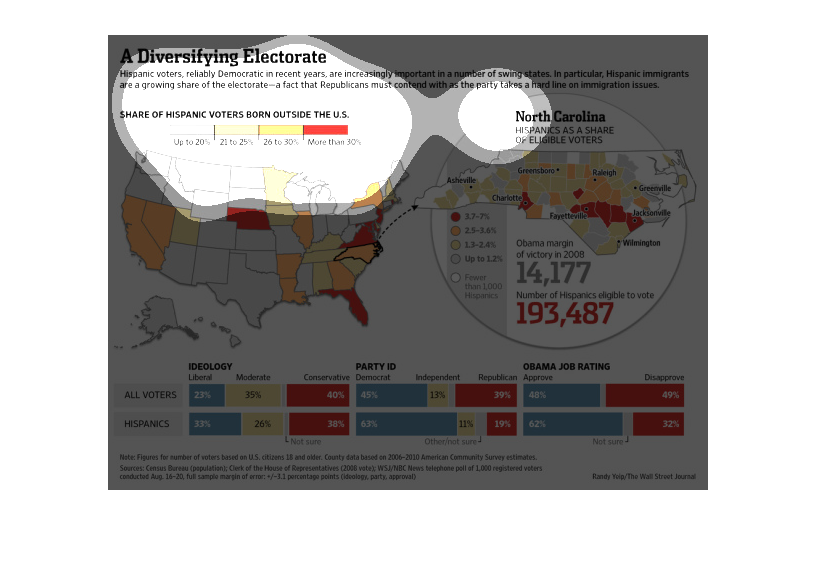
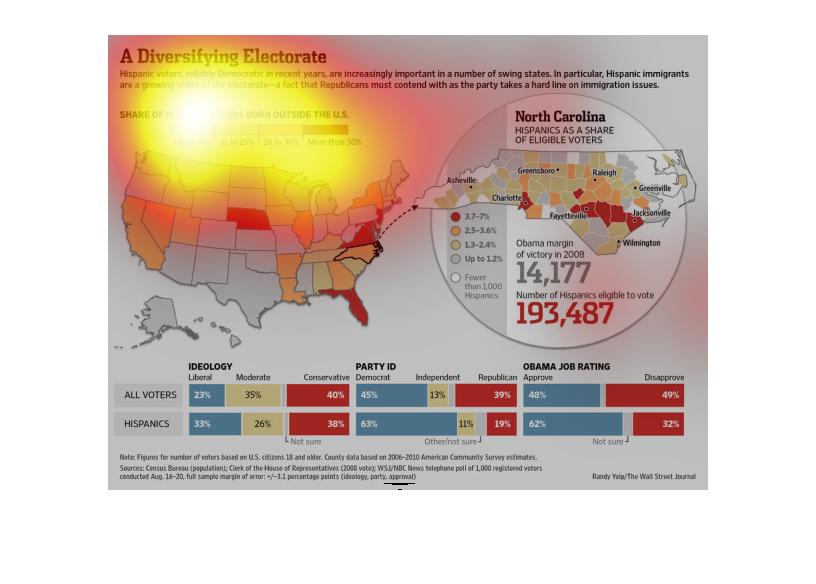
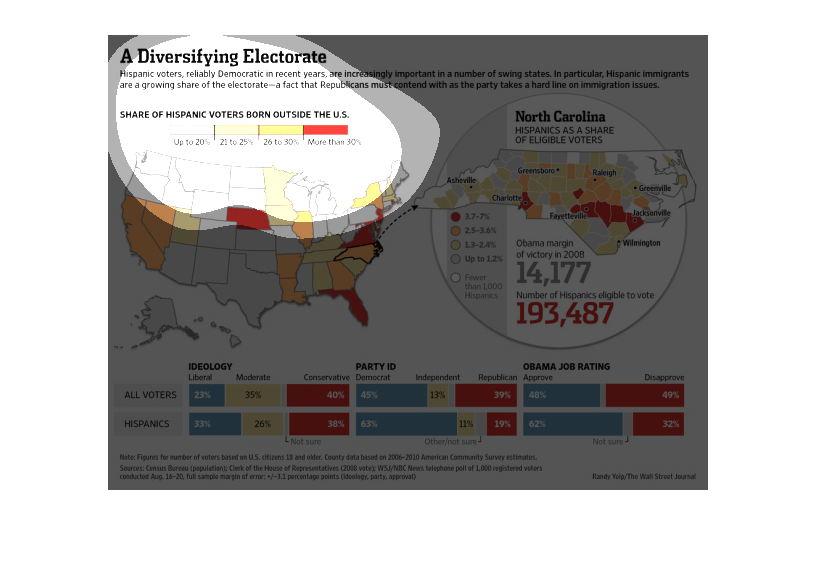
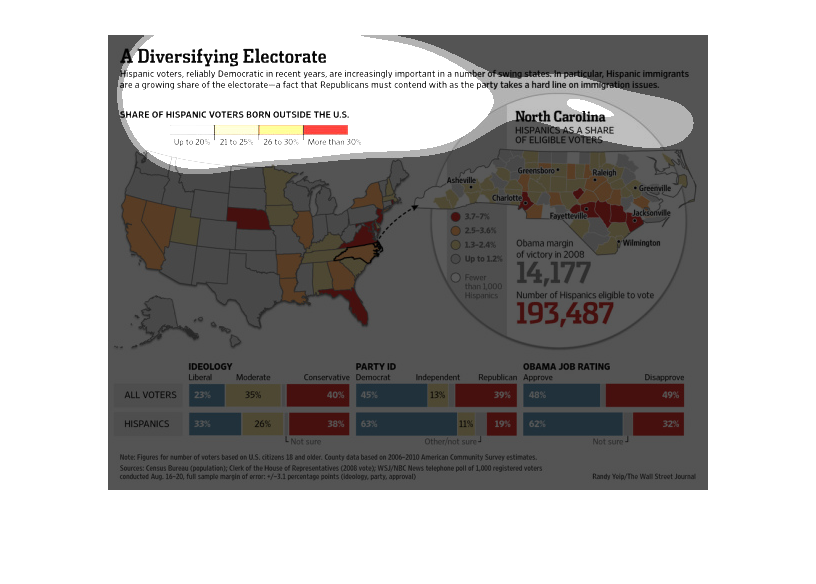
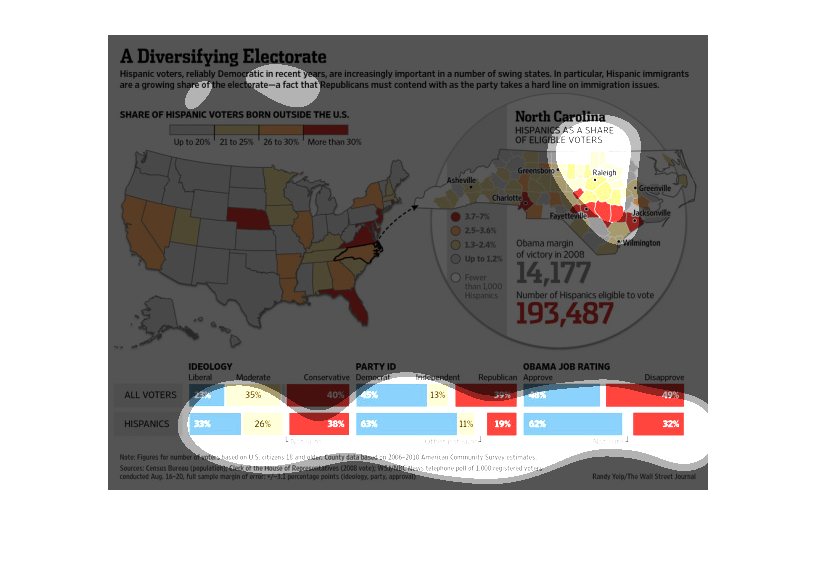
There's an illustration showing the United States, with a breakout view of North Carolina
just to the right of it.  The caption above the illustration of the U.S.,  reads, "A Diversifying
Electorate".  Information contained around the map images reflect Hispanic voters born outside
of the U.S.
This chart shows the distribution of foreign born Hispanic voters in the USA and their political
views compared to the typical American voter. Hispanic voters are more likely to vote Democrat.
Foreign born Hispanic voters are especially concentrated in Florida, the North East and California.
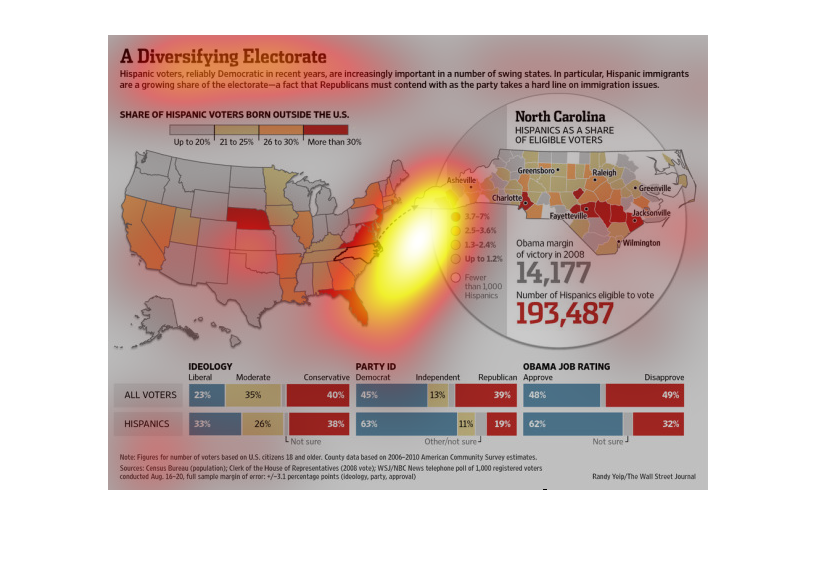
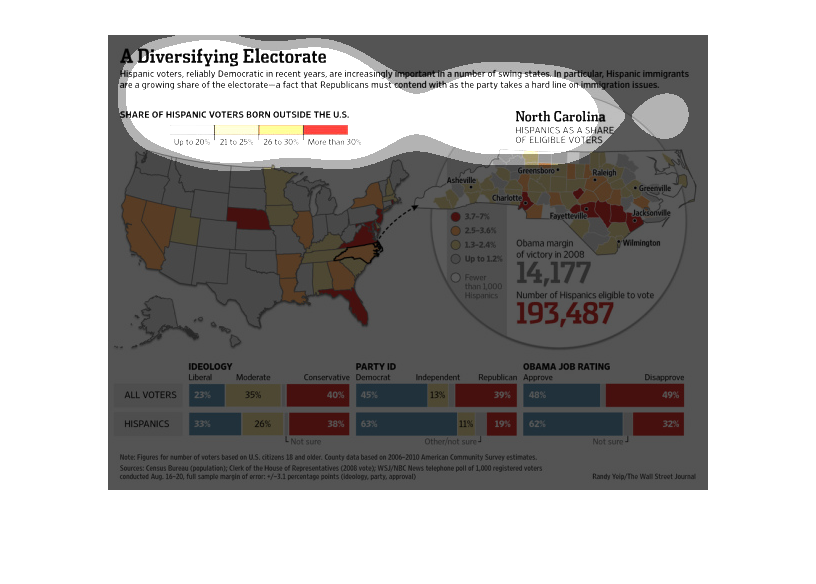
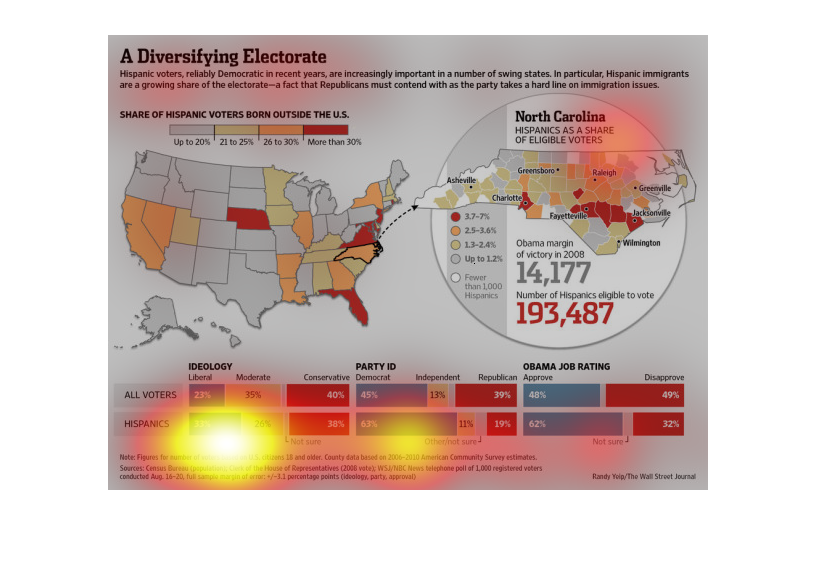
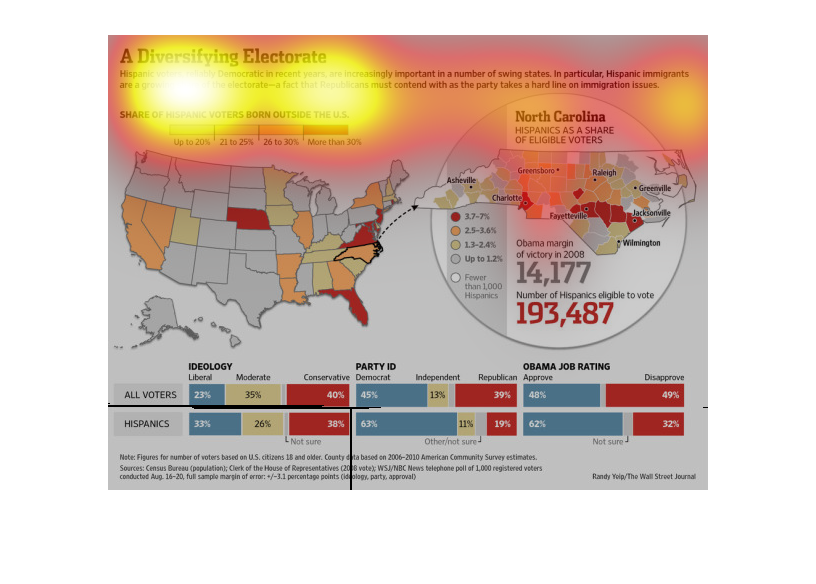
This chart describes a diversifying electorate. Different areas on the chart are represented
by different colors on the map of the United States, and North Carolina.
This graph shows how many Hispanics are allowed to vote and how many were born out of the
u.s.  This graph uses colors to color code percentages. It also shows the comparison of how
many people are eligible to vote and how many of those people are Hispanic.
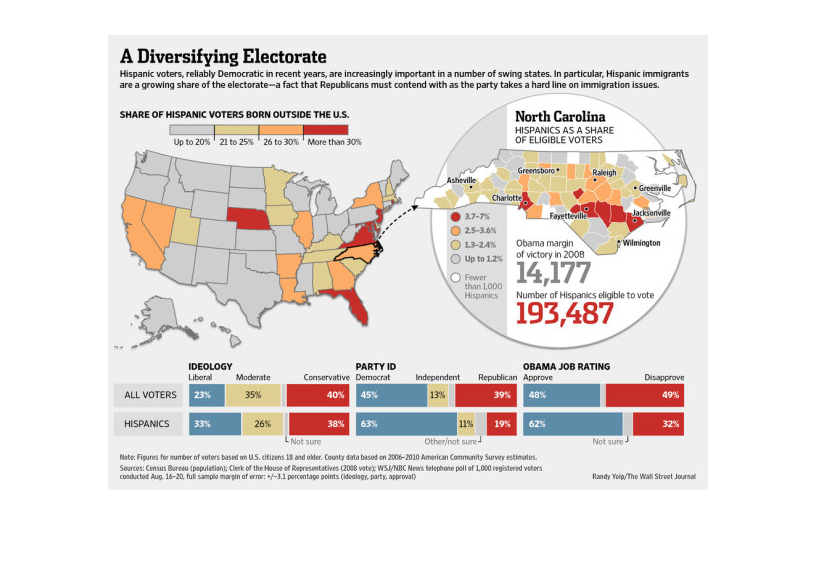
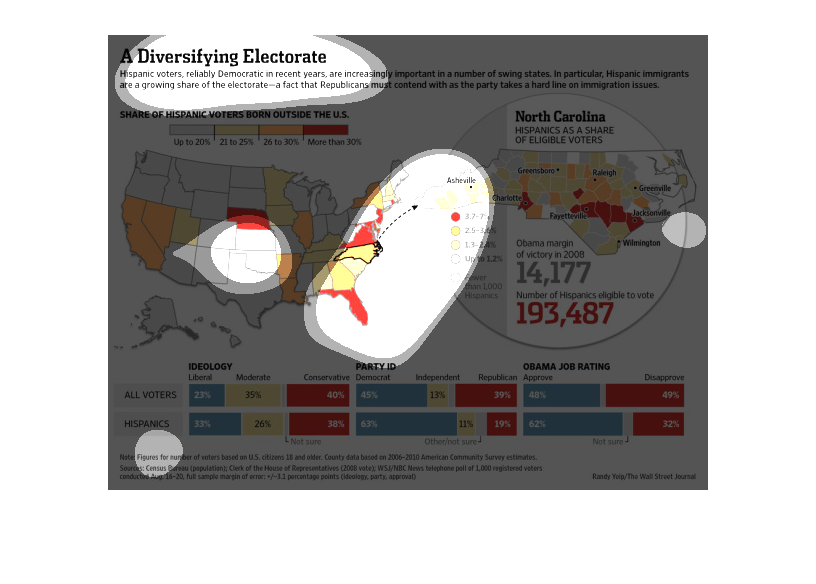
This image shows or depicts in bar graph and US geograpical format statistics bearing or dealing
with Hispanic voters in an increasing diversified manner influence with swing votes the outcomes
of an election.
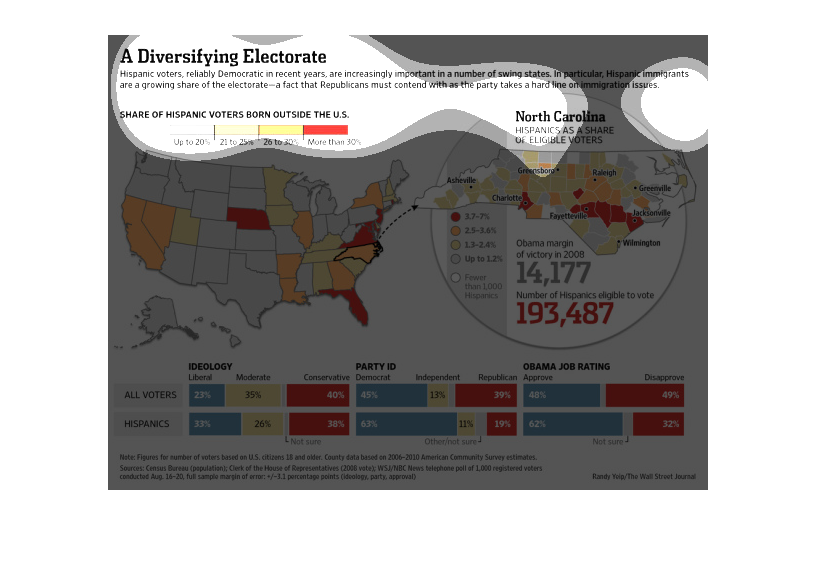
The image depicts the importance of Hispanic voters and their reliability in voting for The
Democratic Party. The demographics bode very well for The Democratic Party with Hispanics
having strong support for the Democrats. The republicans have far fewer support among Hispanics.
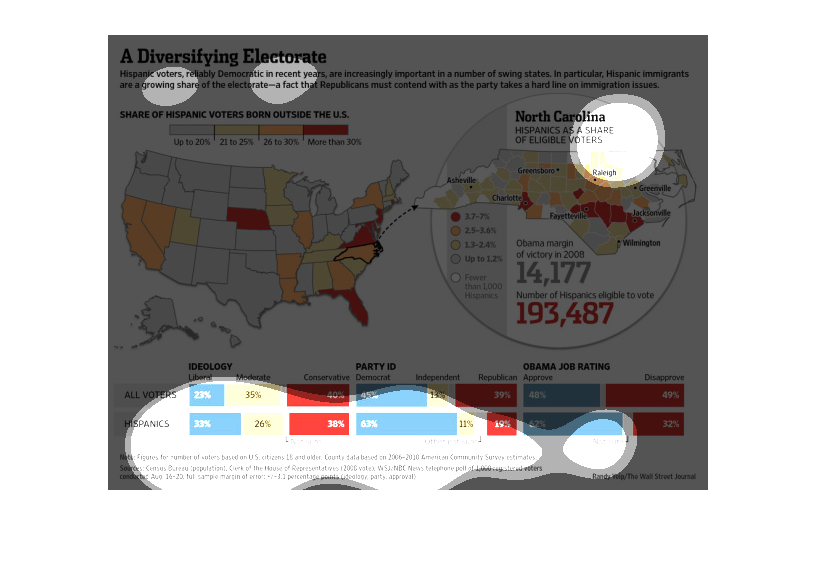
This is a series of national maps, diagrams and charts with related statistics depicting that
the Hispanic voting bloc are becoming more and more of a swing vote factor.
This chart is showing how Hispanics have been historically Democratic over the years, are
becoming increasingly important in some swing states. More specifically, Hispanic immigrants.
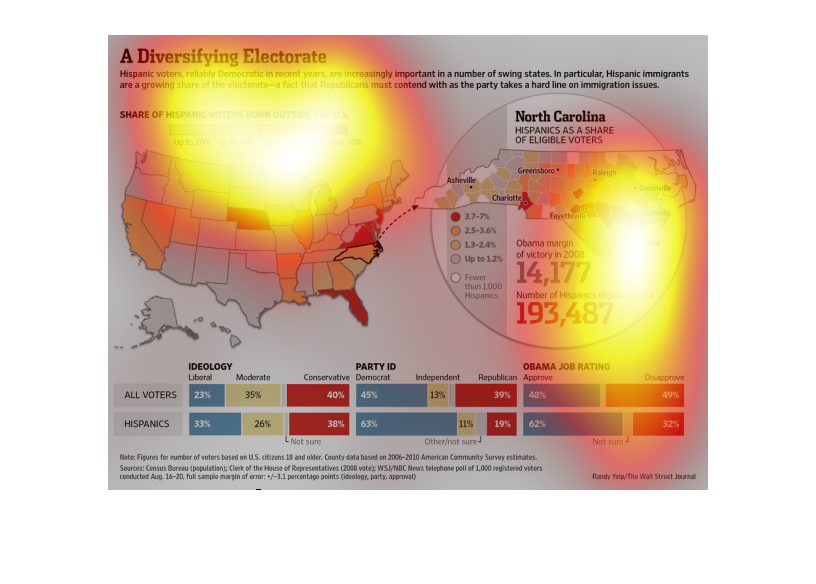
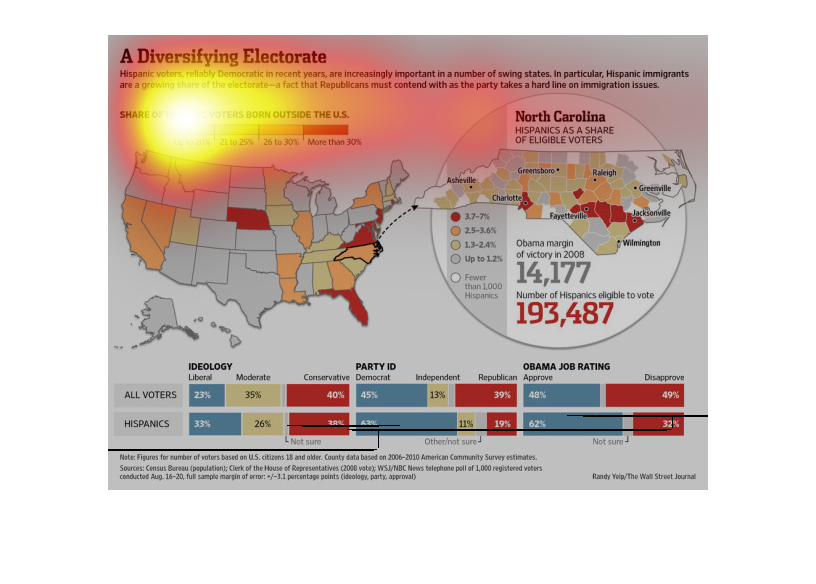
This chart/graph shows that Hispanics are rapidly growing as one of the most influence races
of the ballots for elections. The graph shows the Hispanics that voted that were born outside
of the USA.
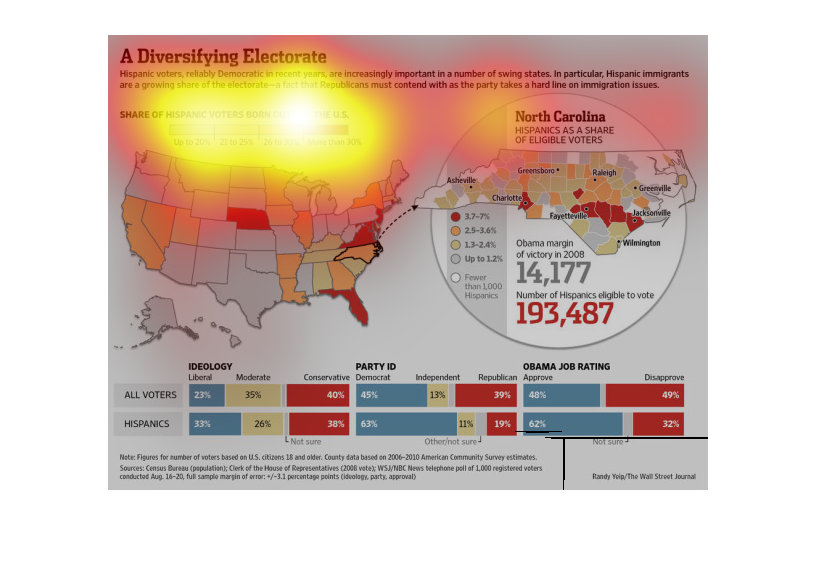
This is a series of statistics, maps and charts which all depict the role of the modern day
Hispanic voting bloc. Historically democratic, they are becoming more of a swing vote.
This chart describes a diversifying electorate.Specifically, Hispanic voters, reliably democratic
in recent years, are increasingly important in a number of swing states.
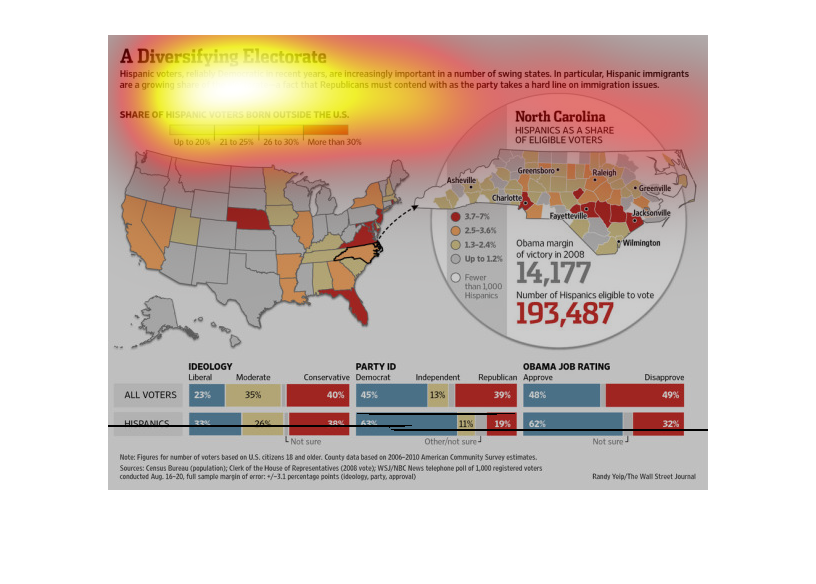
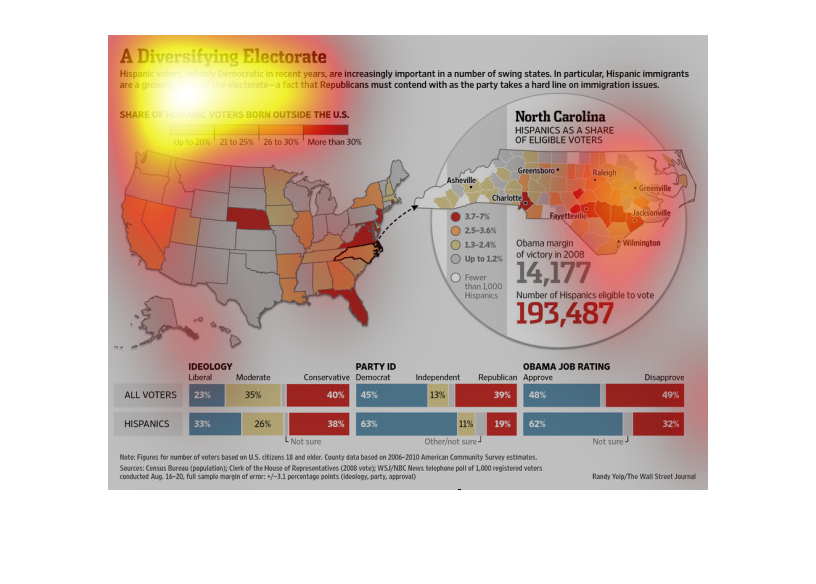
This chart shows the location of Hispanic voters born outside the US, in the US and South
Carolina and their ideology compared to the typical American Voter.  Hispanic voters are more
likely to be Democrat and more likely to think Obama is doing a good job. There are more Hispanic
voters in Florida, North Carolina, California, and Nevada.
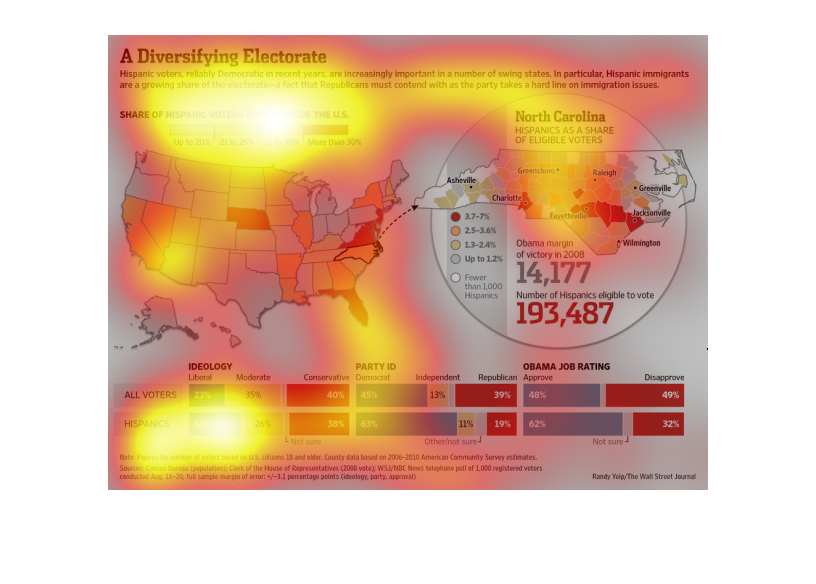
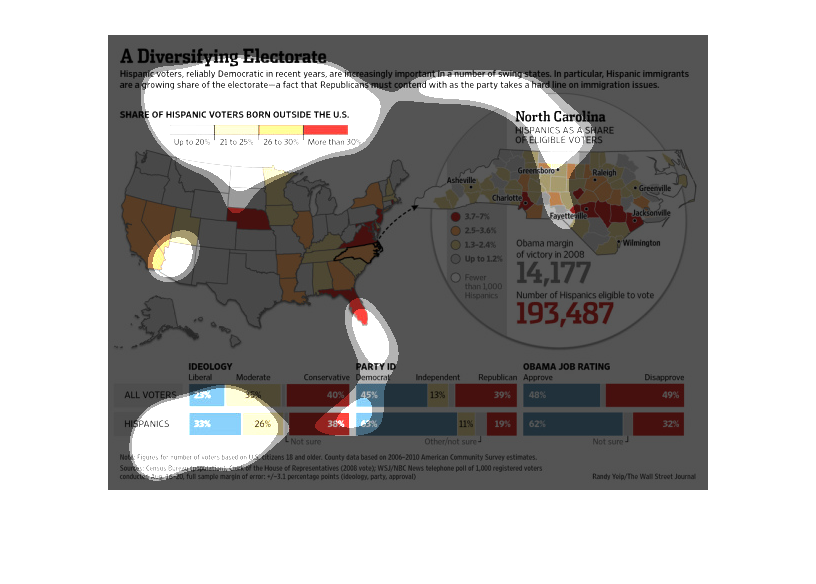
Chart shows relationship between demographics and ethnicity of states, and their political
leanings. It displays the difference of hispanic voters from the total population in their
respective states.
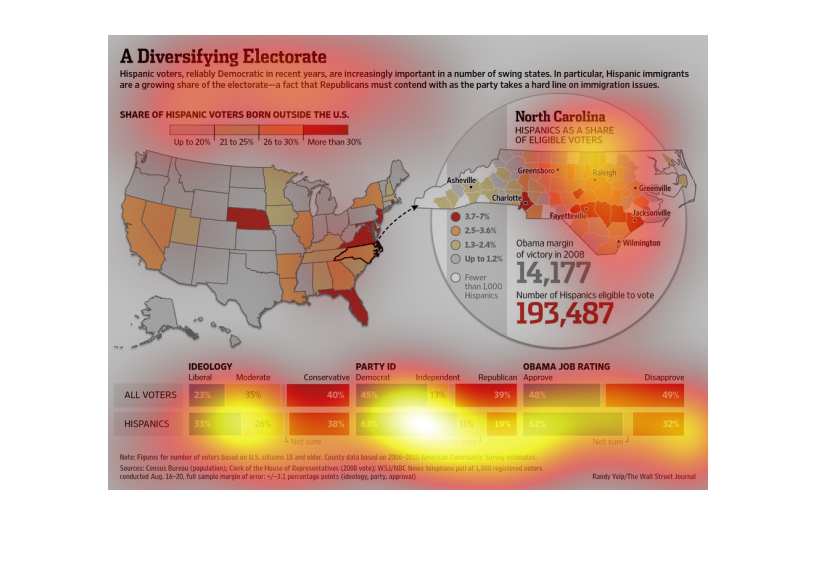
The image depicts the ever-diversifying electorate within the context of Hispanic voters and
Hispanic immigrants supporting the Democrat party over the Republican party in the US. Hispanics
are becoming one of the most important minority voting blocs in the US.