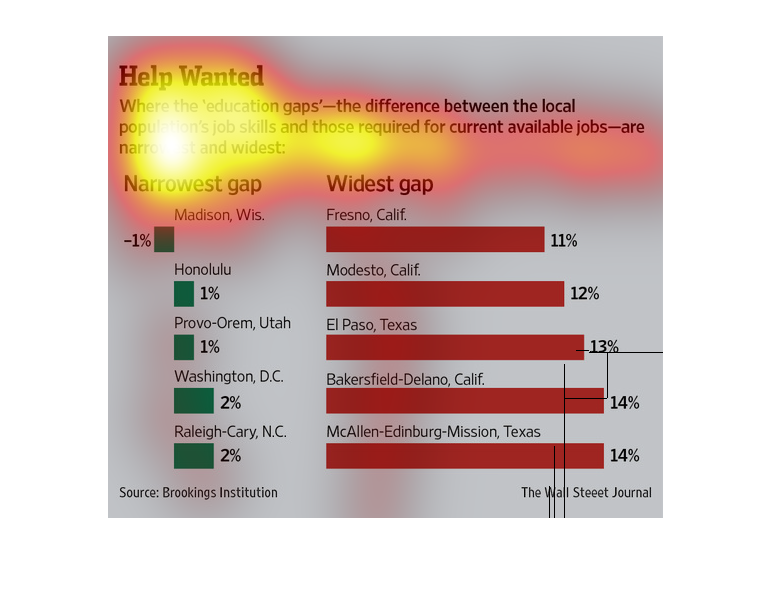
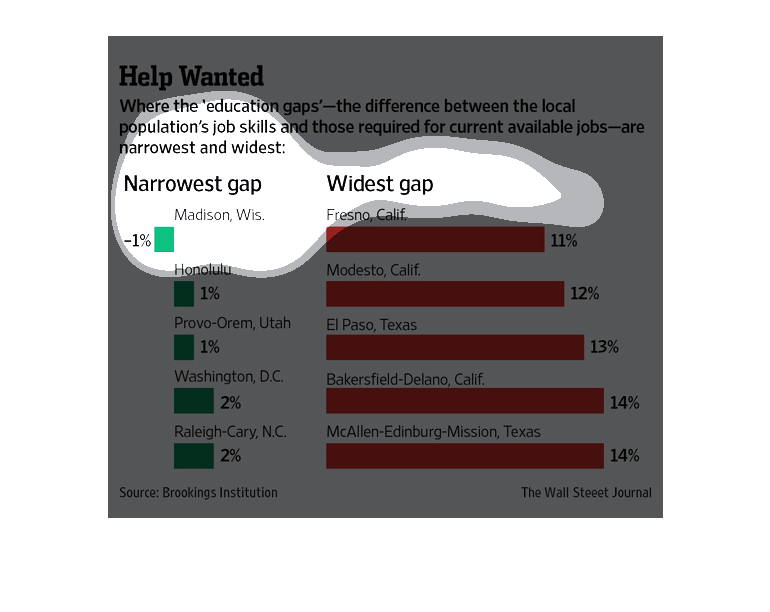
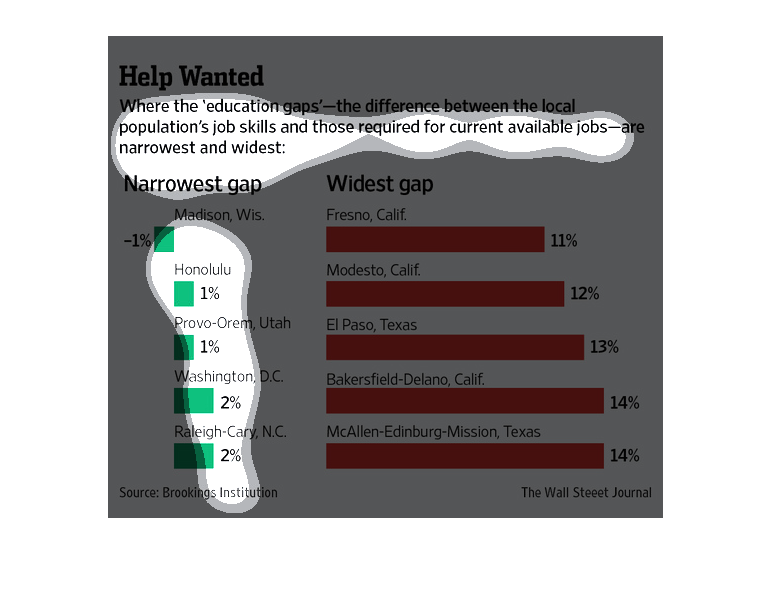
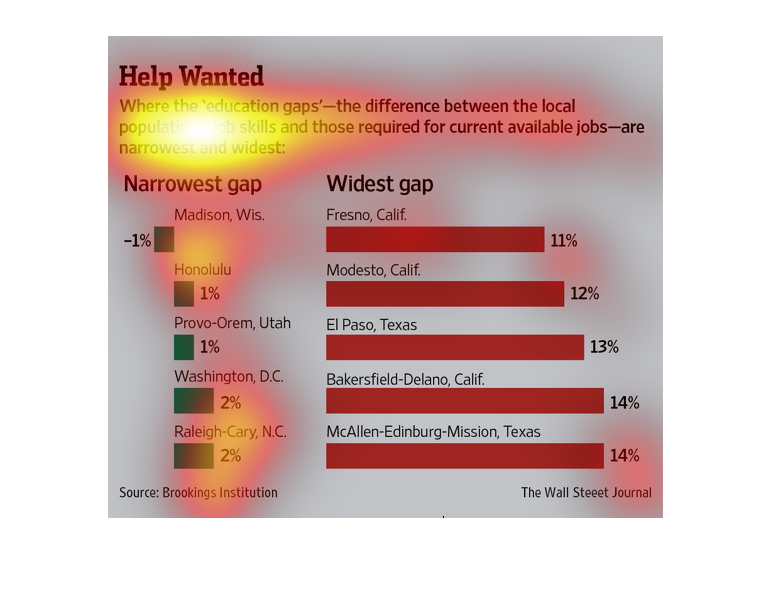
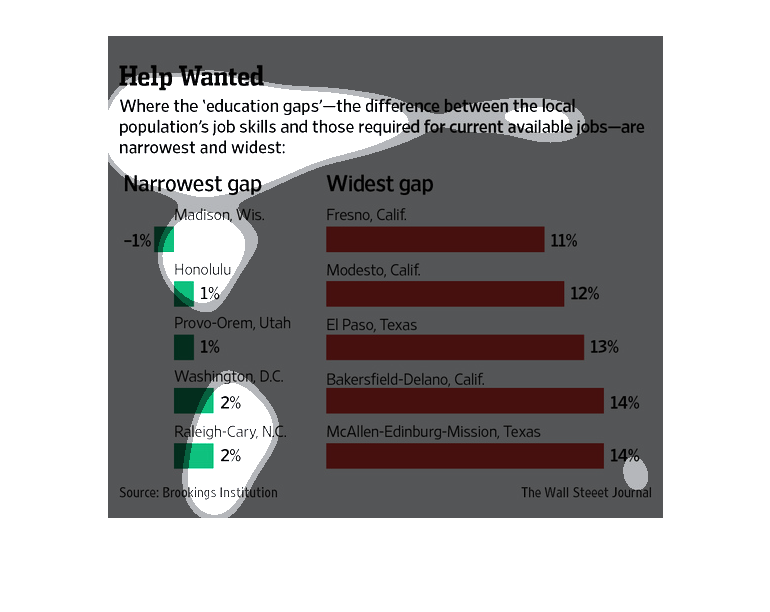
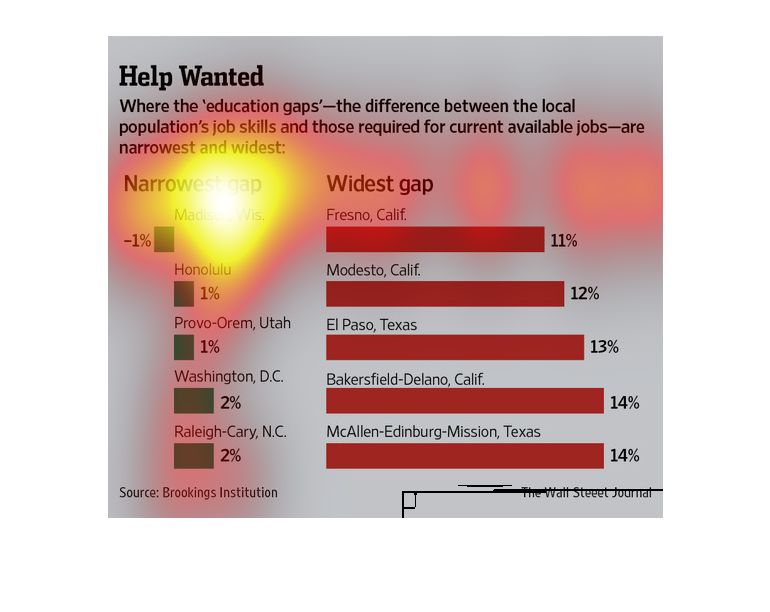
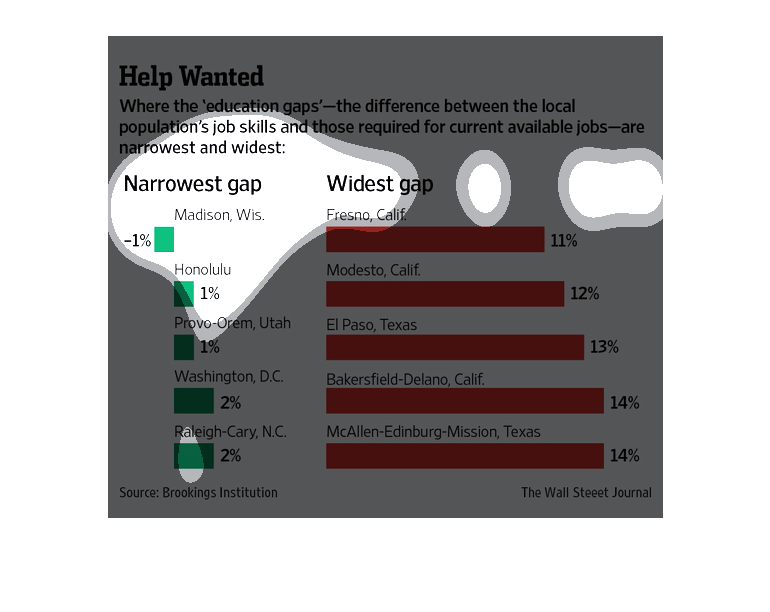
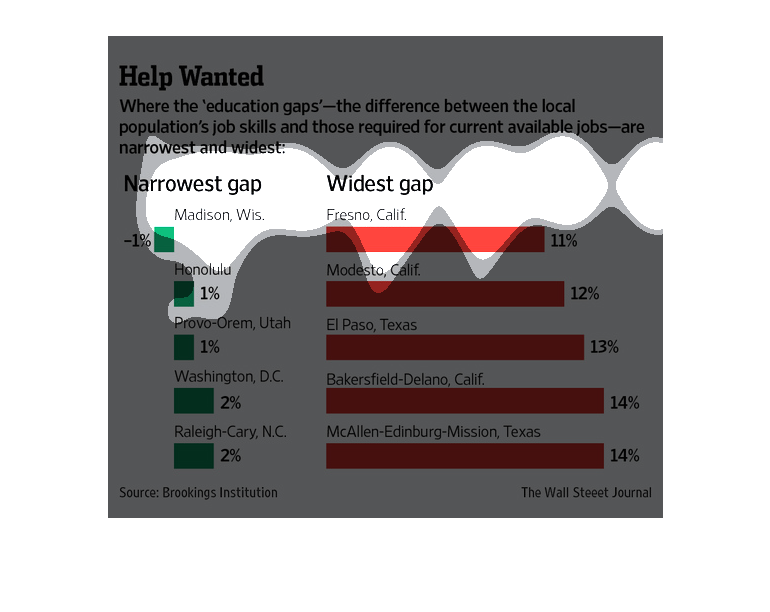
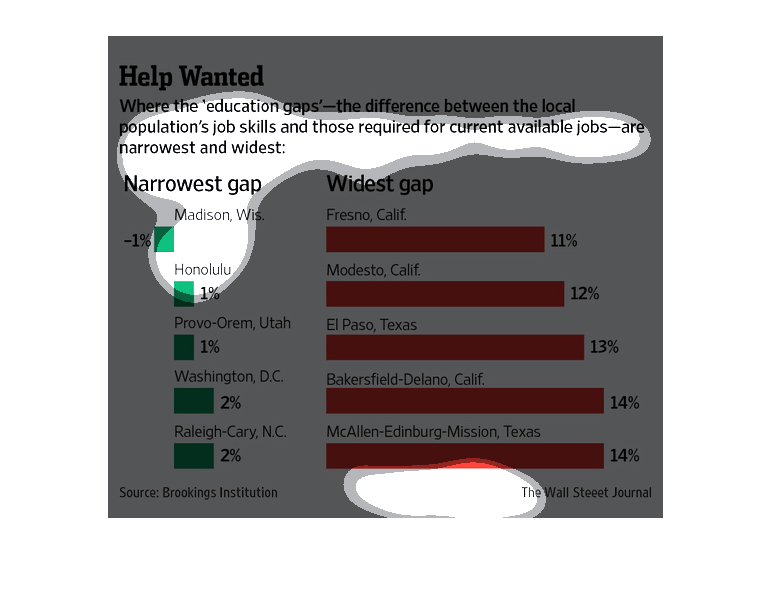
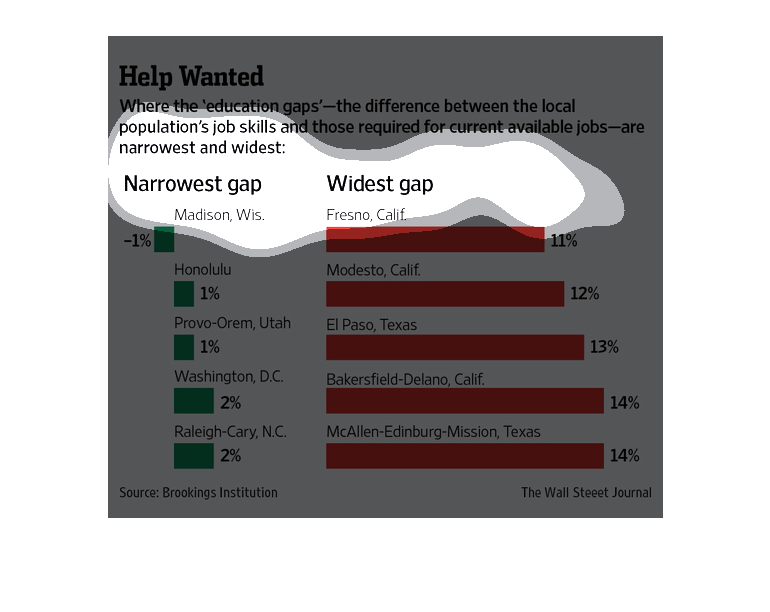
This chart describes help wanted. Specifically, where the "education gaps" - the difference
between the local population's job skills and those required for current available jobs -
are narrowest and widest.
the current state of affairs in america when it comes to the job skills that are currently
had by the population, and then the needed job skills for the job market
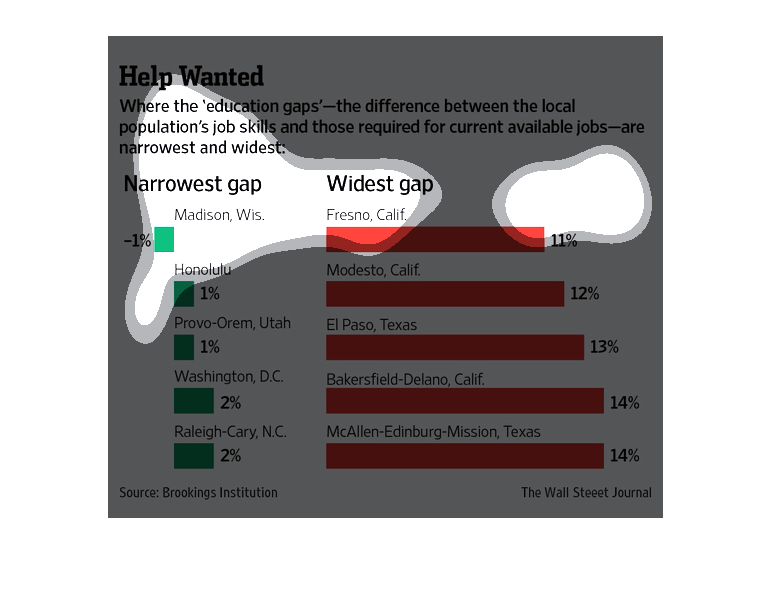
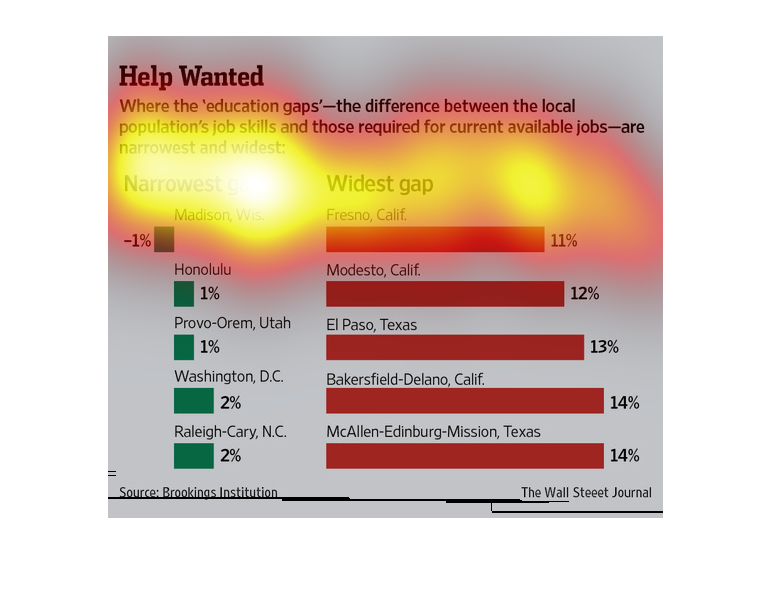
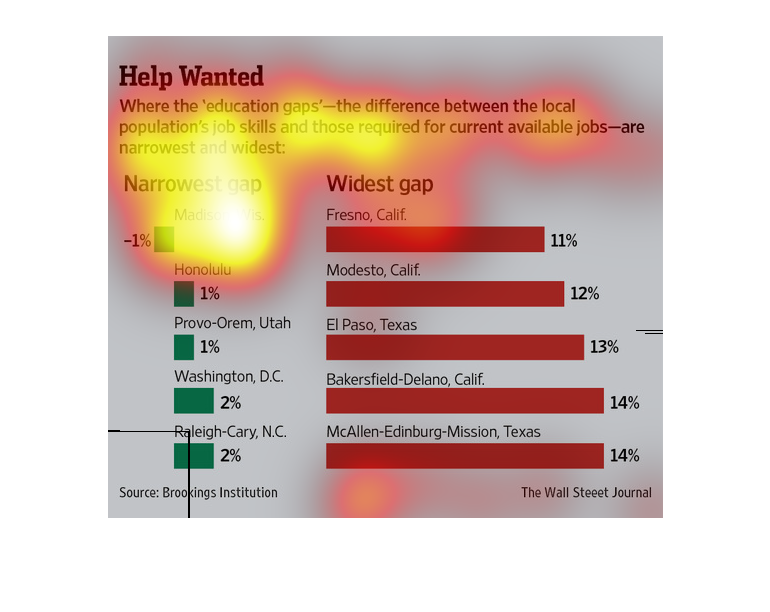
This graph is showing in which US cities that the education gap is the smallest and largest
difference required for available jobs. Madison, WI is showing the lowest gap while Raleigh-Cary,
NC is showing the largest gap.
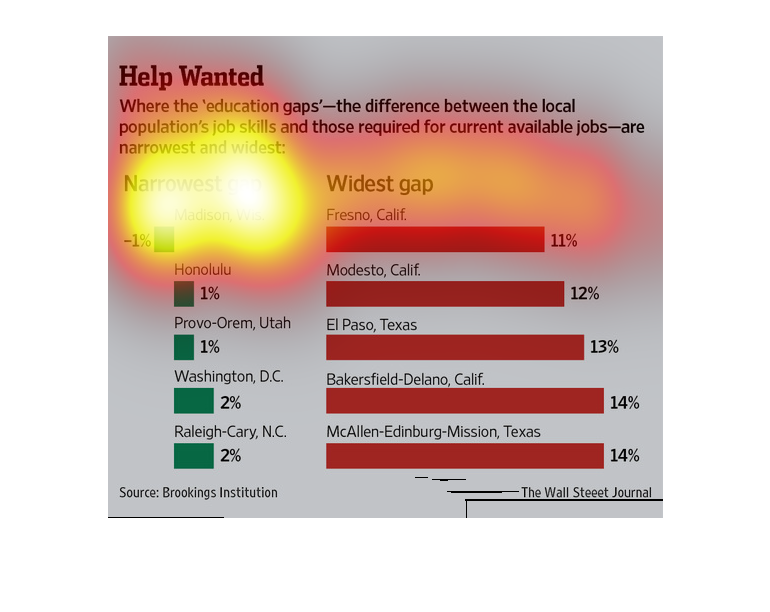
The image depicts education gaps, and the difference between the local population's job skills
and those required for current available jobs. data compares different cities in different
states in the US, with the widest gap, in percentages, present in Raleigh-North Carolina and
Washington, DC. The narrowest gap is in Madison, Wisconsin.
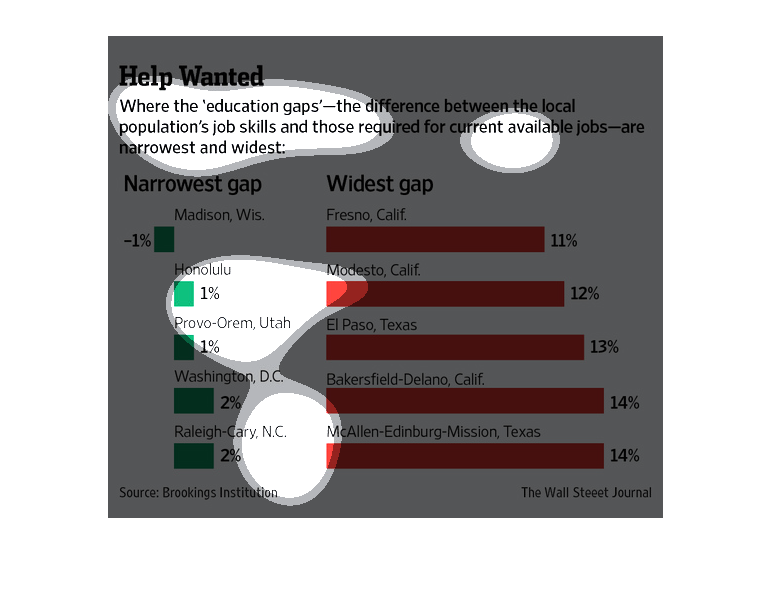
This is a series of bar graphs and related statistics depicting where the difference between
the local populations' job skills and those required for currently available jobs are narrowest
and widest.
A graph called "Help Wanted" with red bars next to cities that have big Education Gaps. The
city with the highest gap is at the top and is Madison, Wisconsin.
This chart illustrates the difference between the local population's job skills and the requirement
of skills for available jobs in the area with cities of narrow and wide gaps illustrated.
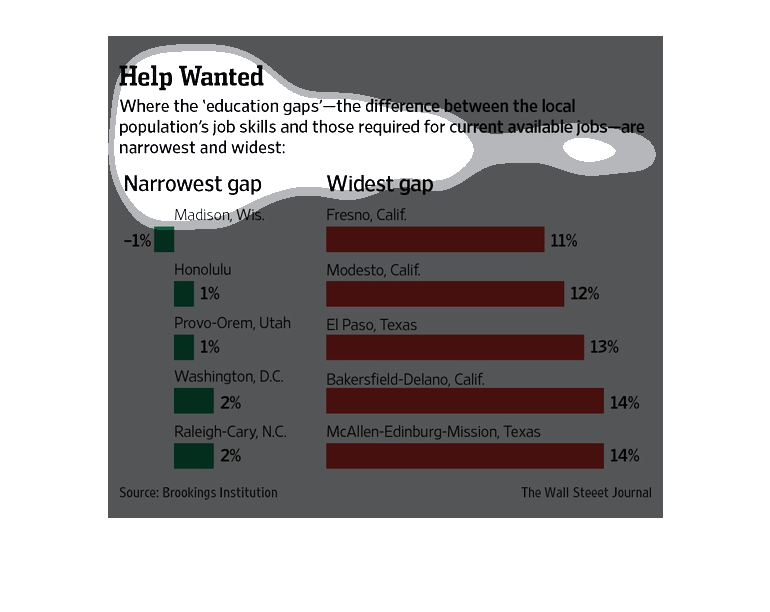
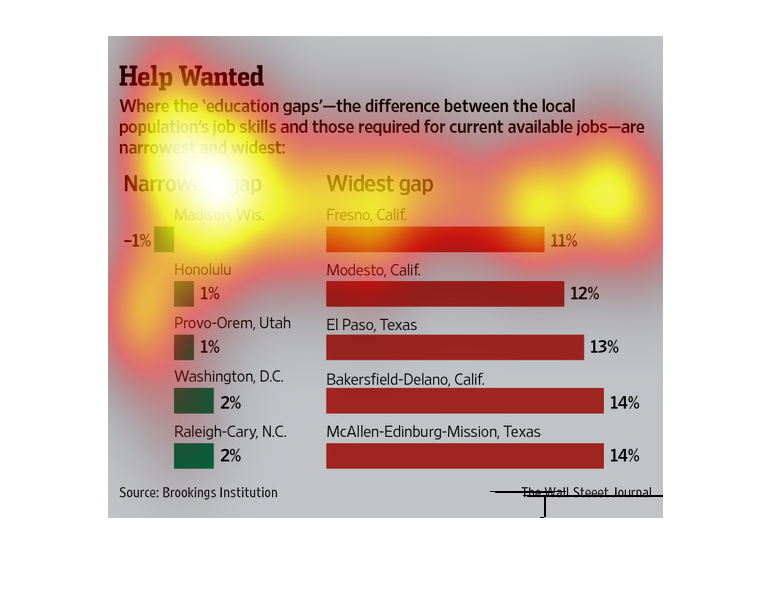
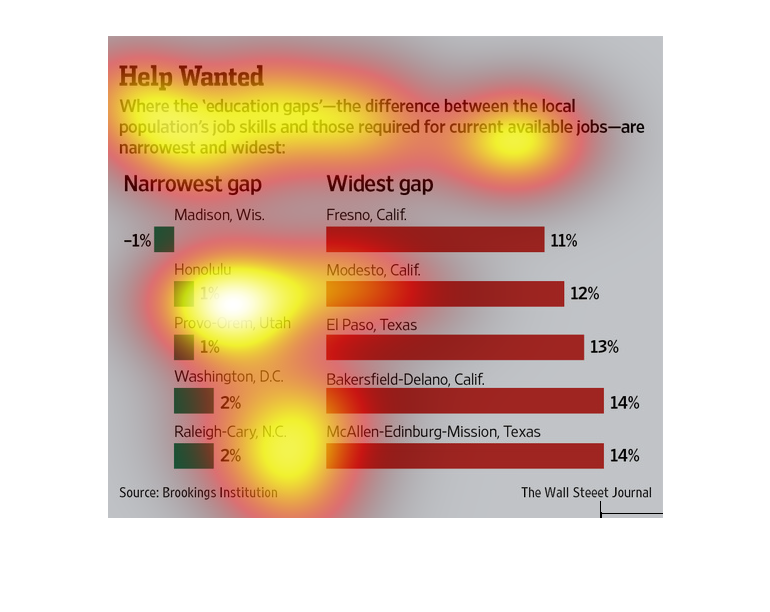
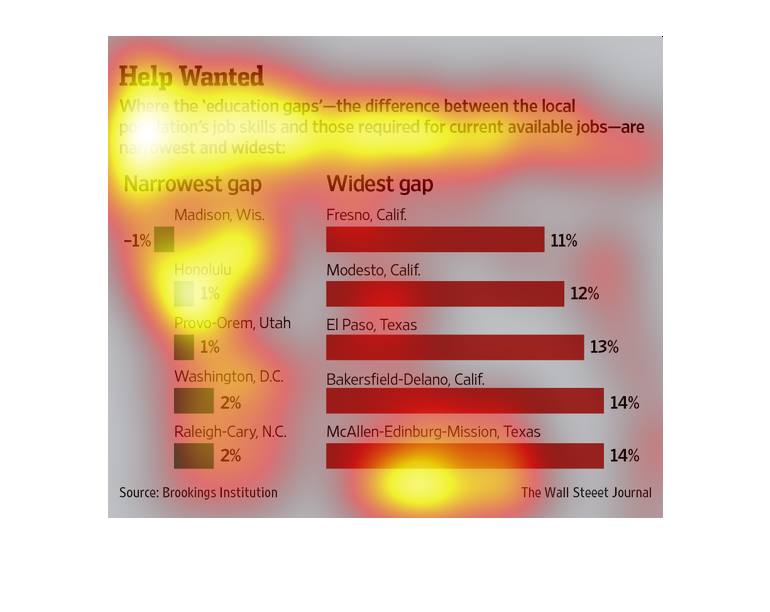
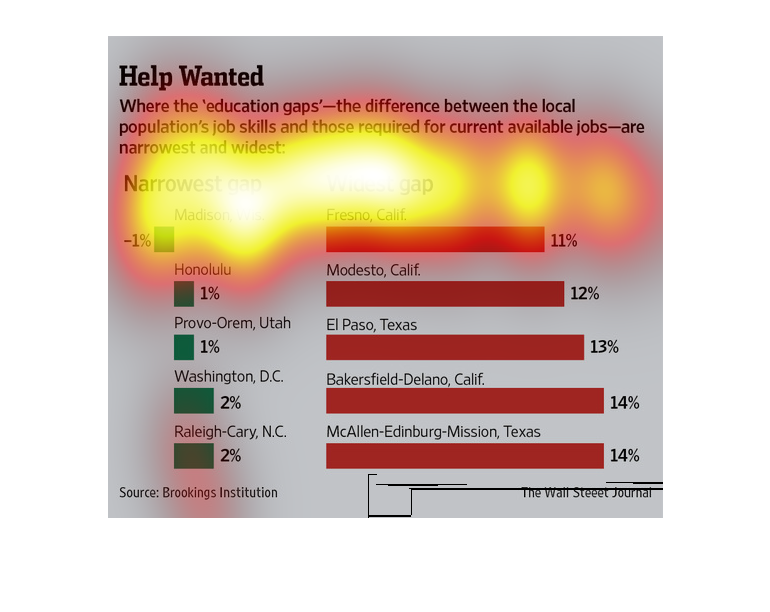
This is a graph showing the amount of "education gap" in different places in the US. The lowest
is in Madison, WI, with -1%, and the highest is in McAllen-Edinburg-Mission, Texas at 14%.
The graph shows areas in the United States where individuals seeking work have the skills
that most closely match the available work.  Madison, Wisconsin has the closest match of individuals
job skills compared to skills required for work.  McAllen-Edinburg-Mission, Texas has the
largest gap of skills available compared to skills needed by employers seeking workers.
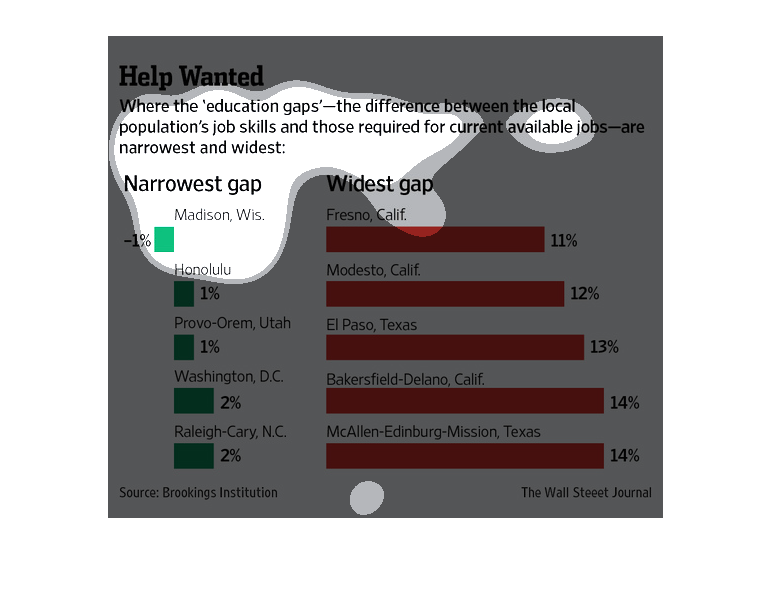
This chart describes the education gap where the skills for a job and an education are the
widest and narrowest in the US. The narrowest locations are Madison, Wis with a -1%, Honolulu
with 1%, Provo-Orim Utah with 1%, Washington DC with 2%, and Raleigh-Cary N.C.with 2%. The
Widest gap is Fresno, Calif. with 11%, Modesto, Calif. with 12%, El Paso Tex. with 13%, Bakersfield-Delano,
Calif. 14%, and Mcallin-Edinburg-Misson, Tex. having the highest with 14%.
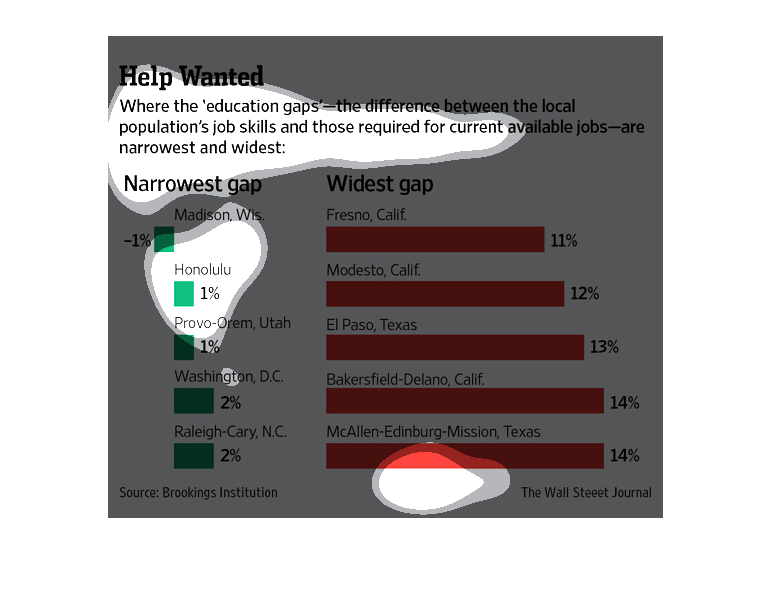
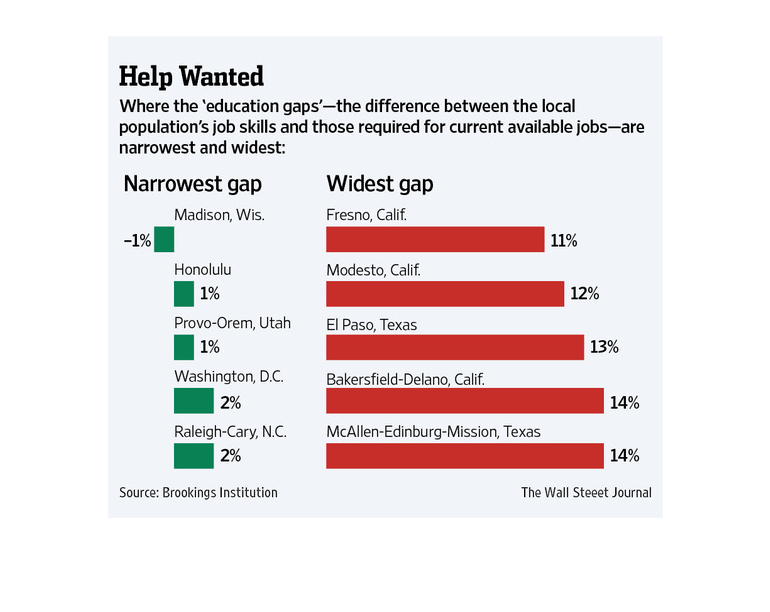
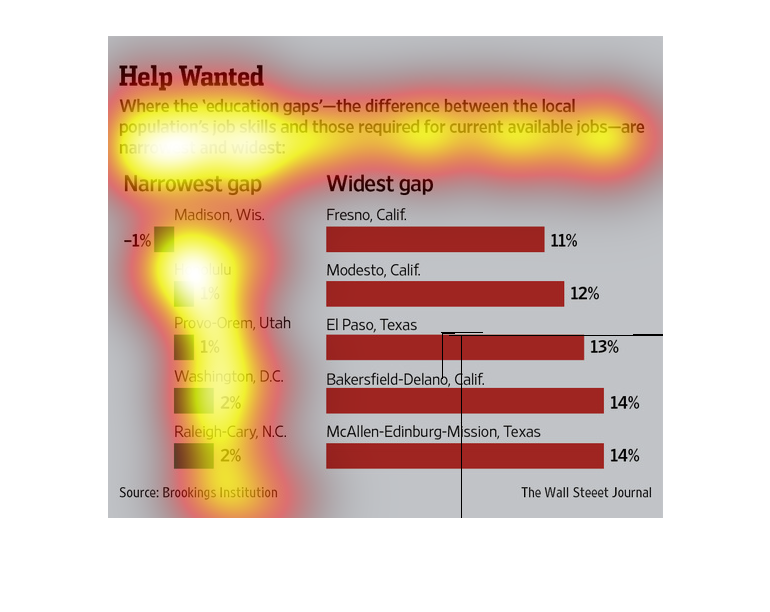
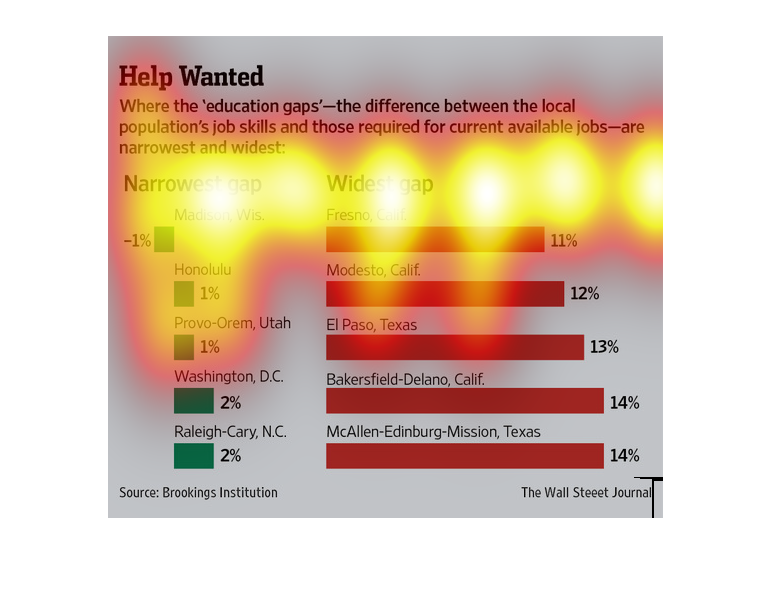
This chart describes help wanted. Specifically, where the "education gaps" - the difference
between the local population's job skills and those required for current available jobs.
This is a series of bar graphs depicting where the education gaps- the difference between
the local populations job skills and those required for current available jobs- are narrowest
and widest.
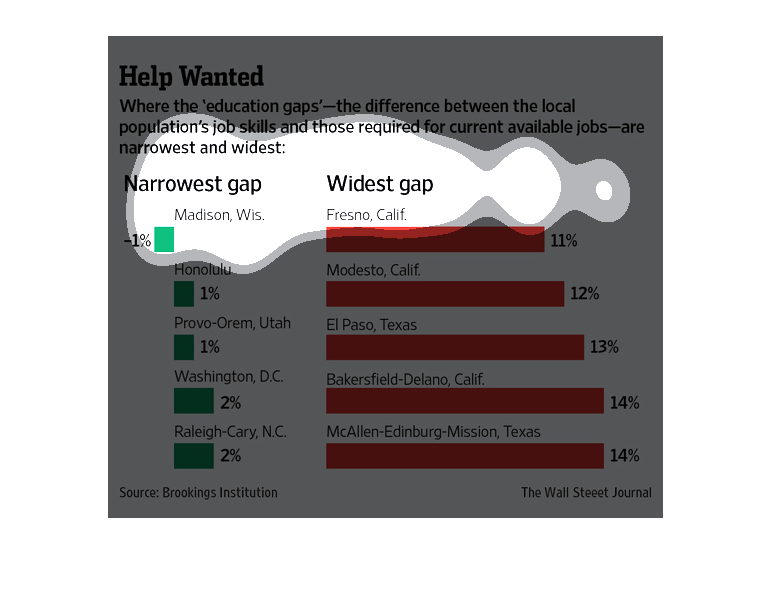
This chart compares the US cities where the education gap is the narrowest and widest. The
narrowest gap is in Madison Wisconsin, the widest is in McAllen TX.
This image shows or depicts in bar graph statistical format data concerning the largest and
narrowest gaps of education required to for certain types of jobs.