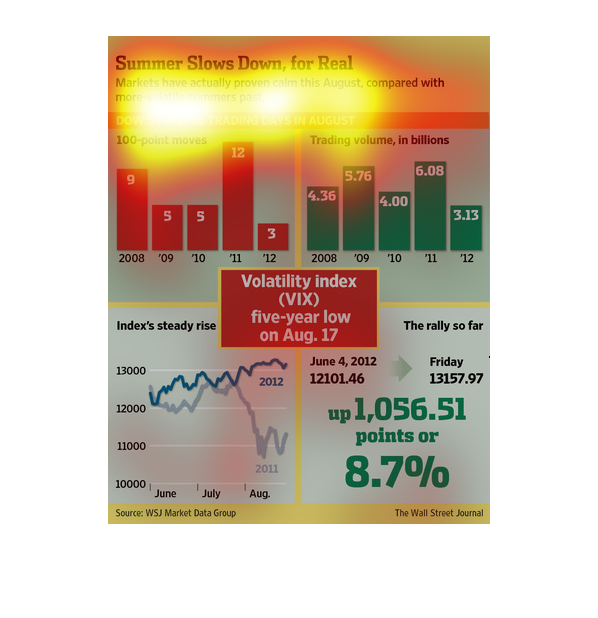
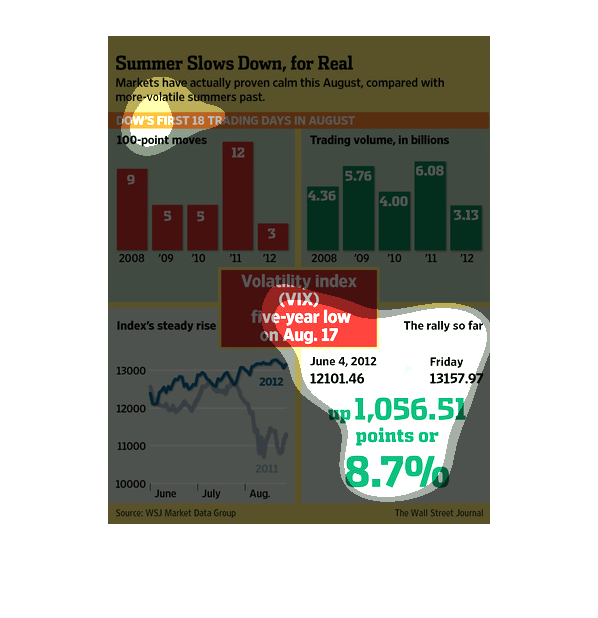
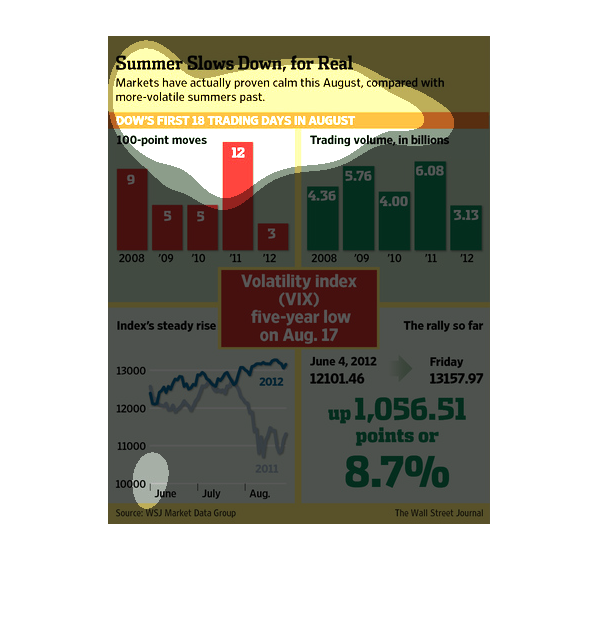
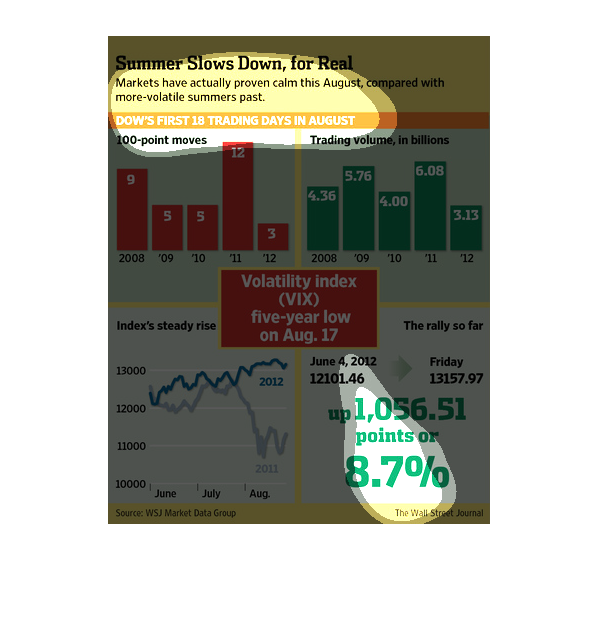
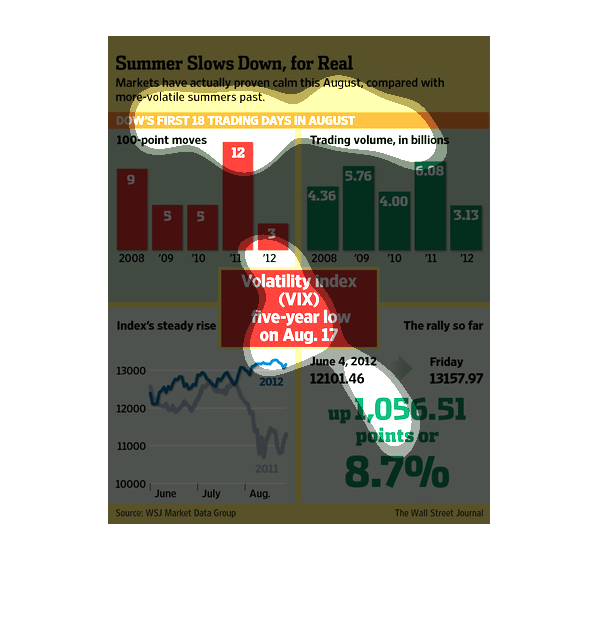
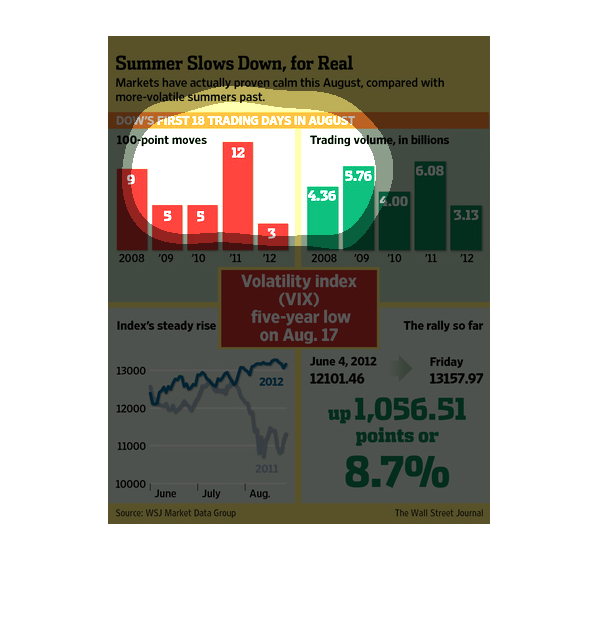
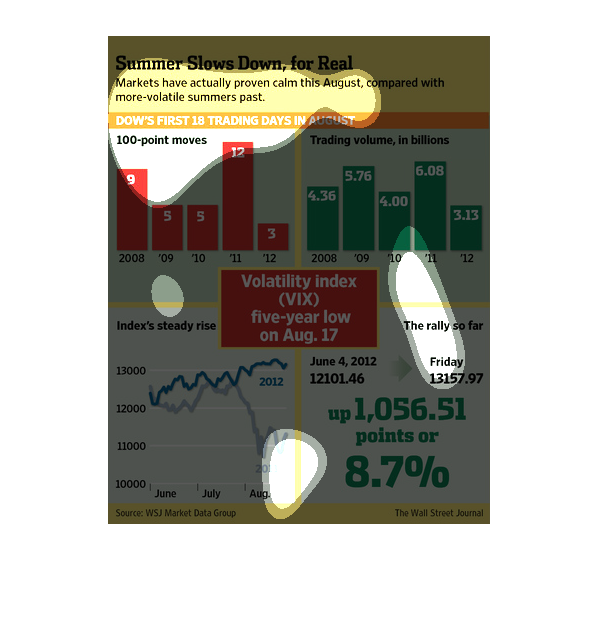
This chart describes summer slows down, for real. Specifically, markets have actually proven
calm this August, compared with more-volatile summers past.
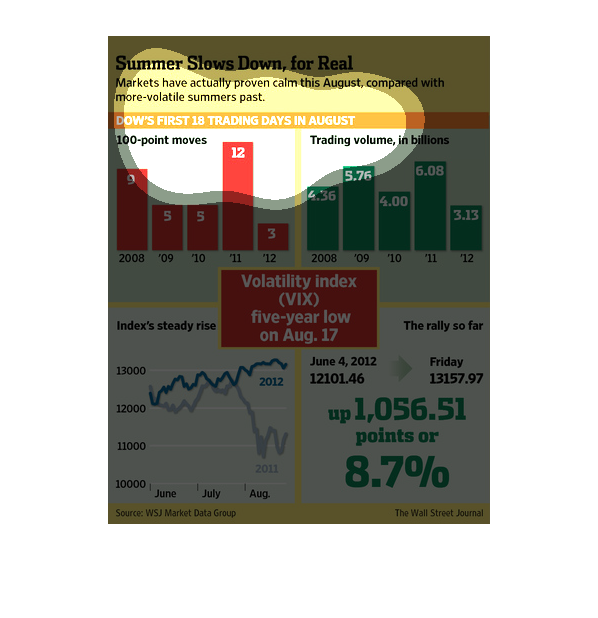
This graph shows the volatility of the stock market in years past compared to this summer
(2012) The market has shown to be less volatile by a wide margin.  High of 6.08 in 2011 and
low of 3.13 in 2012.
This image shows several graphs which prove that the stock market, during the summer of 2012,
has drastically slowed down, compared to previous years. The volatility index is currently
the lowest it's been in five years time, and the rally so far has gone up 8.7%.
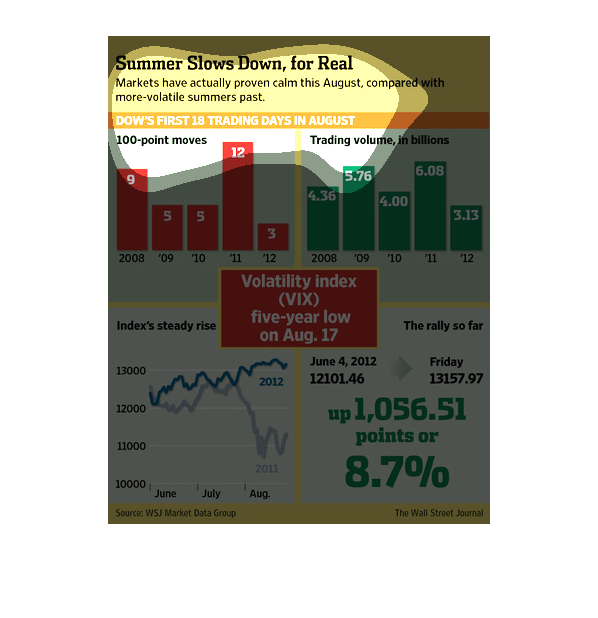
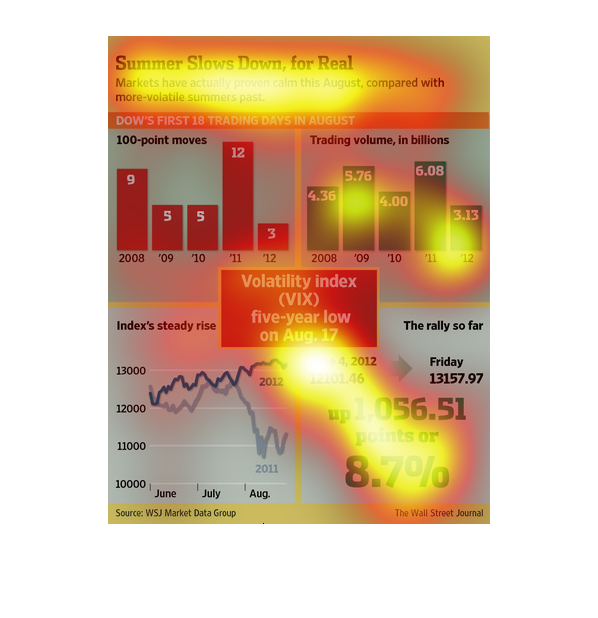
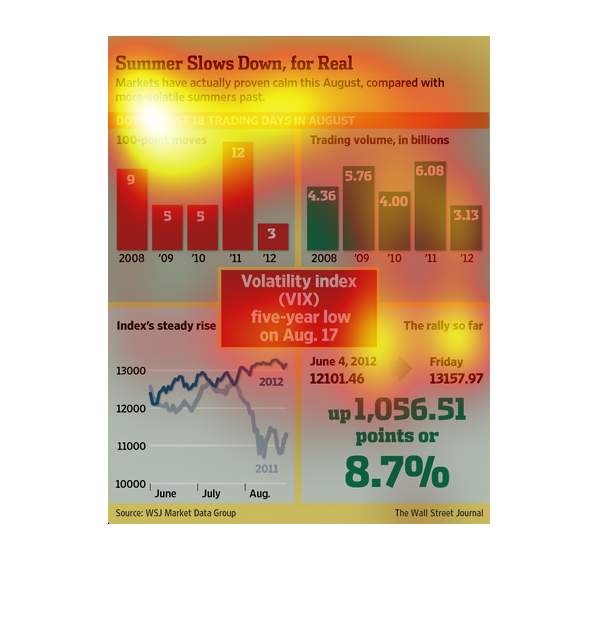
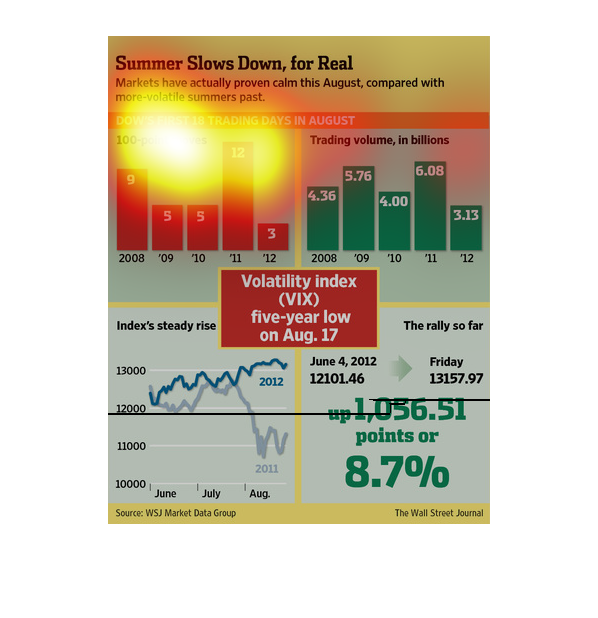
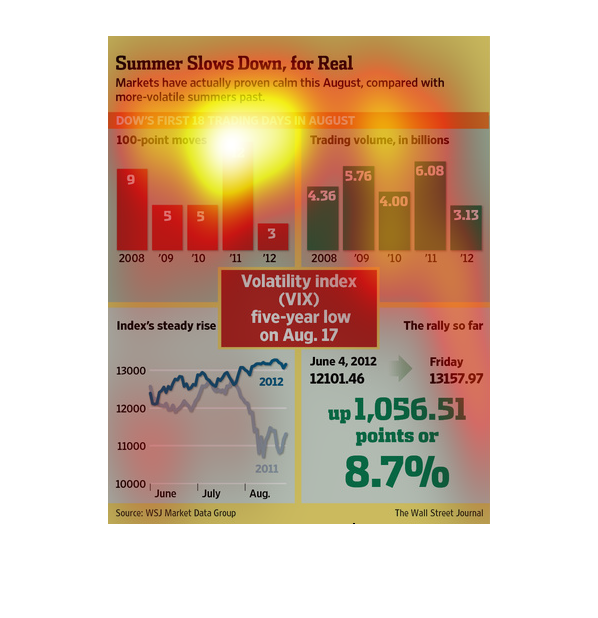
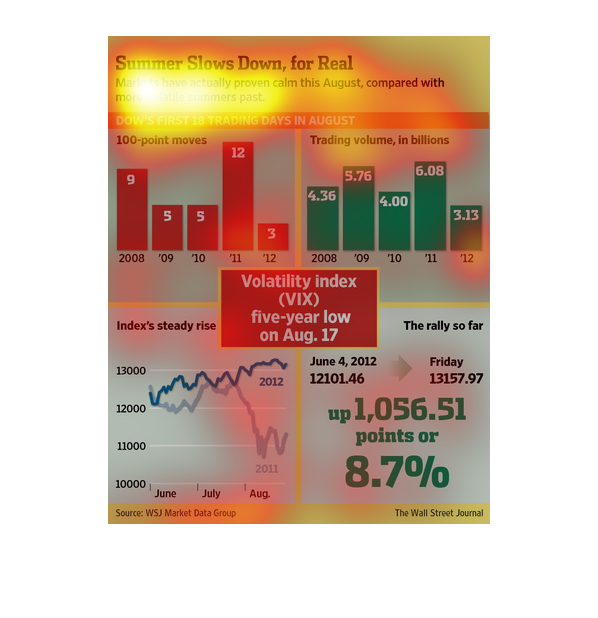
This chart describes summer slows down, for real. Specifically, markets have actually proven
calm this August, compared with more volatile summers past.
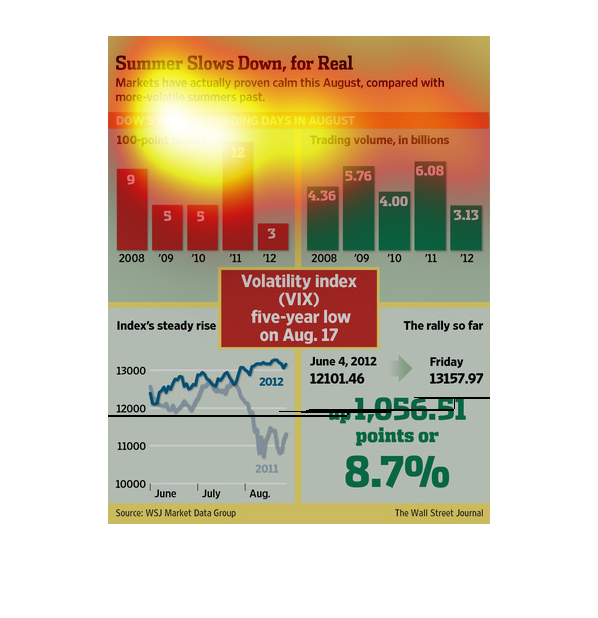
This is a graph of the productivity of markets. The data shows that markets have actually
slowed down this August, in a stark contrast to summers past.
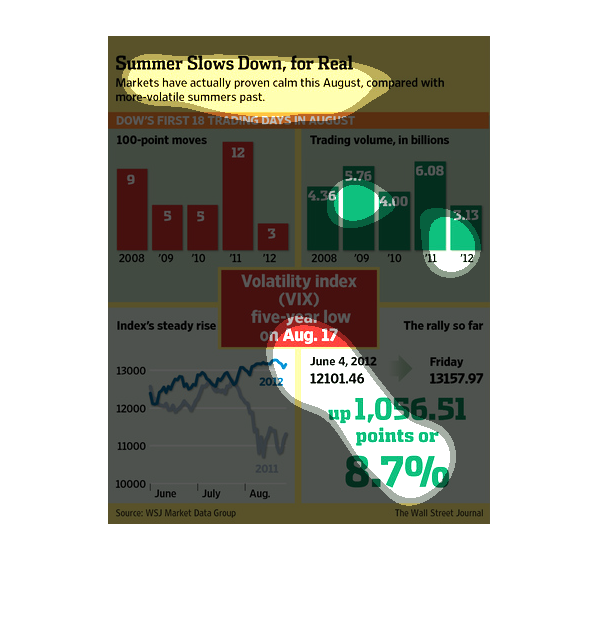
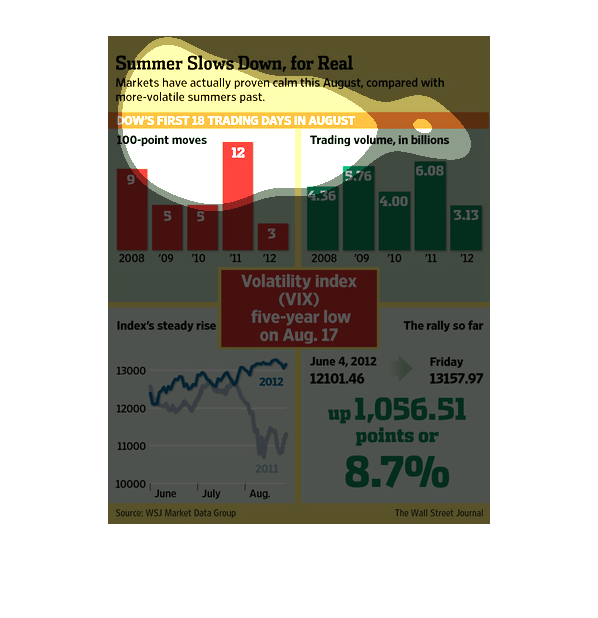
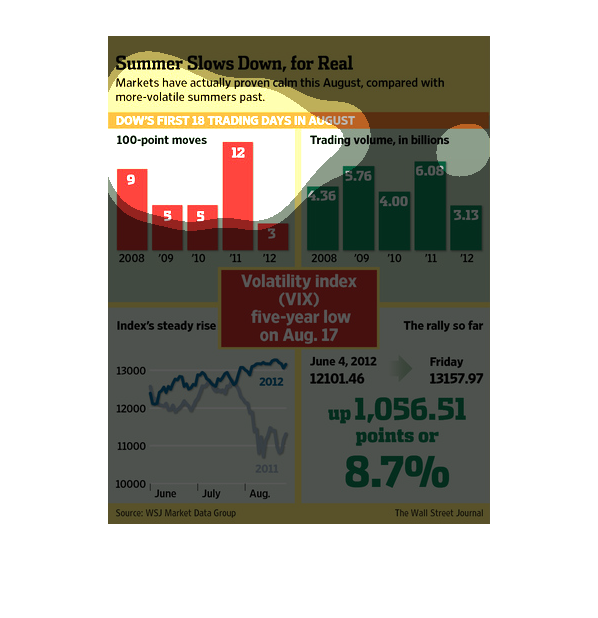
This chart is titled: Summer slows down for real. It shows that markets have actually proven
calm this August, compared with more volatile summers of the past.
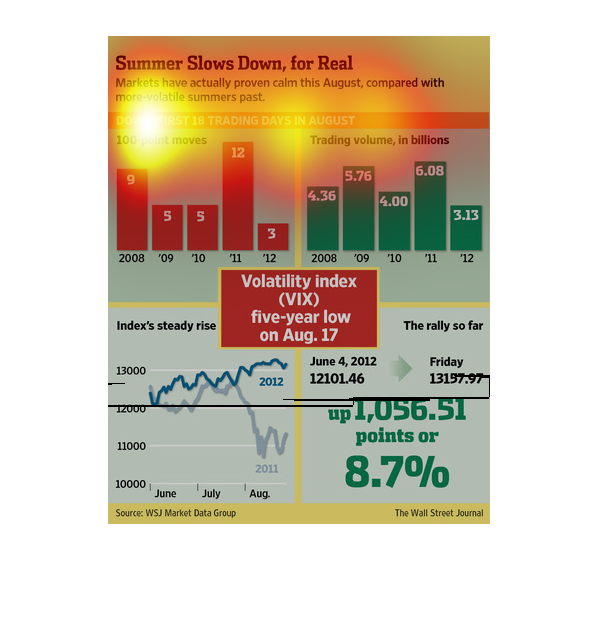
This shows how stock markets have slowed down this summer compared to previous summers. The
market has been less volatile than previously, and is up 8.7%
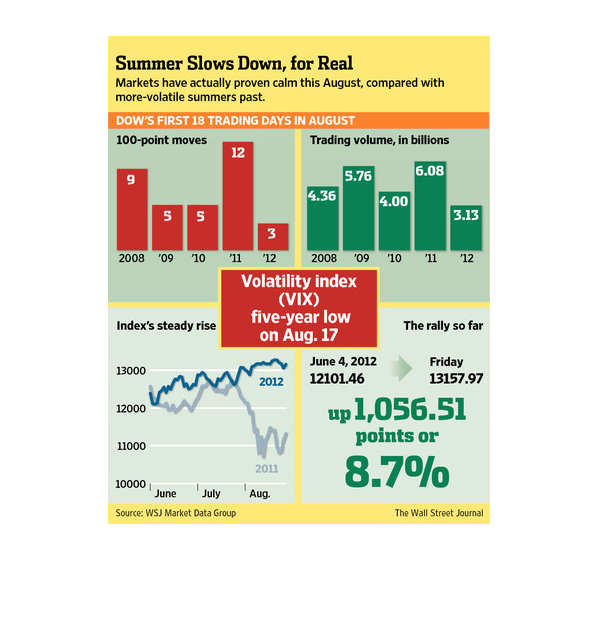
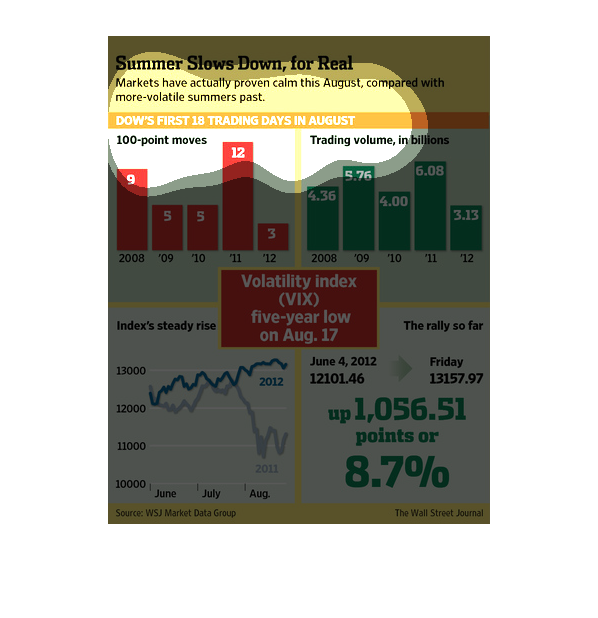
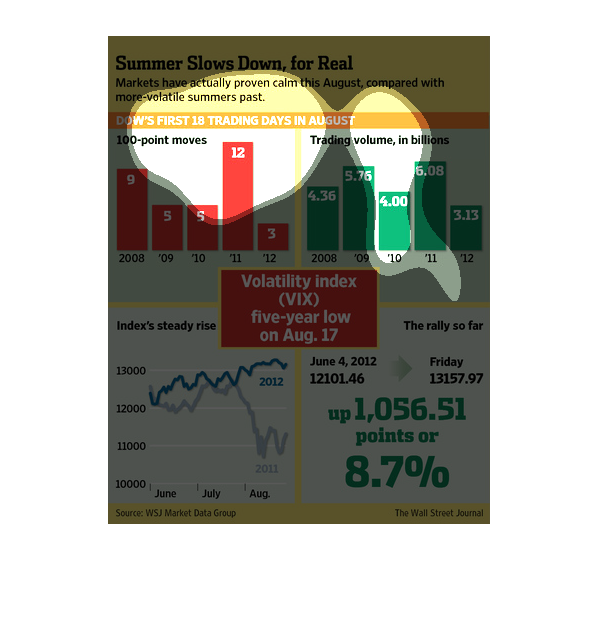
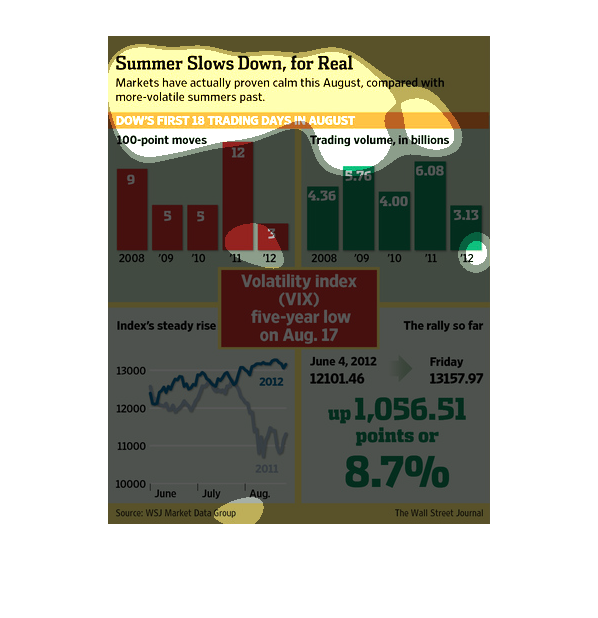
Summer sometimes decreases activity of the DOW stock exchange. In 2009 and 2009, volatility
and trading activity was high in the summer years, but in other years activity decreased in
the summer months.
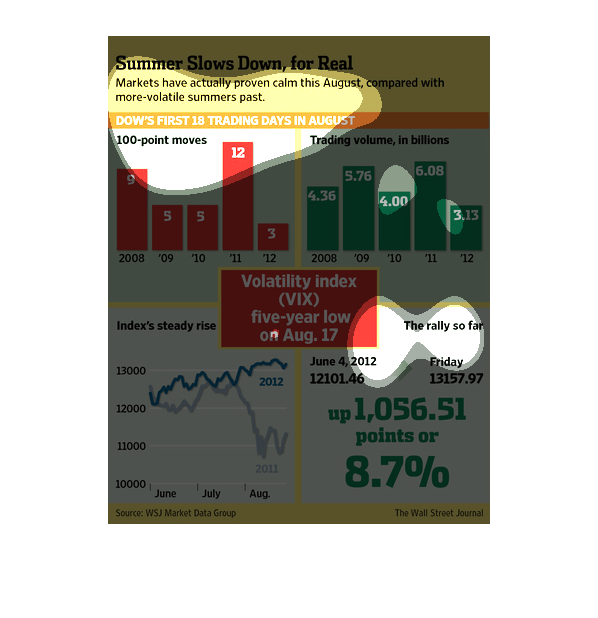
The image depicts how markets appeared to have stayed calm in August compared to more volatile
summer fluctuations. Trading volume appeared stable, as well as point fluctuation appearing
stable.
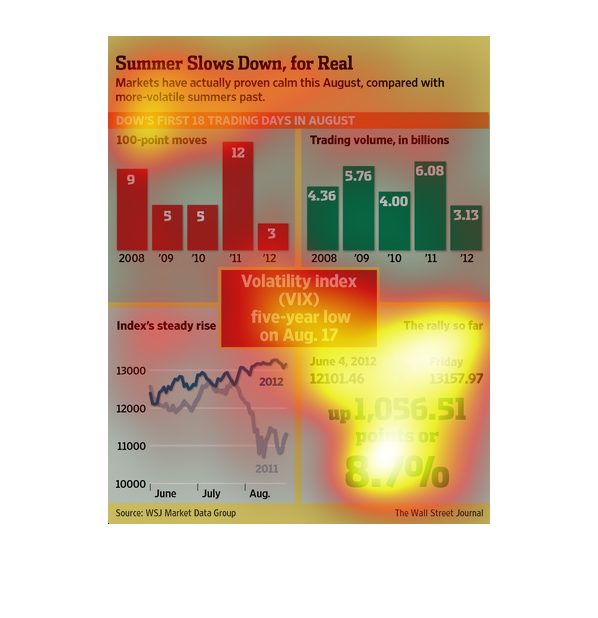
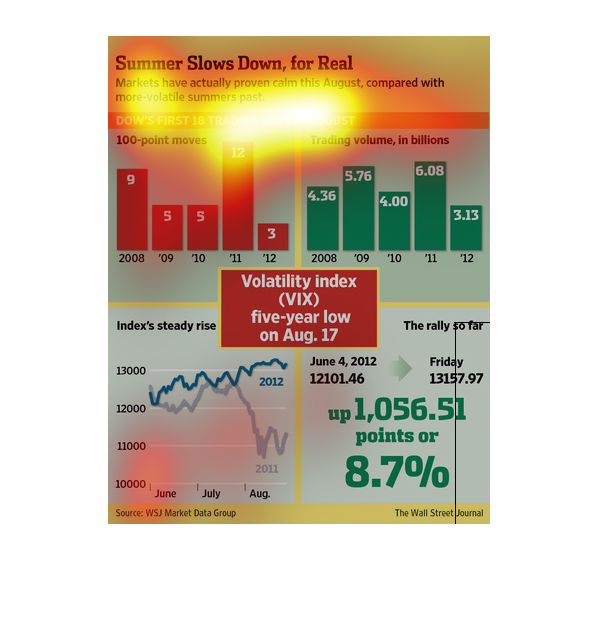
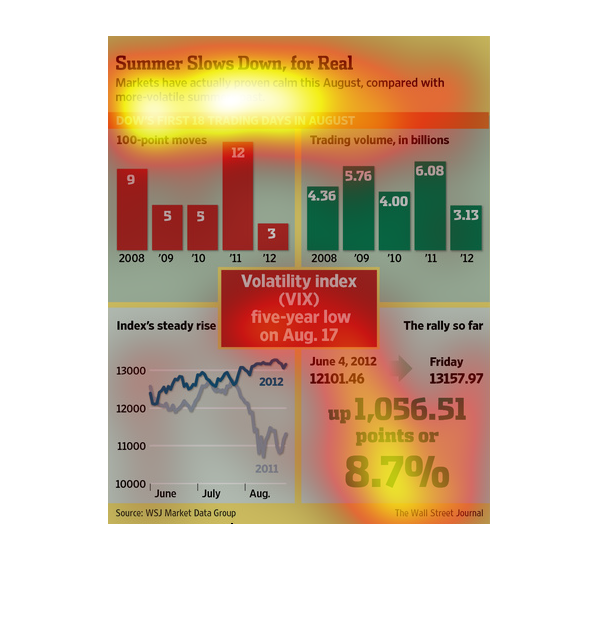
This is a series of charts and graphs with related statistics depicting that markets had actually
proven calm for that August compared with a summer volatile summer preceding it.
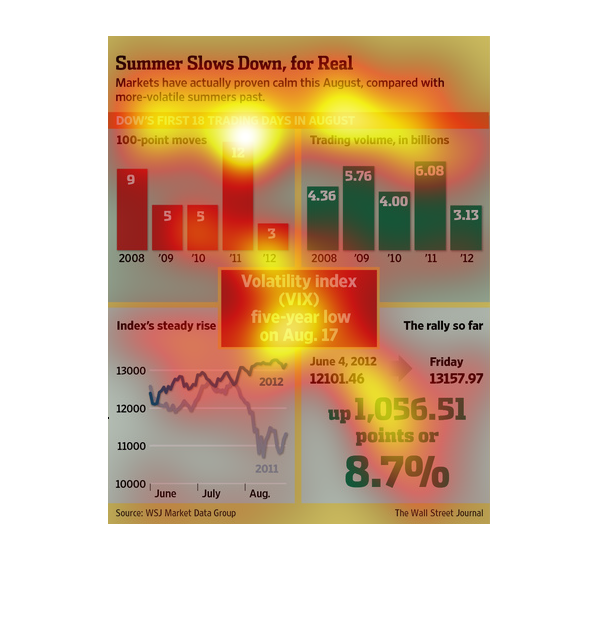
The image depicts how the markets have proven to be stable in the summer cited, as opposed
to recent historical norms of fluctuation during the summer, in Dow's first 18 days of trading
in August.
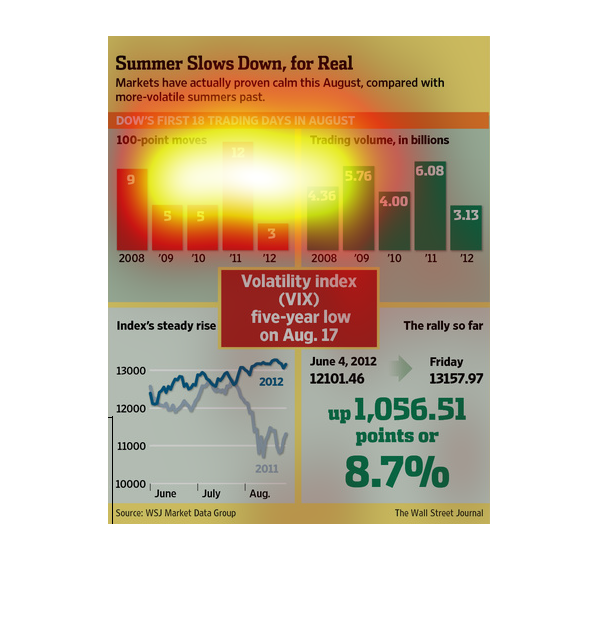
This graph shows how markets are very slow in this summer compared to previous summers. Almost
a three percent less trading volume from last summer, and 9 less 100 point moves in stocks.
Summer Slows Down for Real. Markets actually proven calm this august compared to more volatile
summer's passed. Graphs show the market rise and fall of years passed, with a five year low.
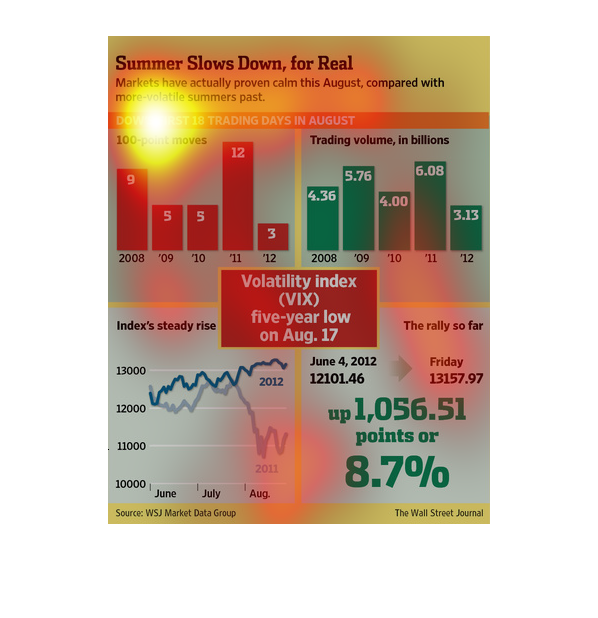
This chart compares the volatility of the stock market during the first 8 days of August for
the years  2008-20012. There have been far fewer 100 point moves in 2012 than in 2011. The
stock market also steadily rose in the summer of 2012 compared to 2011.
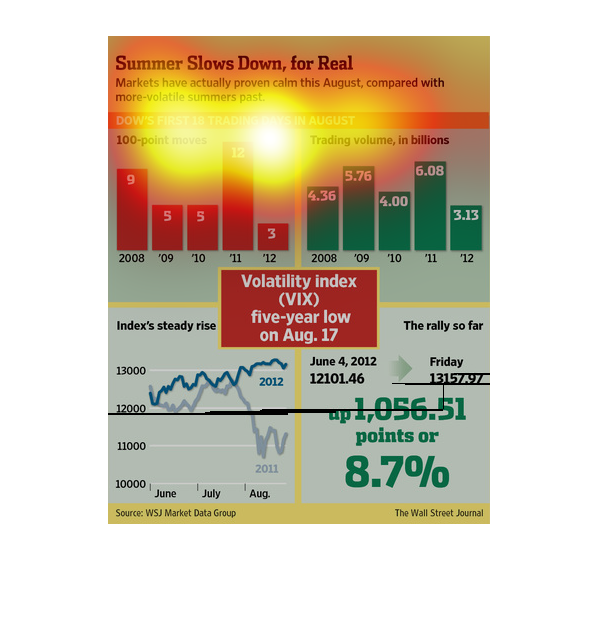
The image describes how some sort of market calms down in the summer time based on past summers.
It is describing the consumer/customer's buying habits and how, in the summer time, it becomes
less. It mentions the Dow company's trades.