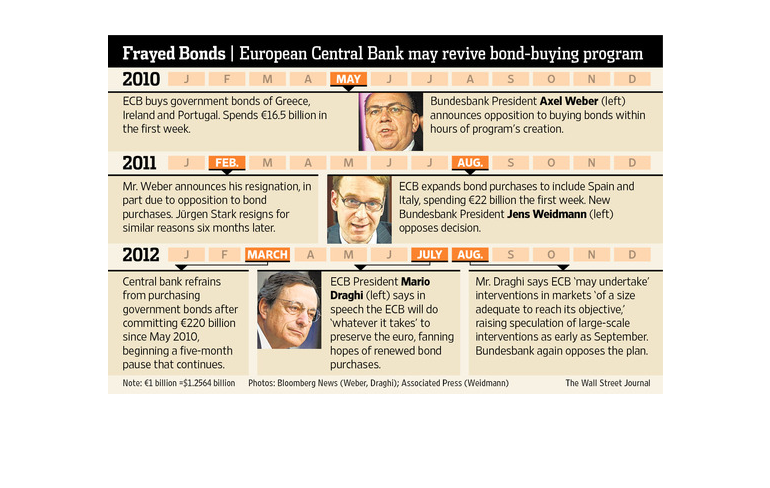
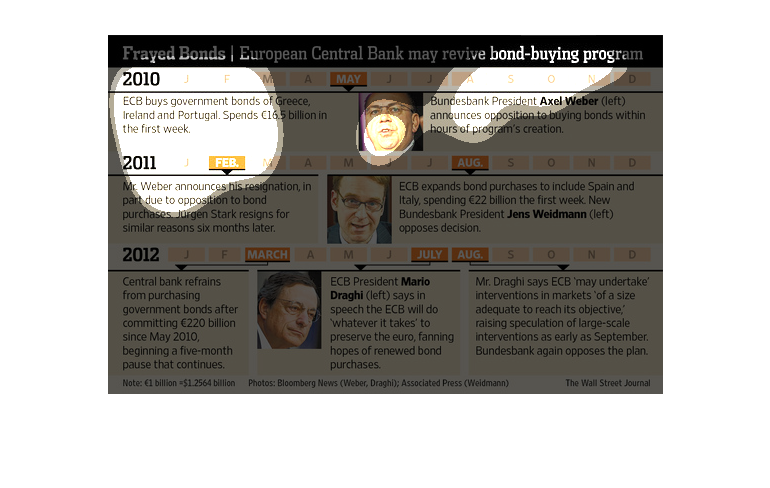
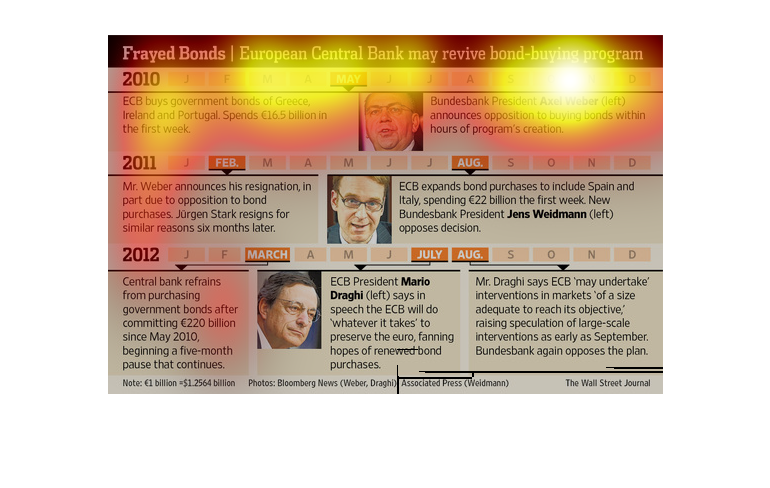
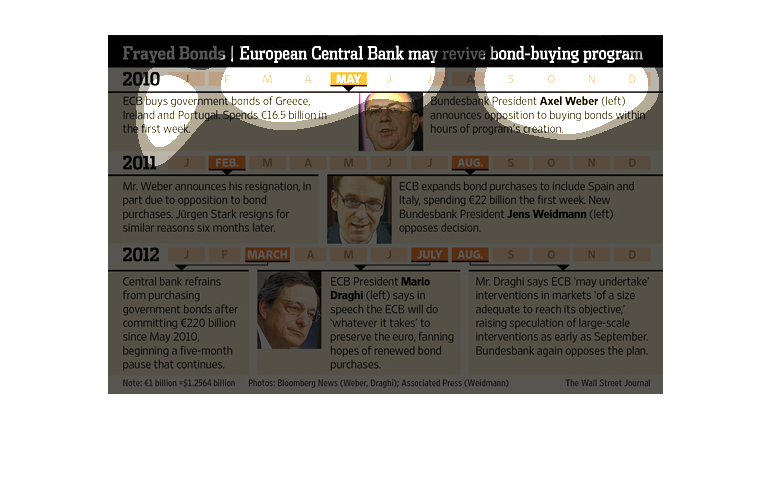
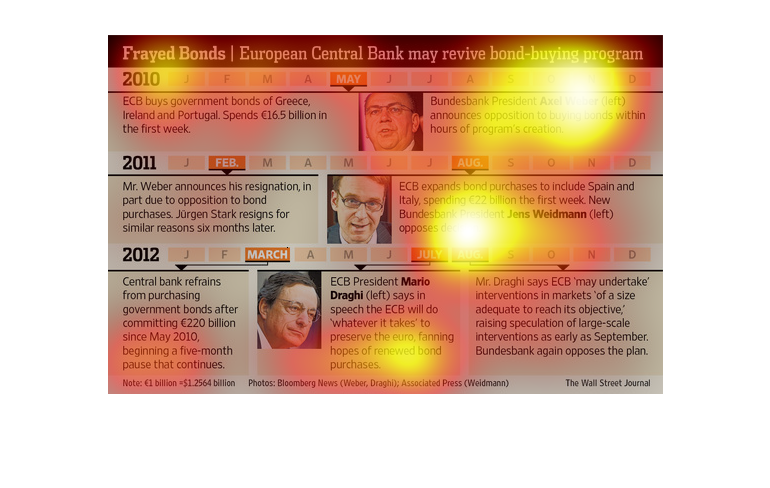
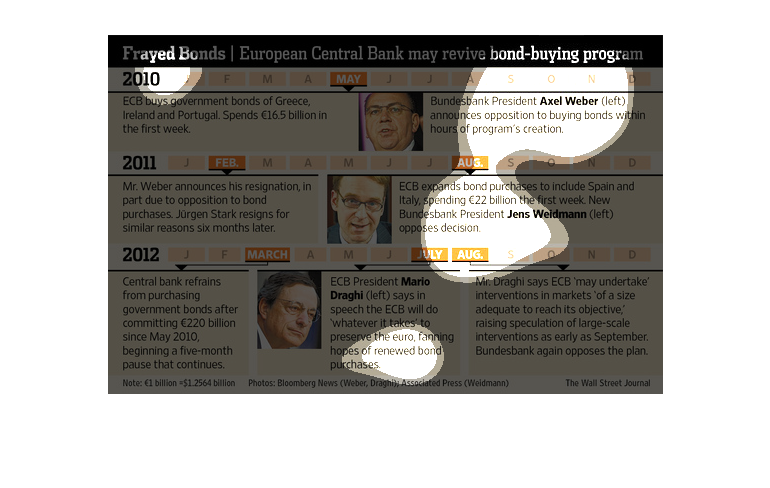
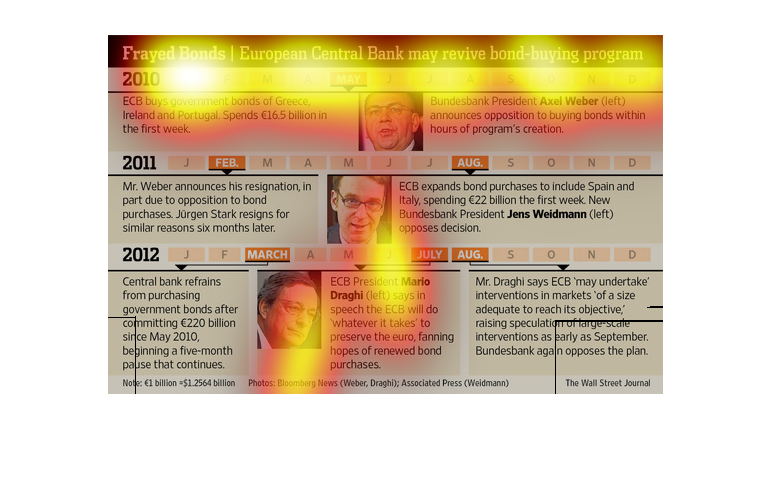
The image above shows a timeline of years 2011 and 2012 and shows the important events in
Europe that were related to the bond buying program in different countries.
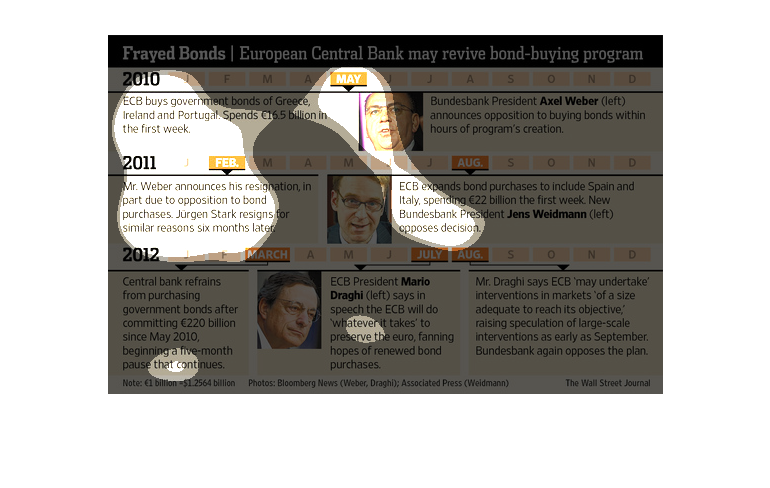
The image depicts how European Central bank may begin it's bond buying program once again.
With central banks injecting more money into European countries, the data indicates an effort
underway to re-stabilize the EU.
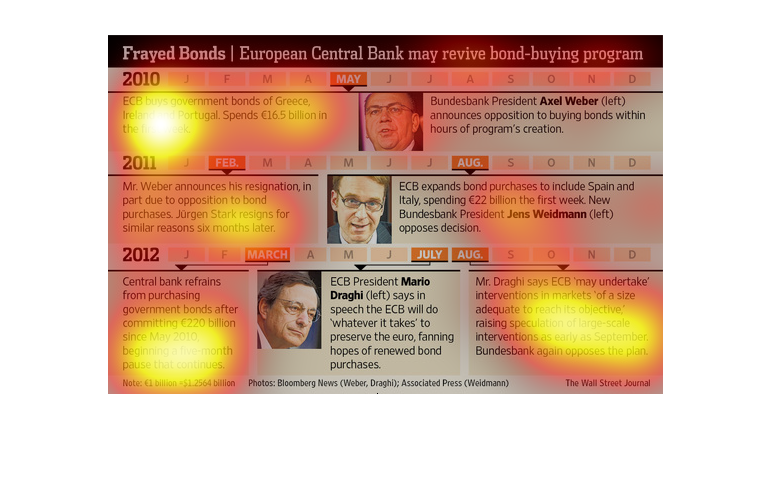
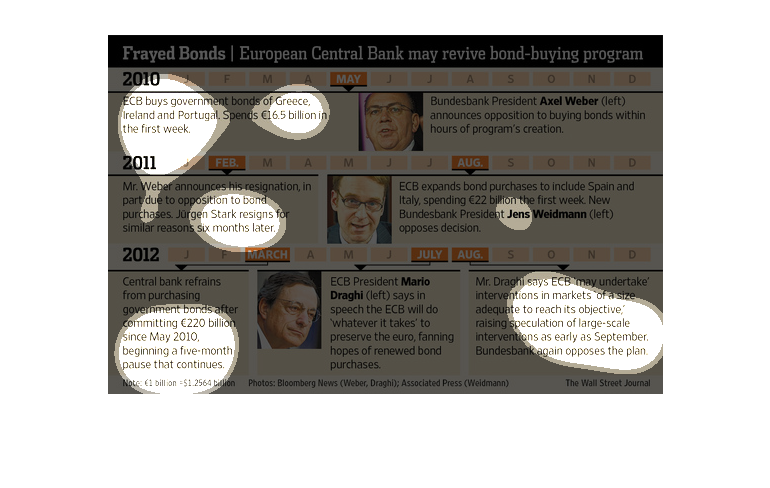
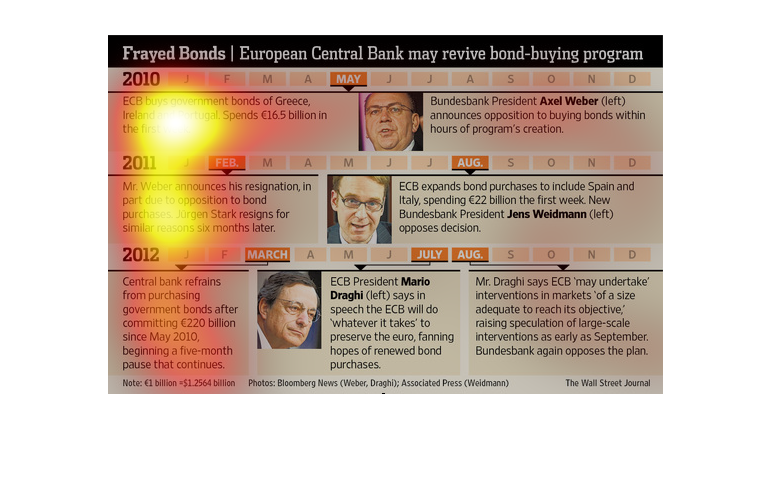
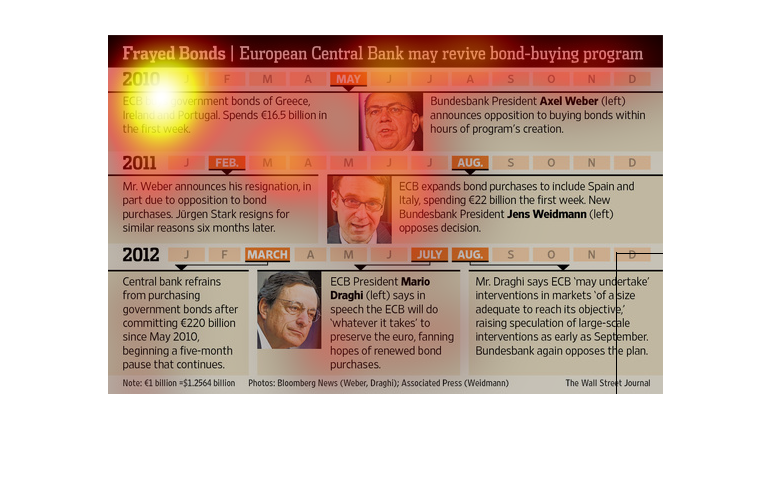
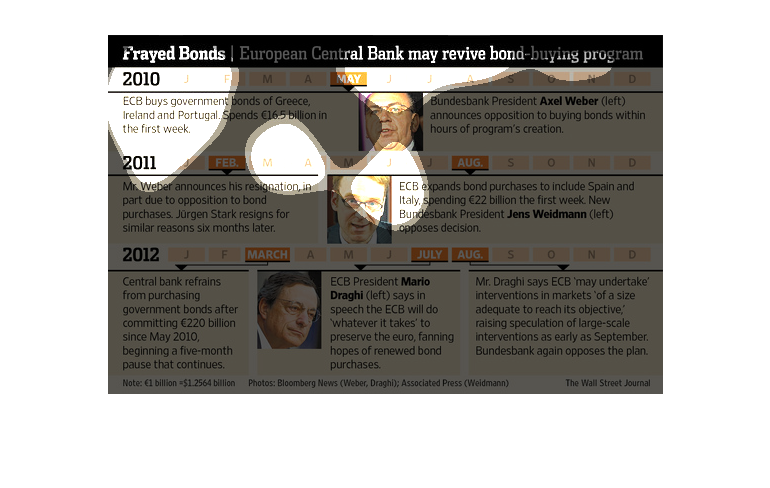
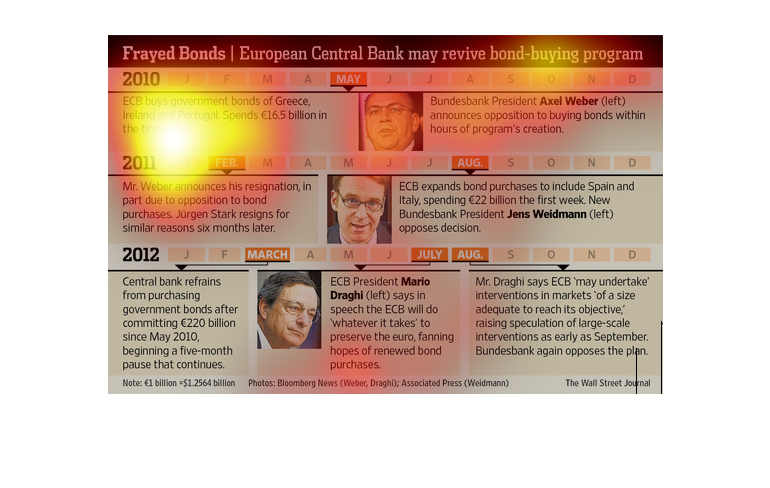
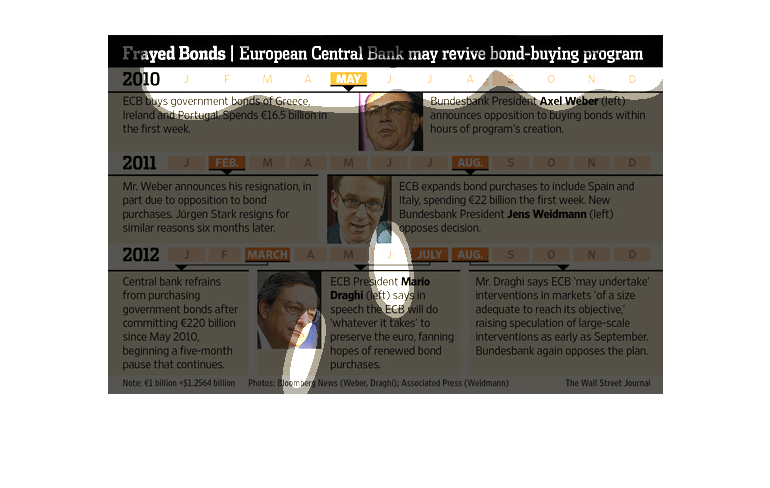
This is a series of statistics and a timeline depicting how the European Central Bank may
revive a bond buying program. The timeline begins in the year 2010.
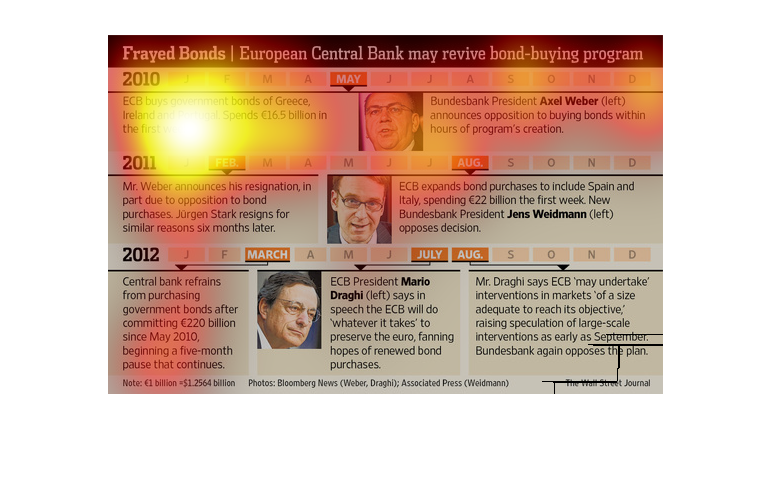
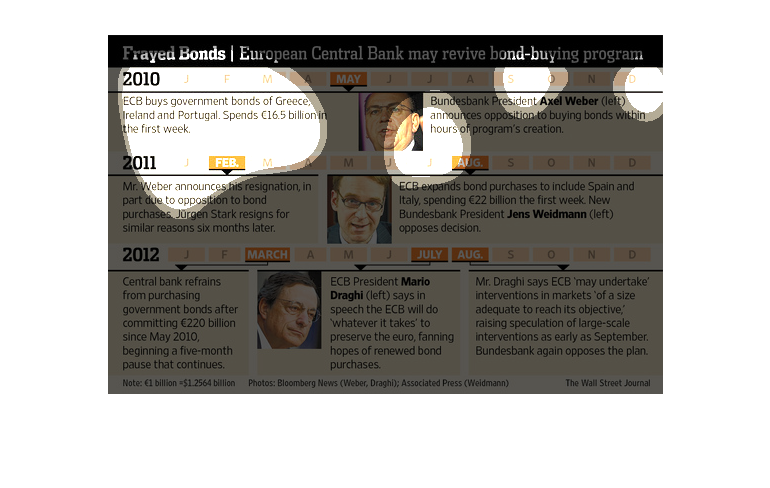
This chart shows a timetable of three years about the history of European Central Bank potentially
receiving a bond-buying program. The top chart is 2010, middle is 2011, and bottom is 2012.
The images show key players in the ECB.
The image depicts how the European Central Bank may renew the bond buying program. The bond
buying program is intended to stabilize the EU markets, and ensure that the Eurozone doesn't
get dragged back down and constrict.
This is a diagram/timeline depicting the possibility that the European Central Bank may revive
a bond buying program in order to stabilize the economy.
The following chart shows data on the European Central bank and there bond buying program.
Shows that they took adequate measures increasing their bond buying ensuring liquidity in
the markets.
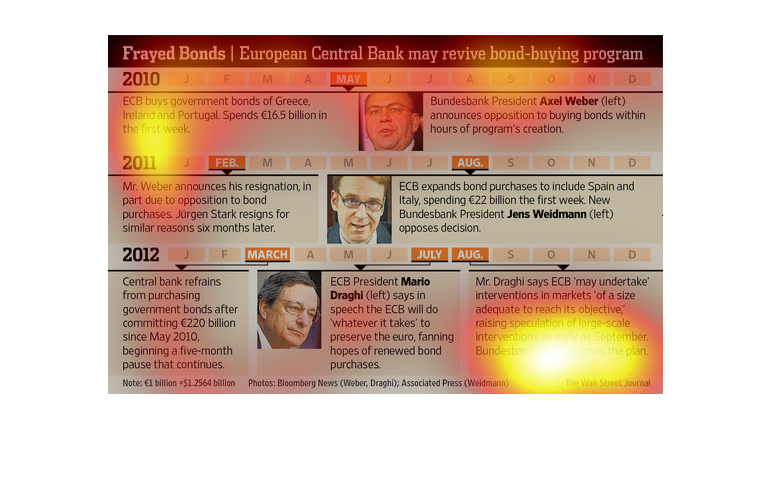
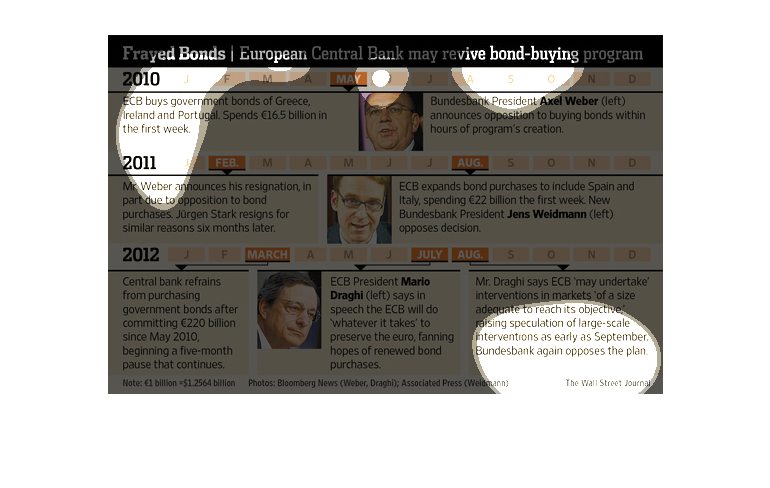
This chart describes frayed bonds. Specifically, European central bank may revive bond-buying
program. The chart contains several photographs to illustrate the points.
This is about bonds in the european market. It is a historical breakdown of the events that
lead to a particular economic event around the euro. It is broken down into months as well.
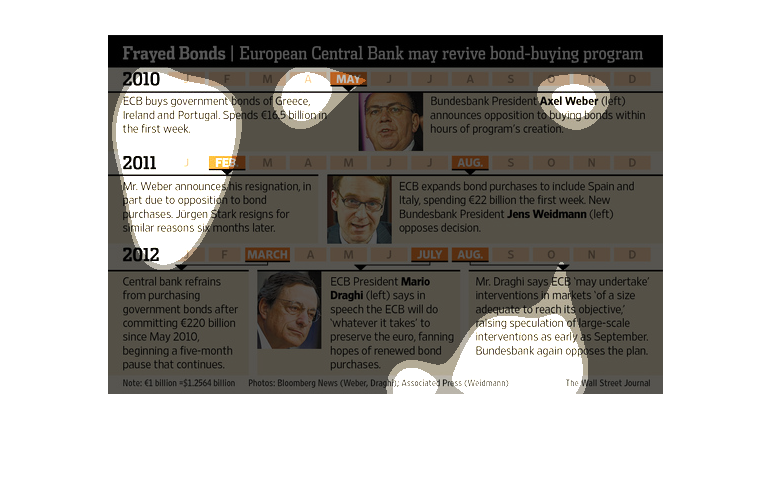
The image is titled "Frayed Bonds: European central bank may revive bond-buying program".
There are three smaller images in the center of the page with short statements on either side.
The events on the images are about Bundesbank President, Axel Weber.
This chart describes frayed bonds. Specifically, European central bank may revive bond-buying
program. Different categories are represented by photos.
This appears to be a graph showing the feasibility of a bond buy-back program the European
Central Bank may implement. The graphic is organized by dates and displays pictures of people
important to the program and describes their actions.
This chart/graph displays that European Central Bank may start to revive the bond/buying program.
It shows the time line up to date on all the decision that are made by the bank in accordance
to the revenue.
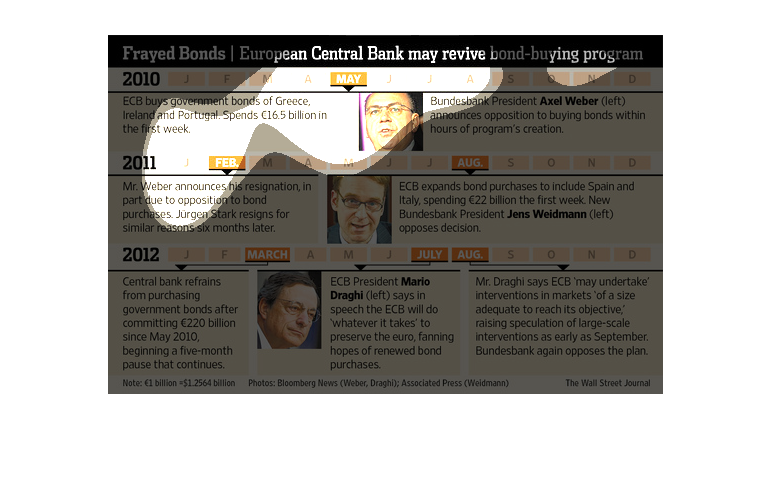
The following chart shows the events leading up to the European Central Bank buying bonds
in distressed countries such as Portugal, Spain and Greece.