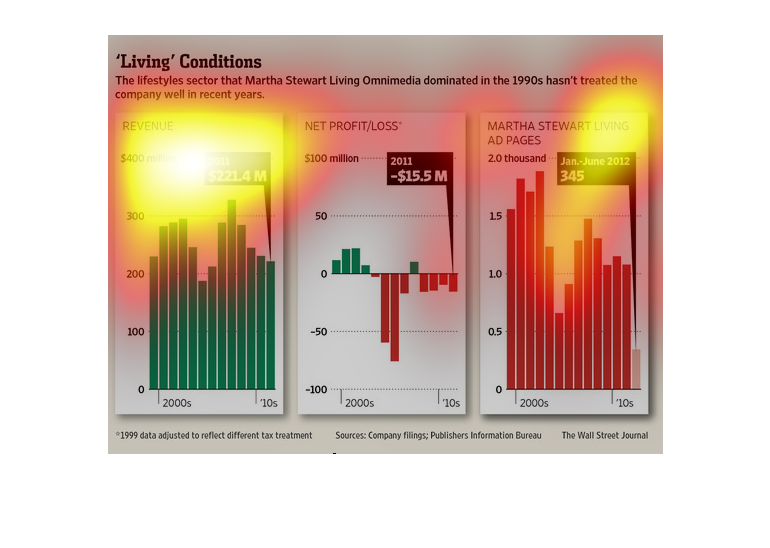
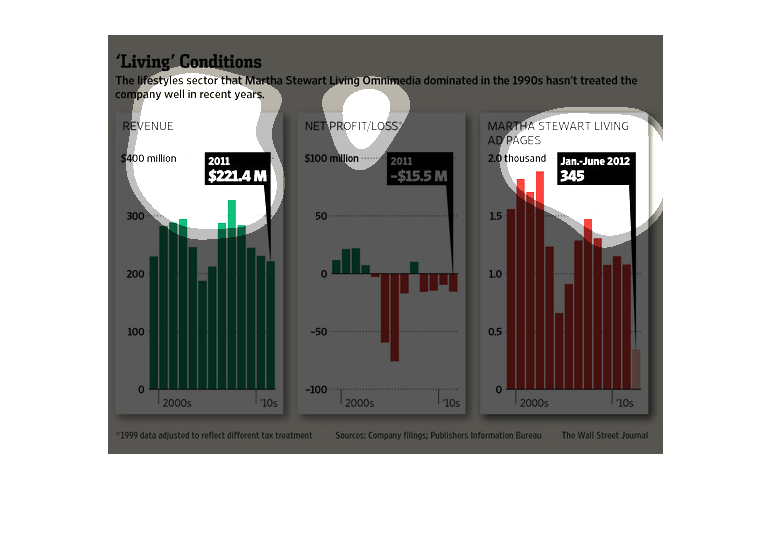
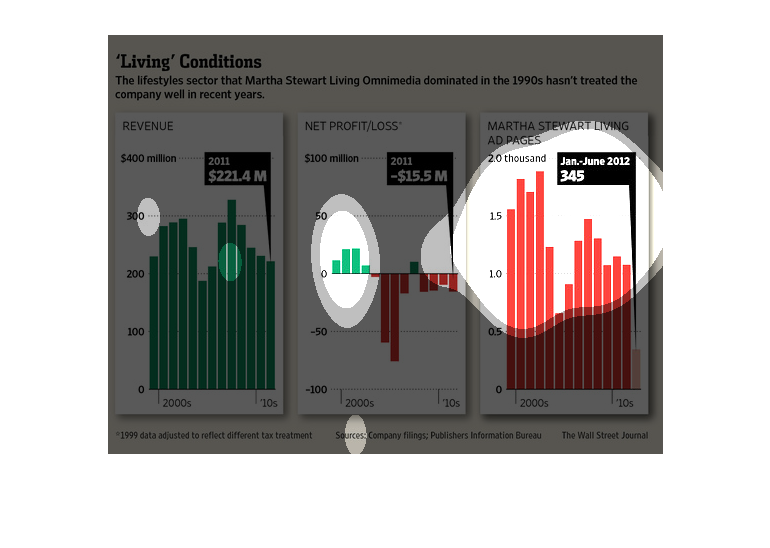
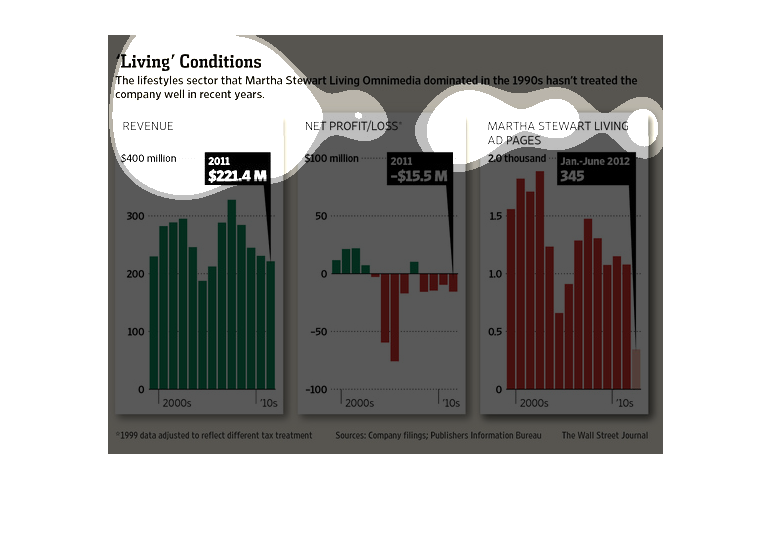
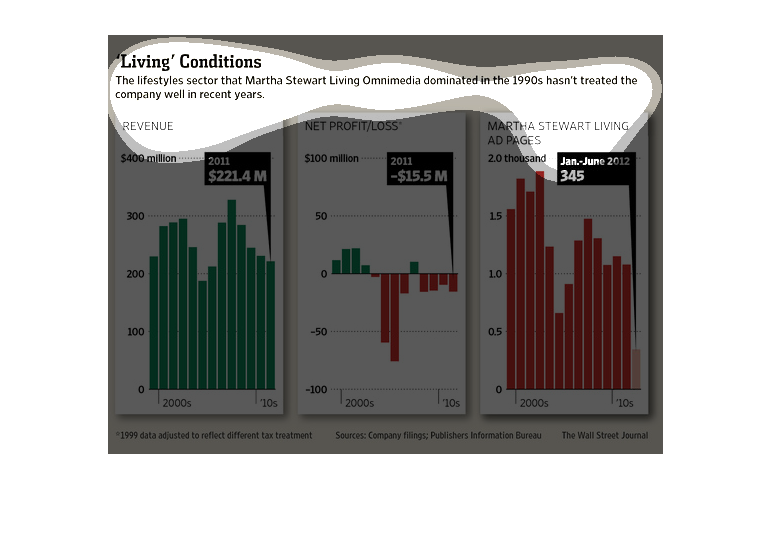
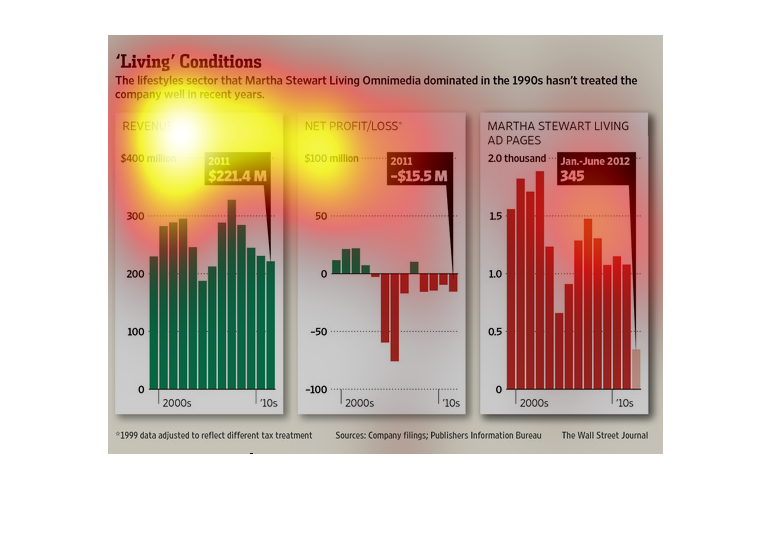
This chart depicts revenue, net profit/loss, and money spend on advertising from the 2000s
to 2010s. It claims the living sector hasn't treated Martha Stewart's company well.
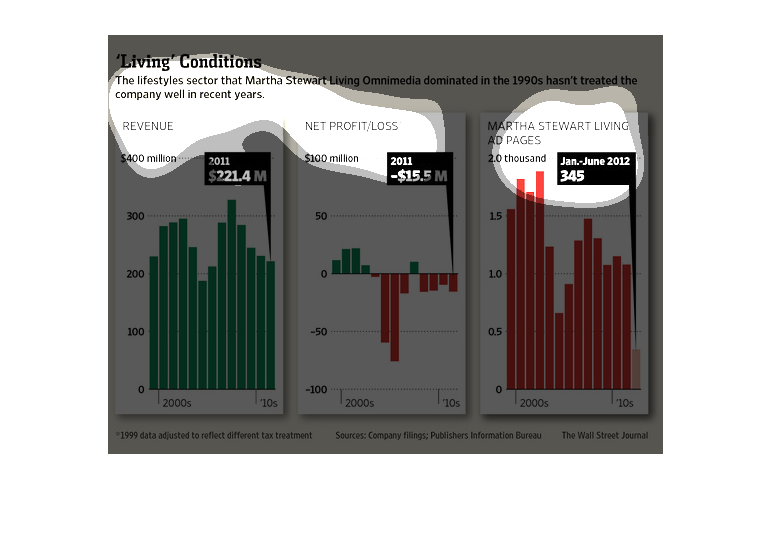
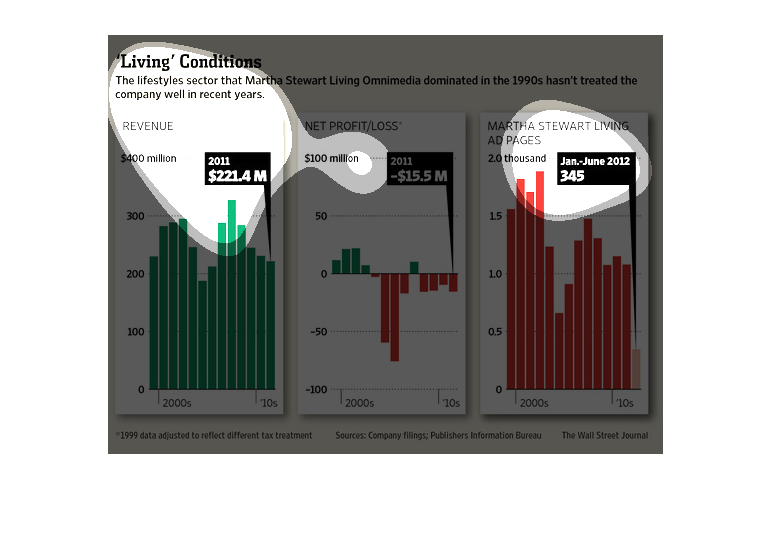
Graphs that show how the Martha Stewart Living Omnimedia has changed in relevance in the sector
since the 1990's. Profit has gone down and so have ad pages.
This chart details how the Martha Stewart Living company is doing in 2011 as compared to the
early 2000's. It had a total revenue of $221.4 million, for a net loss of $15.5 million. Ad
revenue for June and July 2012 for Martha Stewart Living was only $349, down from almost $2000
in the mid 2000's.
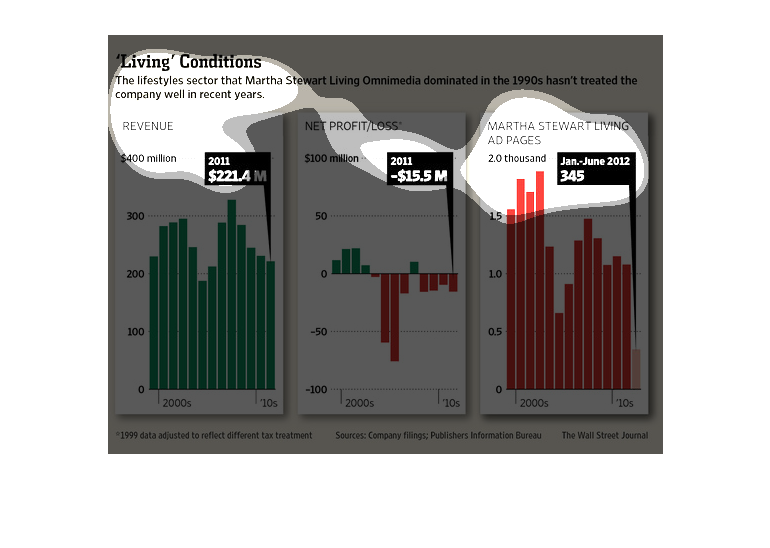
The graphs show the Gross Revenue, Net Profit, and number of Ad Pages in Martha Stewart Living
for the date ranges 2000 - 2010.  In the early 2000's,  revenue was high, along with ad pages
in the magazine, contributing to net profits.  During the mid 2000's all three suffered a
decline, accounting for the largest losses.  Although revenues and ad pages increased in the
later part of the decade, net profits have still been negative.
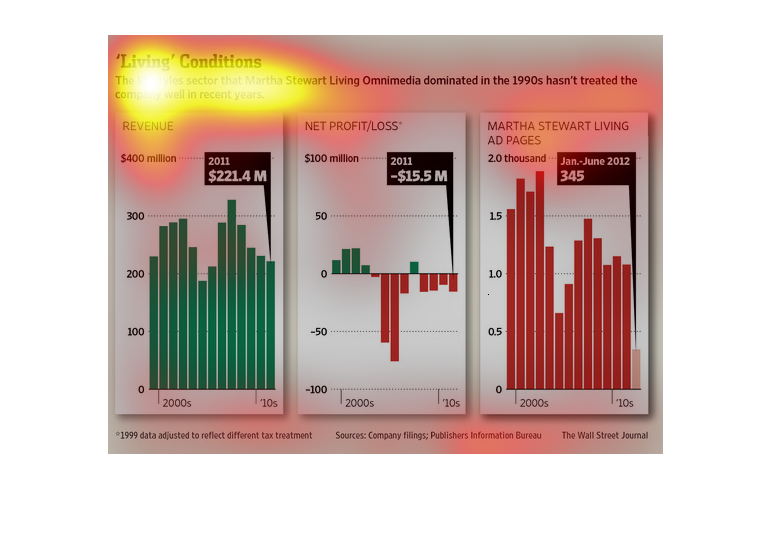
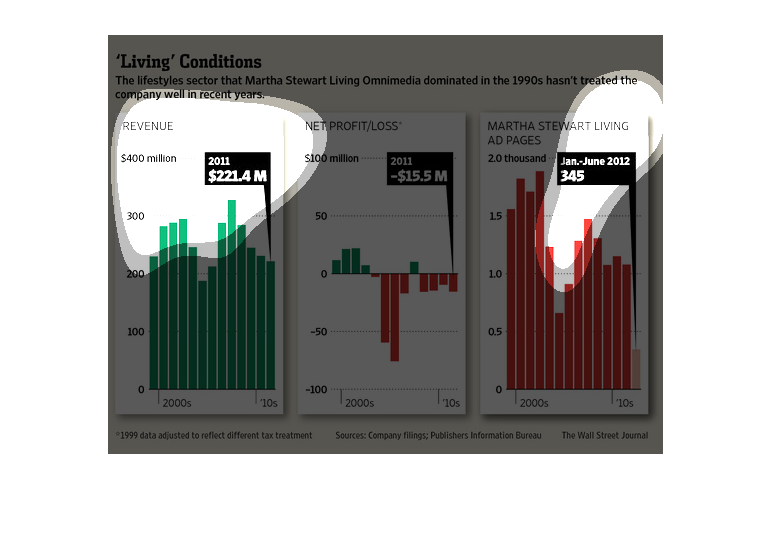
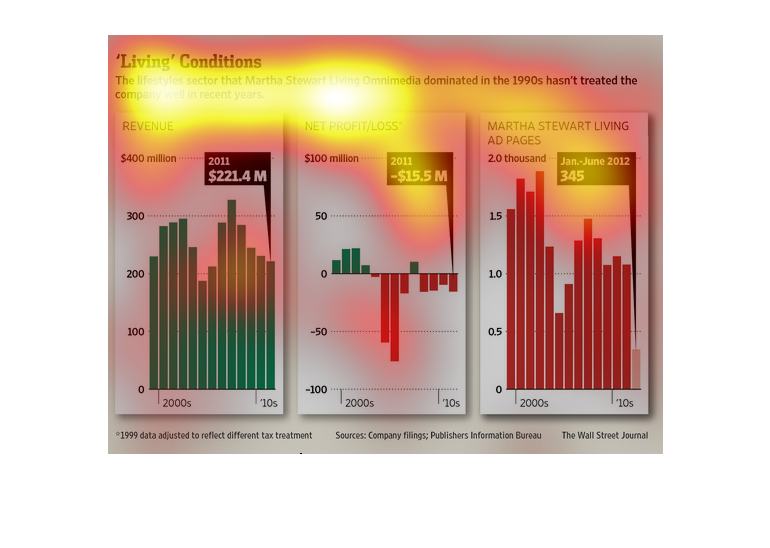
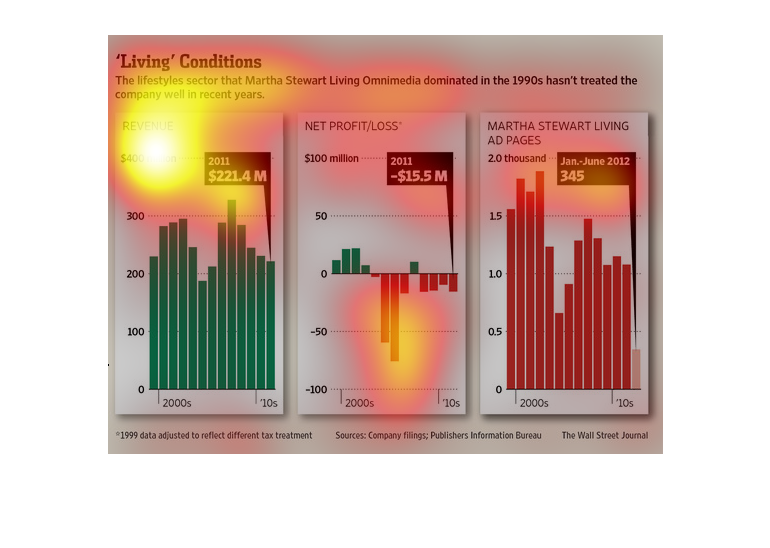
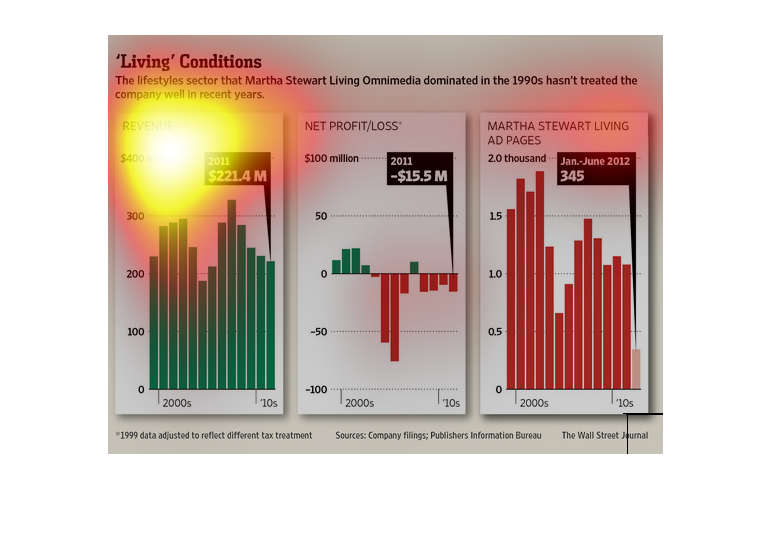
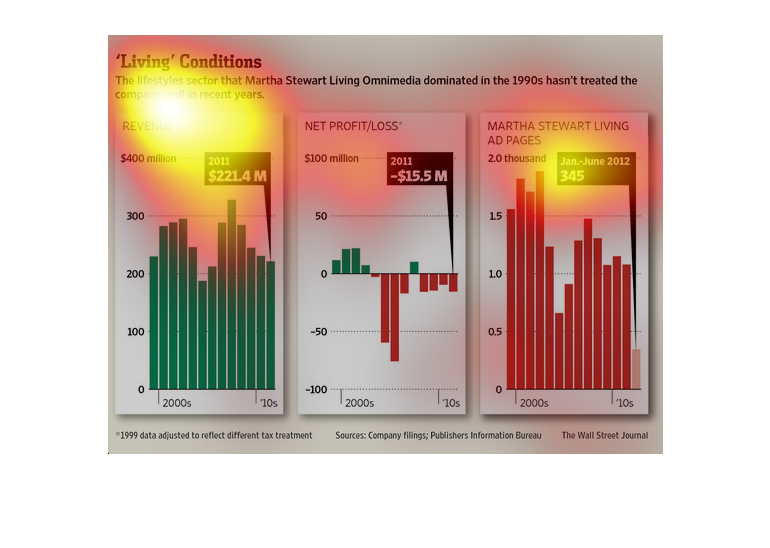
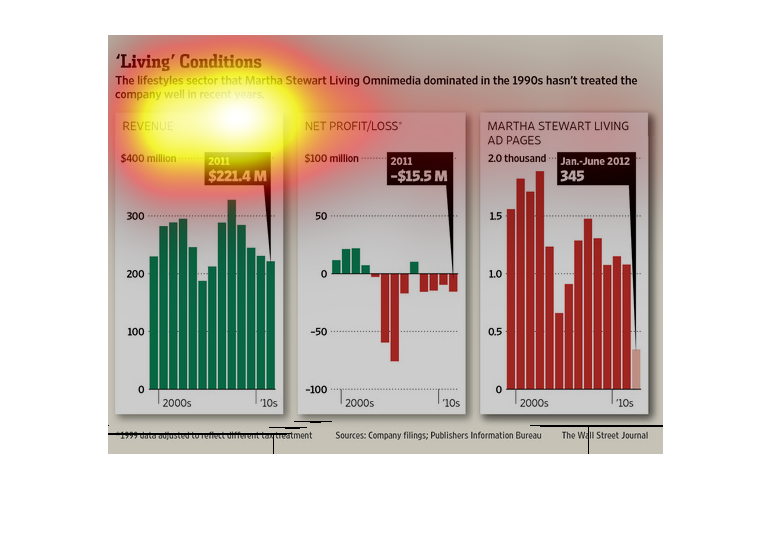
3 charts showing the decline of Martha Stewart's home living product line, showing it booming
in the early 2000's and now steadily declining. The charts are broken down by Total Revenue,
Net Profit/Loss, and amount of Ads placed.
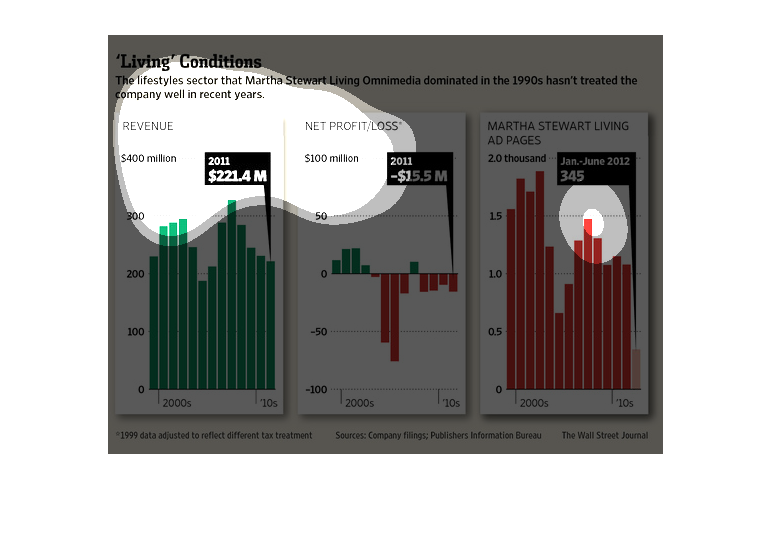
Martha Stewart Living Omnimedia has suffered variably since the early 2000s.  There is a direct
relationship between the use of less ads and less annual revenue.  In 2006, Martha Stewart
Living Omnimedia made the least revenue, while also having the least ads placed.
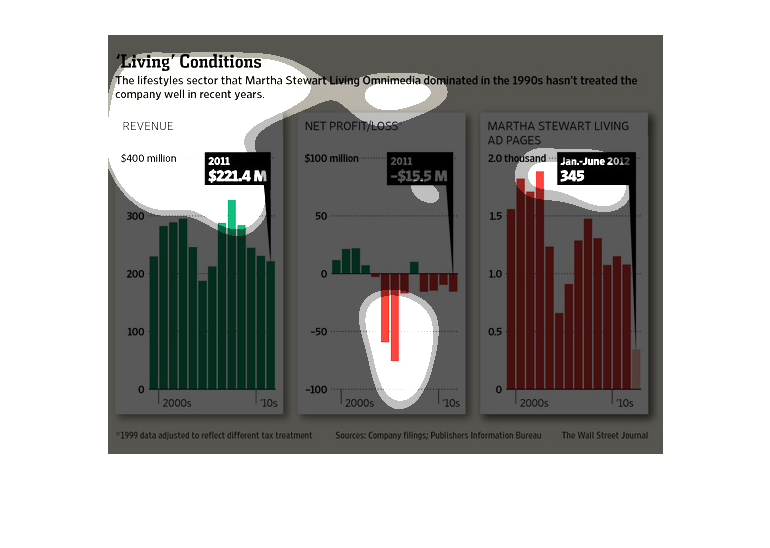
 It has revenue and net profit of the business in 2011 the last portion has to do with something
maybe about financial giving. For advertising for Martha Stewart living magazine
Martha Stewart home living company revenues over the past several years has not been as positive
as it had previously been. Number are down from previous years.
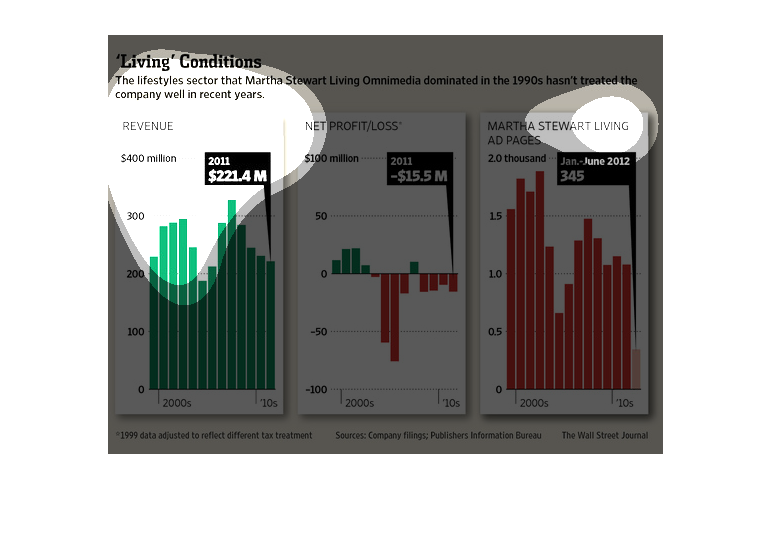
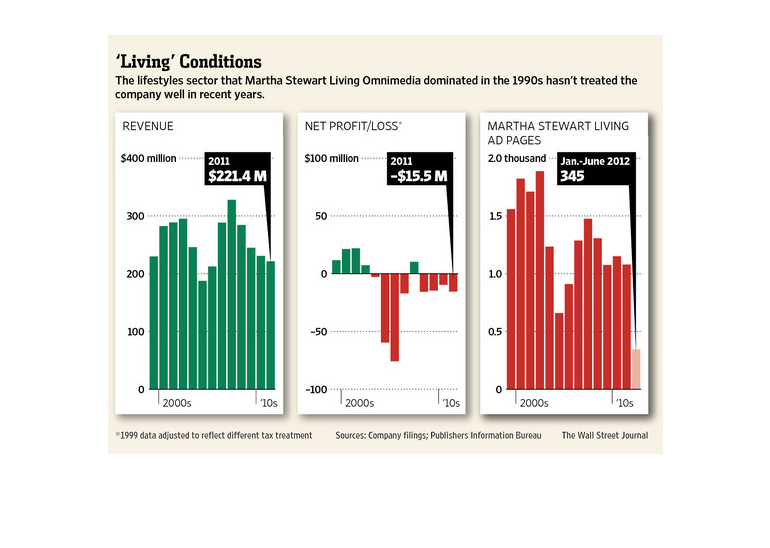
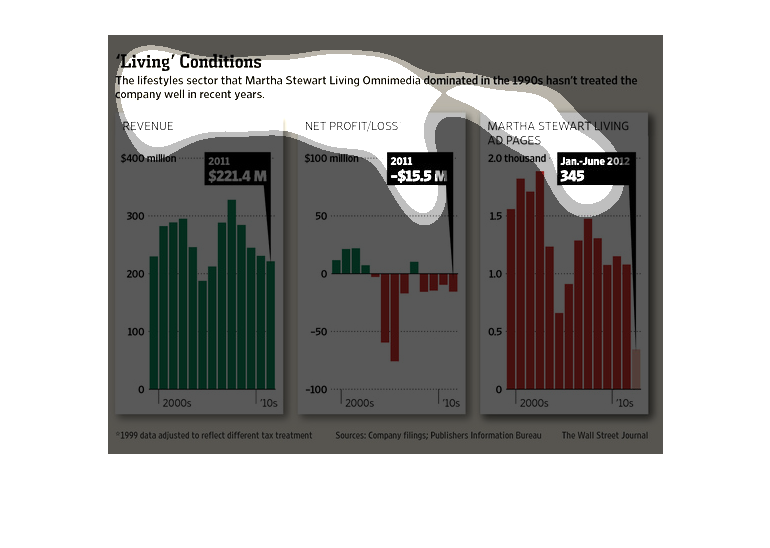
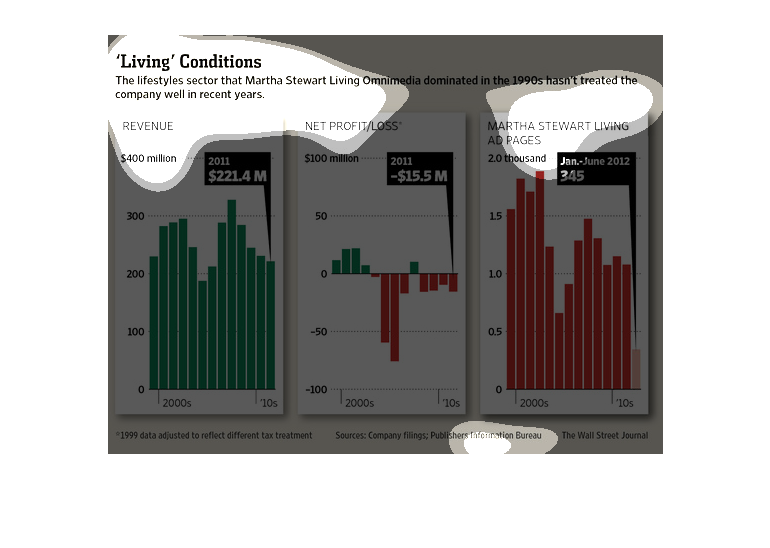
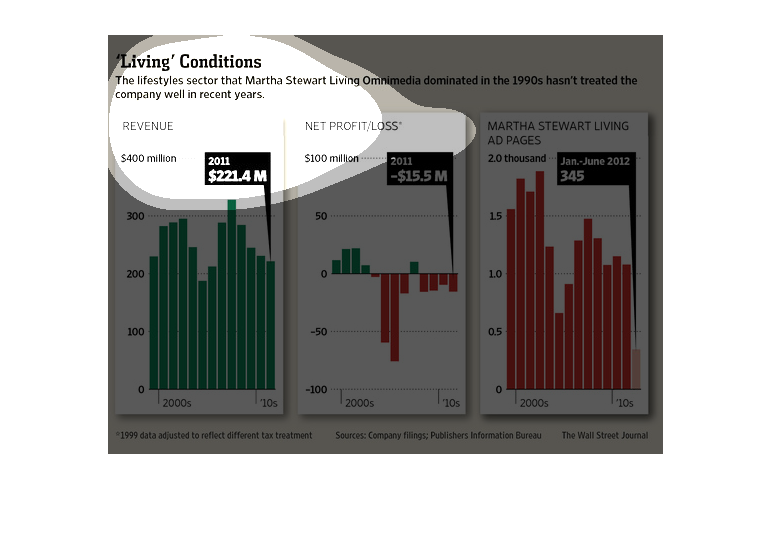
This chart describes living conditions. Specifically, the lifestyles sector that Martha Stewart
living omnimedia dominated in the 1990s hasn't treated the company well in recent year.
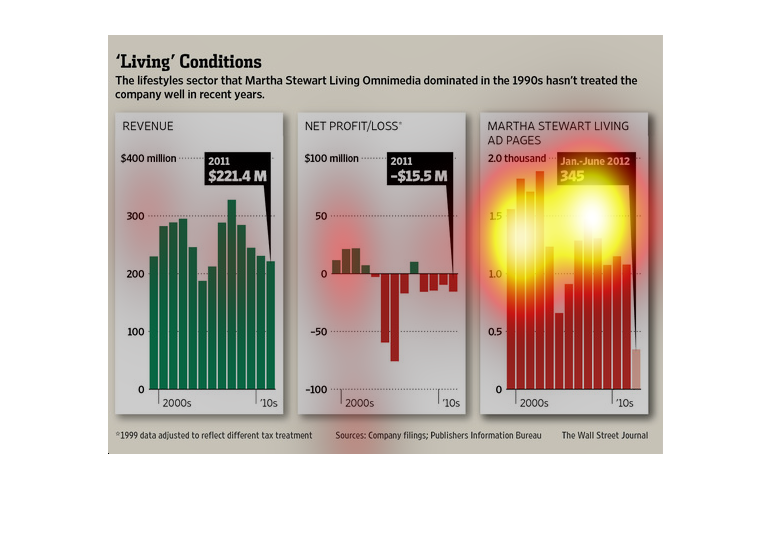
This chart depicts the martha stewart living conditions in a magazine, it shows revenue, net
profit and ad pages in the charts. It shows three different graphs for these concepts. 2011
was her highest year for profit.
This image provides a report regarding the lifestyles sector that Martha Steward Omnimedia
in the 1990s. Somehow Omnimedia has treated the company well based on the final information
presented in this image.
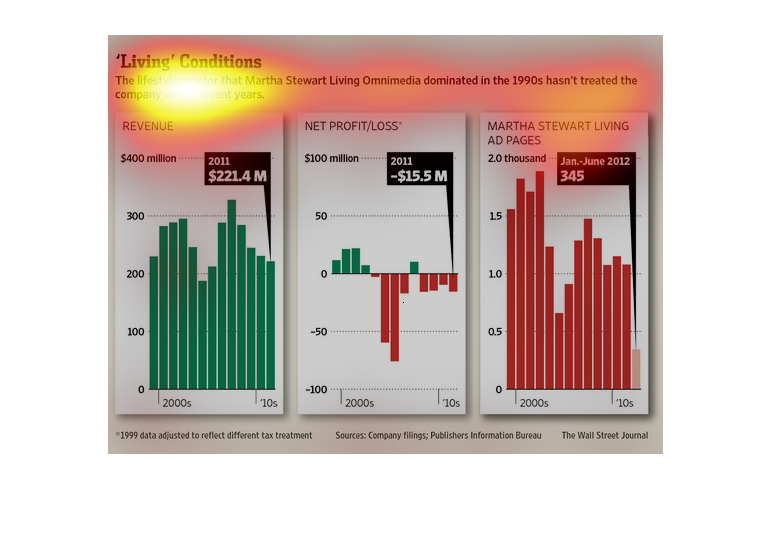
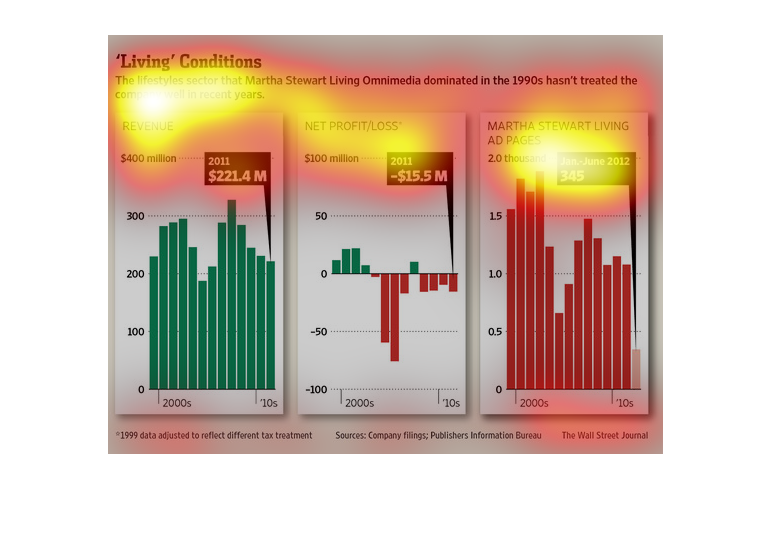
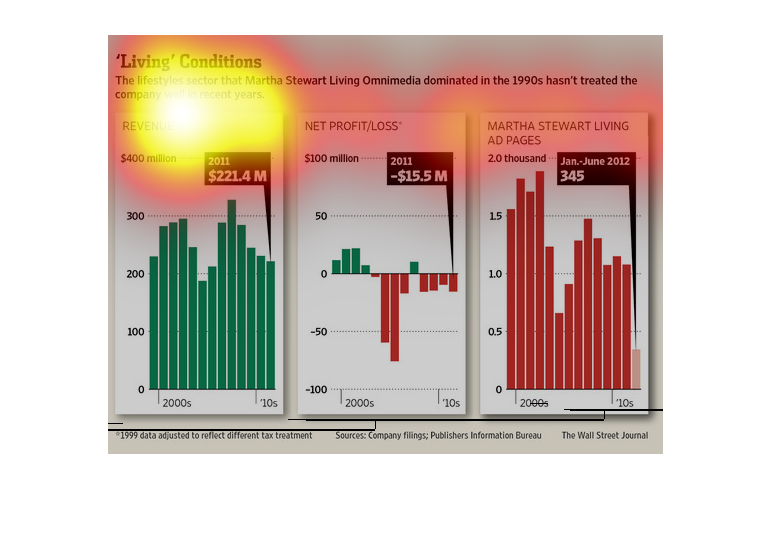
The following chart shows the living Conditions according to the Martha Stewart living ominmedia
dominated in the 1990S has not treated the company well since then.
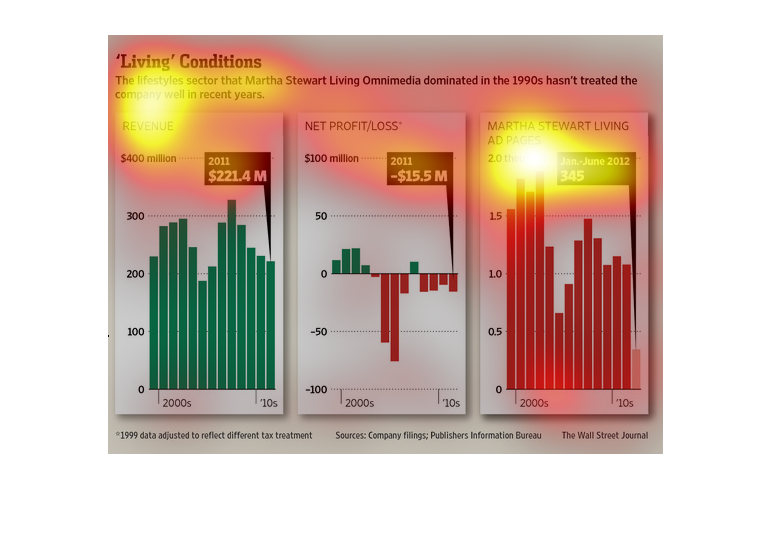
This is a series of color coded graphs and related statistics depicting the lifestyle sector
that Martha Stewart Omnimedia dominated in the 1990's hadn't treated the company as well in
recent years.

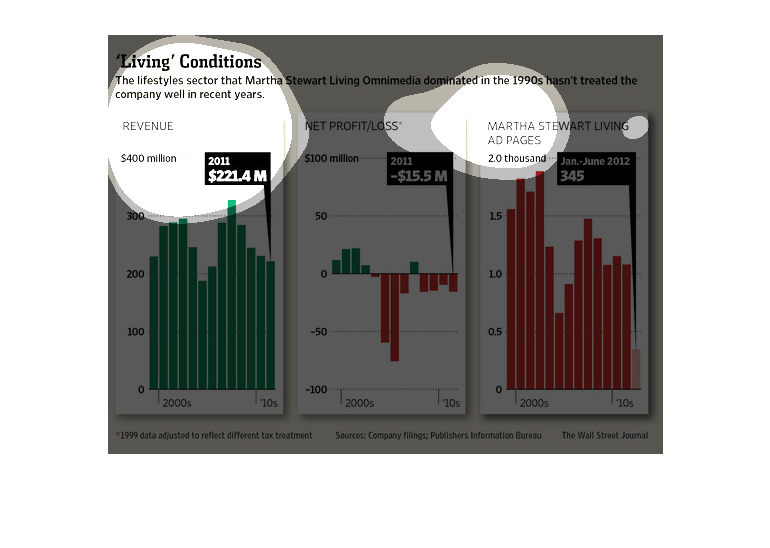
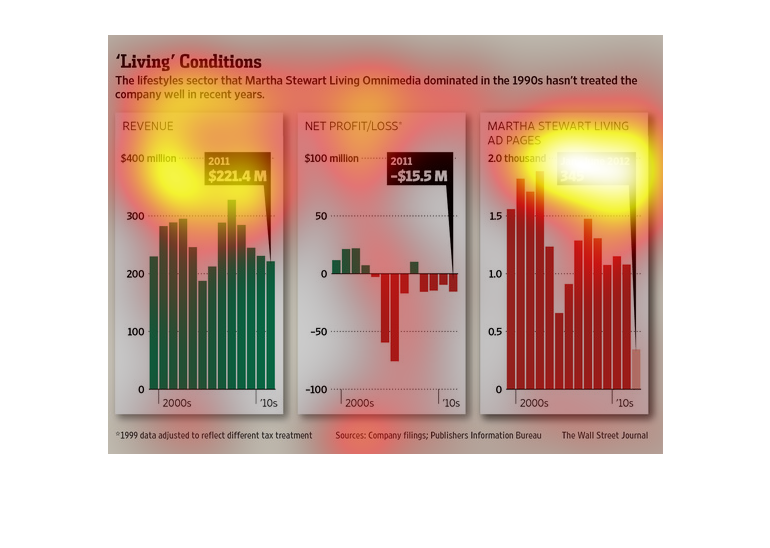
This image shows the Revenue, Profit/Loss, and advertising for Martha Stewart Living Omnimedia.
Illustrating that "in recent years" the company has been doing well.
LIFESTYLE SECTOR THAT MARTHA STEWART LIVING OMNIMEDIA DOMINATED IN THE 1990S HASNT TREATED
THE COMPANY WELL IN RECENT YEARS. THIS GRAPH SHOWS THE REVENUE OF THE VARIOUS ENTITIES WITHIN
MARTHA STEWART LIVING.