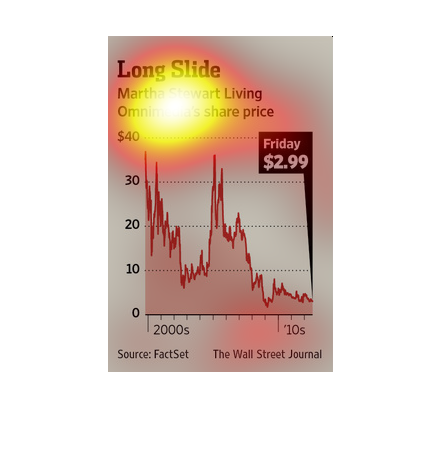
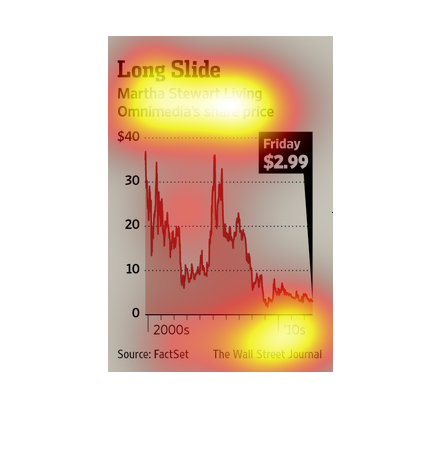
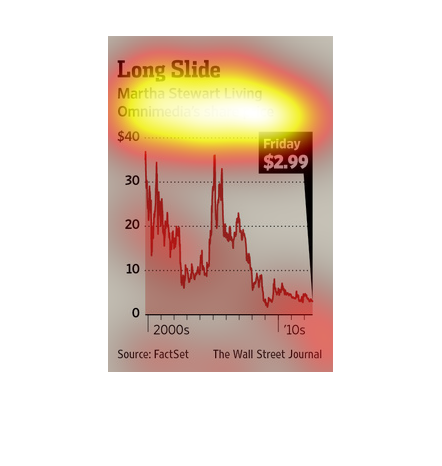
This chart shows the lackluster performance of the martha stewart living share price. It has
plummeted from over $30 a share to less then $10 a share.
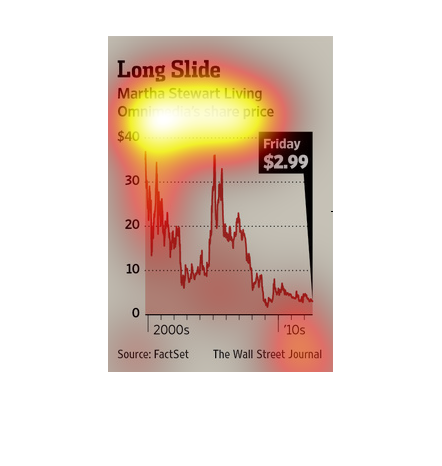
This shows the change in share price for Martha Stewart Living from the 2000s to 2010s and
how it has decreased over time with her decrease in popularity.
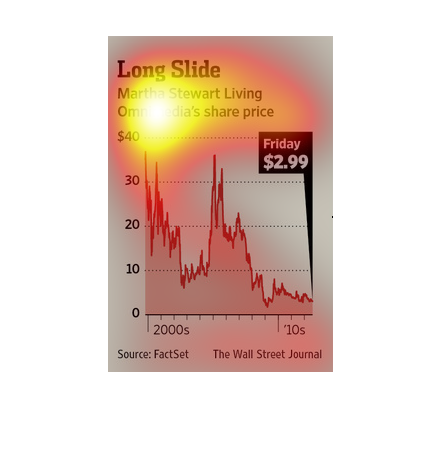
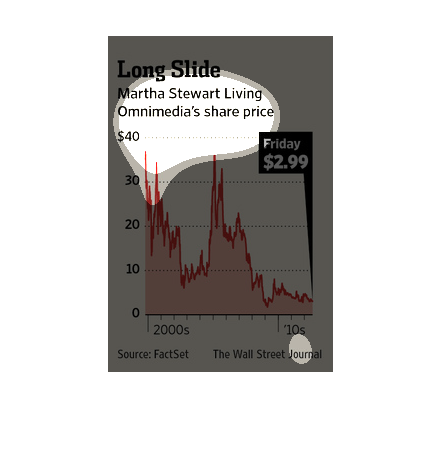
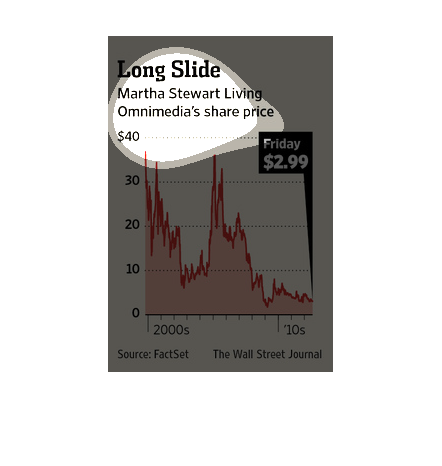
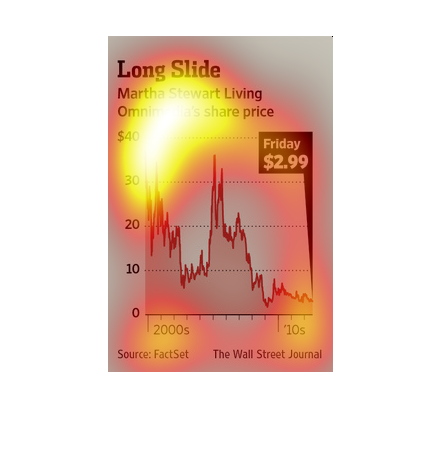
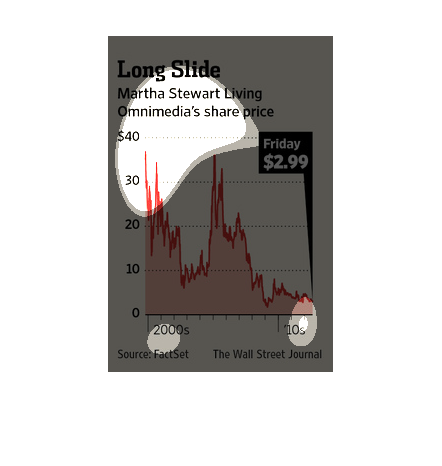
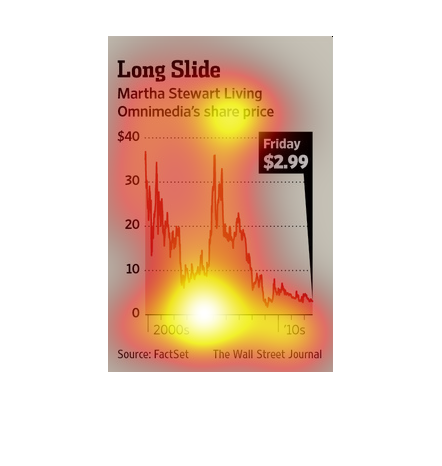
This chart describes long slide. Specifically, Martha Stewart living Omnimedia's share price.
The highest spike on the chart occurs close to the forty dollar mark.
This chart  long slide. Specifically, Martha Stewart living Omnimedia's share price. The highest
spike on the chart comes in close to the forty dollar mark.
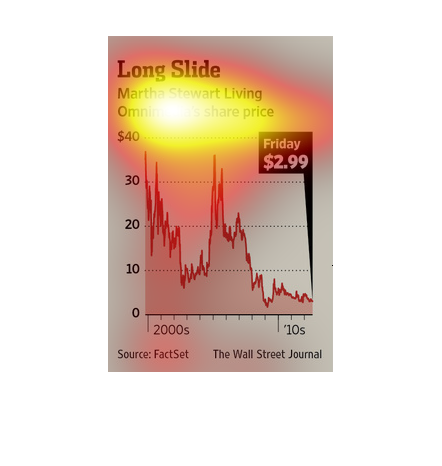
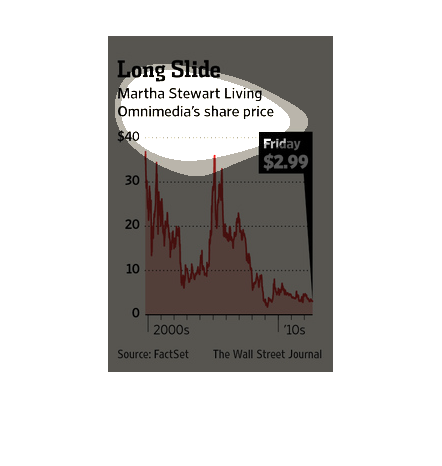
The caption for this graph is, "Long Slide".  This particular graph shows contrasts in price
of Martha Stewart's media company, Omnimedia.  Initially back in 2000 shares of her company
were just under $40.  Some time in 2010 here company's shares were selling for right around
$3 a share.
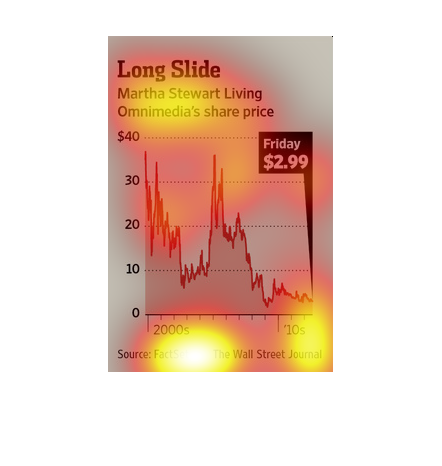
This image shows or depicts in line graph statistical format data concerning Martha Stewart
Living Omnimedia's share price. Source is FaceSet from the WSJ.
This shows Martha Stewart living omnimedia's share price. The trend shows that the share price
has decreased dramtically since the mid 2000s to the 10s.
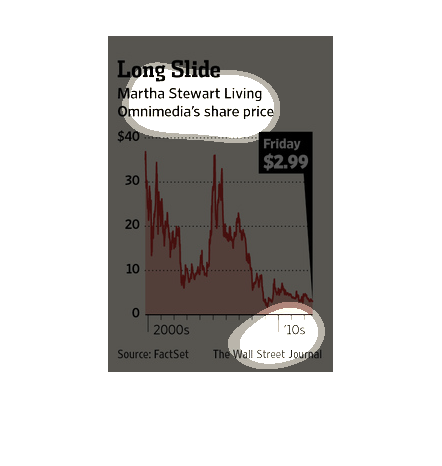
Share prices in the Martha Stewart Living corporation dropped from 30 dollars a share to ten
in the first few years of the 21st century. Prices then made a comeback, back to 30 dollars
a share in about 2005, before falling again to a low of 2.99 in 2012.

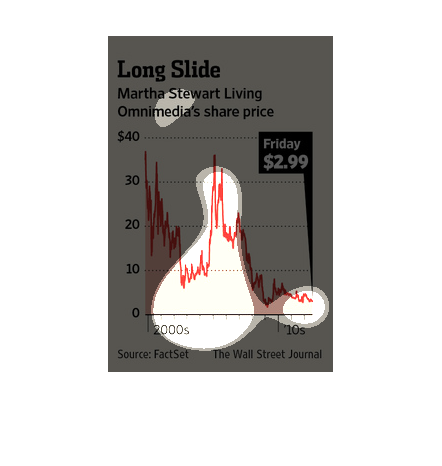
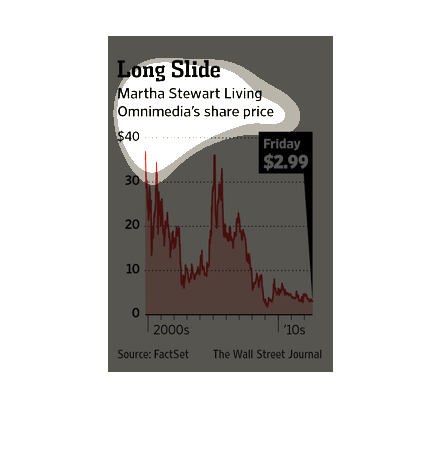
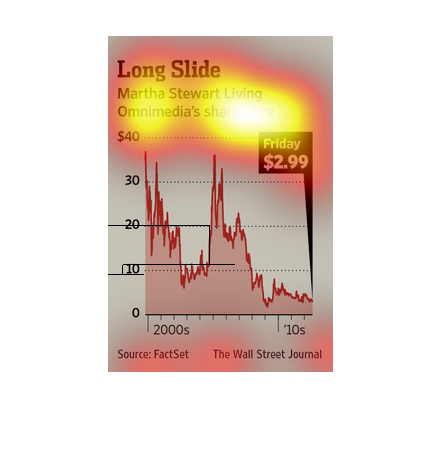
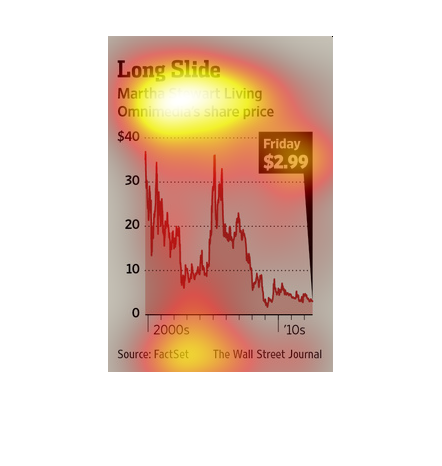
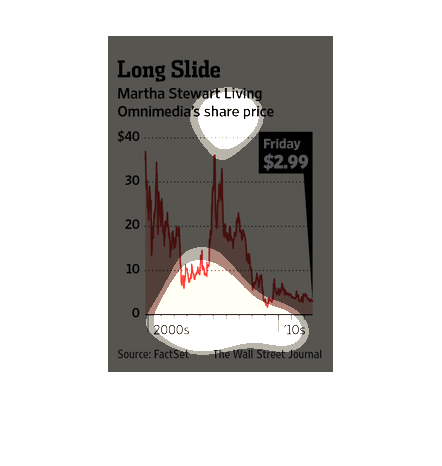
This chart describes Martha Stewart Living Omnimedia stock prices. The lowest price point
is at $2.99 after 2010. The highest price looks to take place in 2005.


The image depicts Martha Stewart Living Omnimedia's share price, from the early 2000's to
the 2010's. After seeing considerable gains in the mid 2000's, the share price plunged to
all time lows in the 2010's.
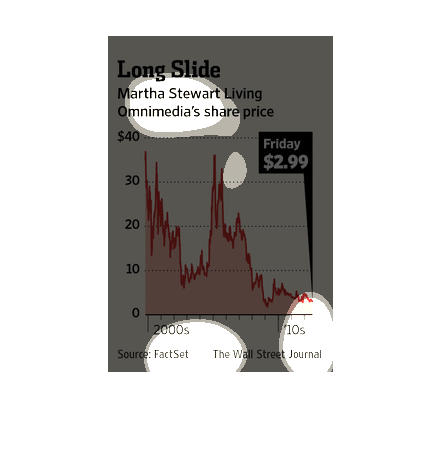
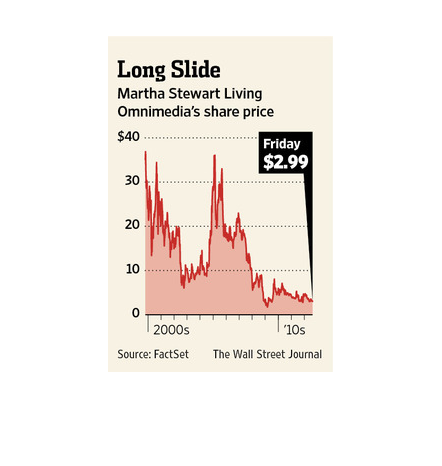
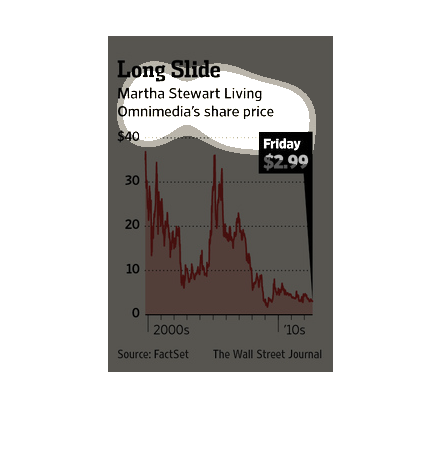
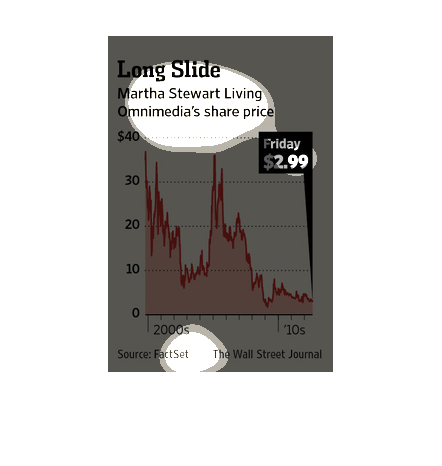
This is a graph showing the slide of Martha Stewarts' Living Omnimedia share price. It fell
steeply in the early 2000s, but rebounded until about 2008. It then fell and continued to
stay very low after 2010. It fell from nearly $40 to less than $5.
This is a simple chart depicting the share price of Martha Stewart Living Omnimedia from the
2000's into the 2010's. It shows a long and steady decline in share price over this time period.
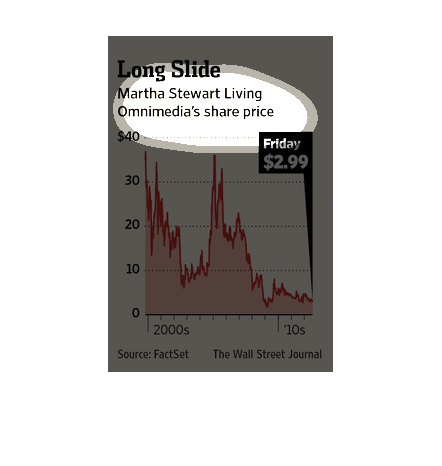
The following chart is labeled long slide. It shows the long downtrend of Martha Stewarts
company Omnimedia share price. Shows a steady decline form 2000 to 2011.