The image depicts the volume of single-family loans insured by the Federal Housing Commission
90 days or more past due. The data appears to show an increase in delinquent loans from 2006
to 2012.
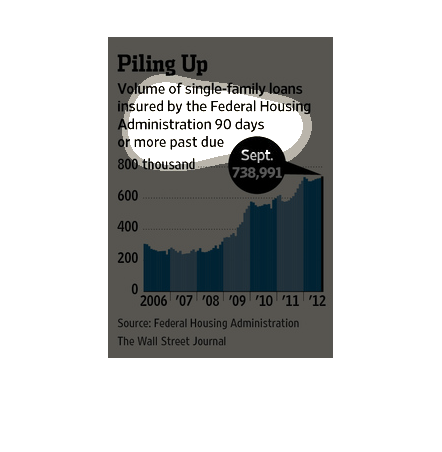
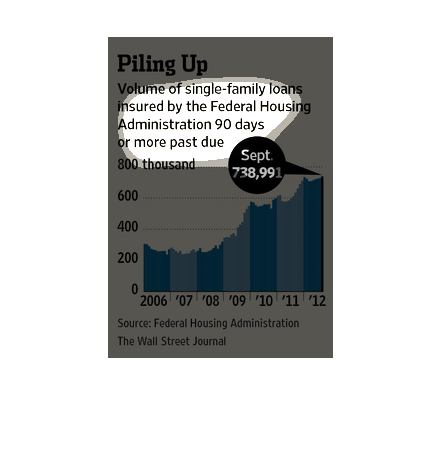
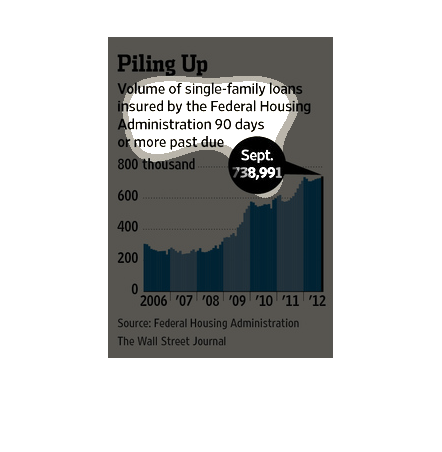
The caption for the graph here is, "Piling Up".  There's a bar graph made up of data from
2006-2012 where data reflected volumes of single-family loans insured by the FHA were more
than 90 days past due.
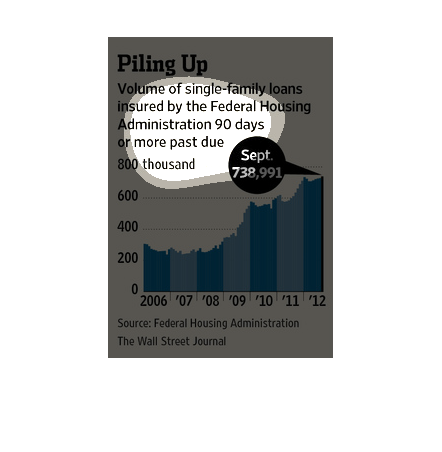
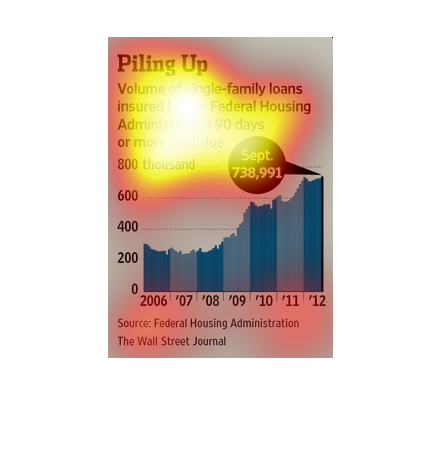
This chart describes piling up. Specifically, volume of single family loans insured by the
federal housing administration 90 days or more past due, for the month of September.
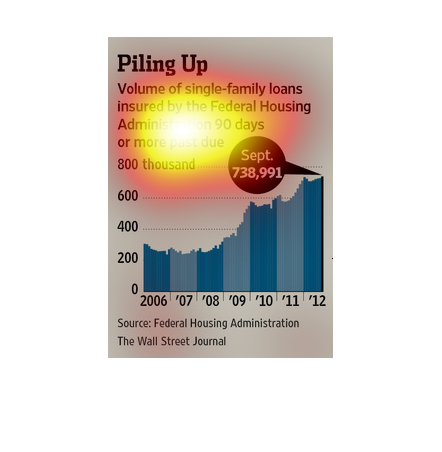
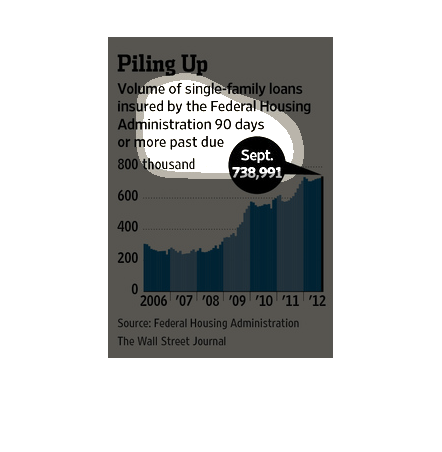
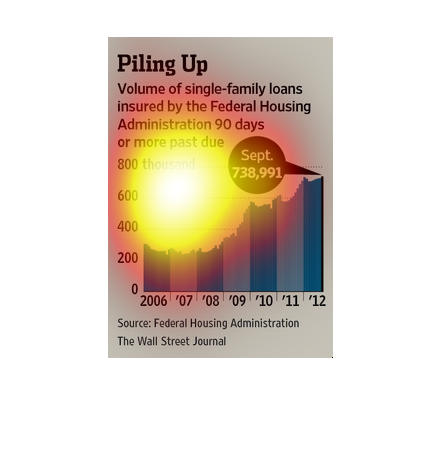
This chart shows the volume of single family loans insured by the Federal Housing Administration
that are 90 days past due. It has been rising over time to almost 800,000 in 2012.
This shows the volume of single family loans insured by the Federal Housing Administration
90 days or more past due. The data shows that loans have increased steadily.
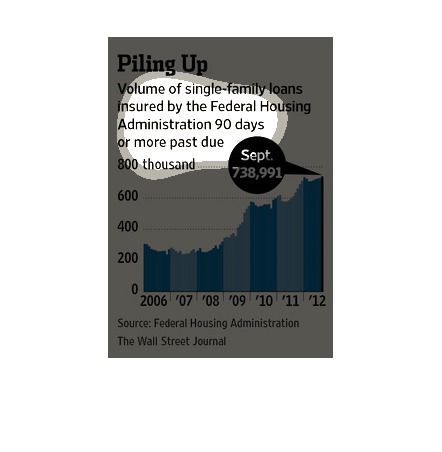
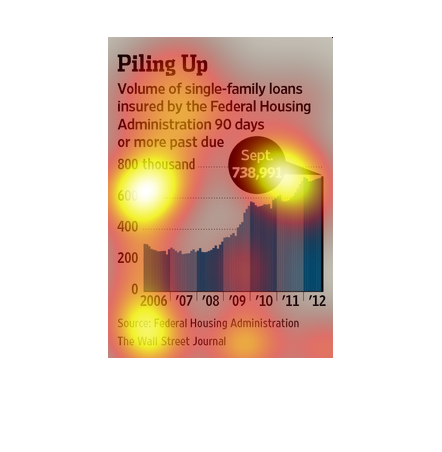
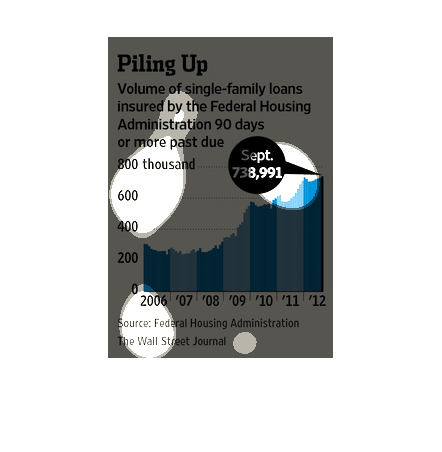
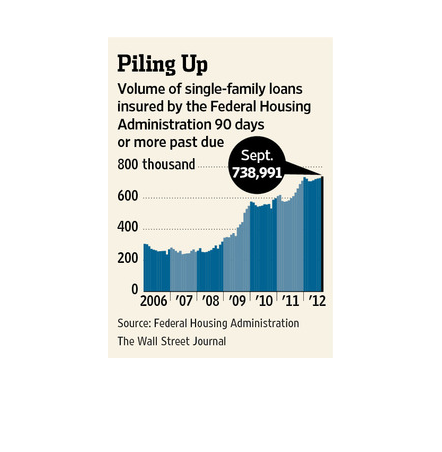
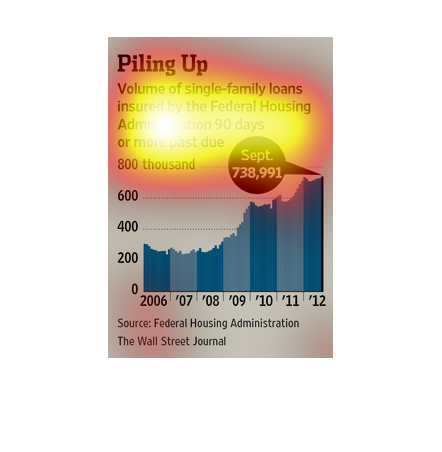
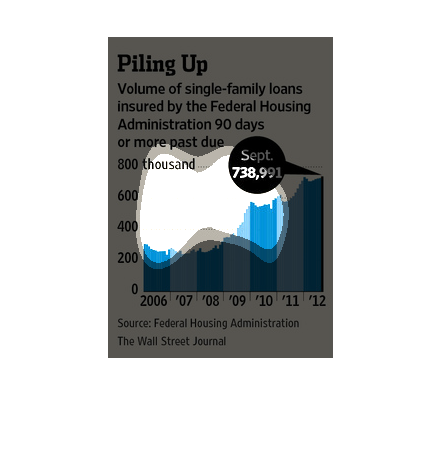
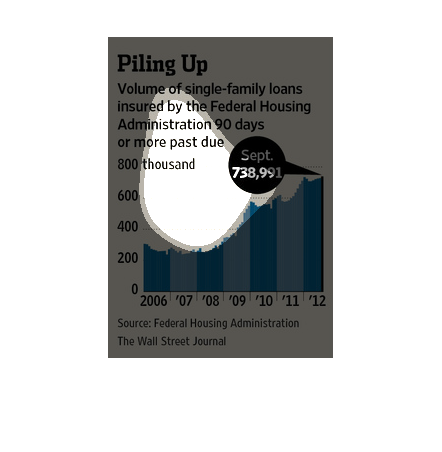
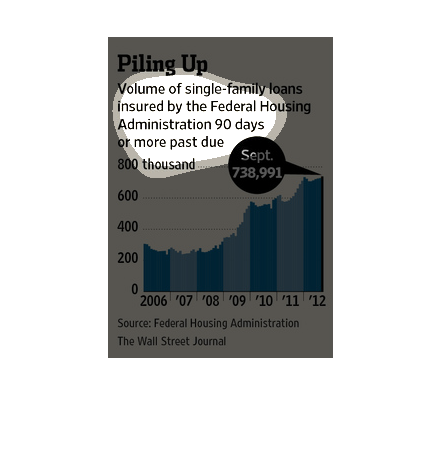
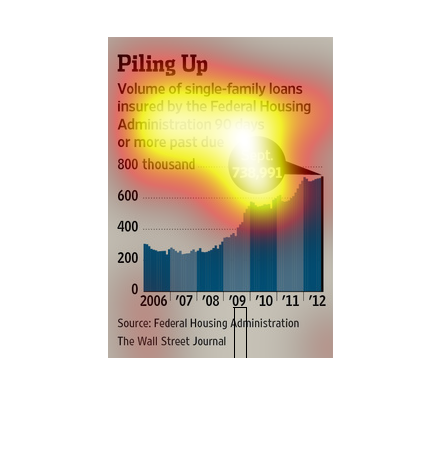
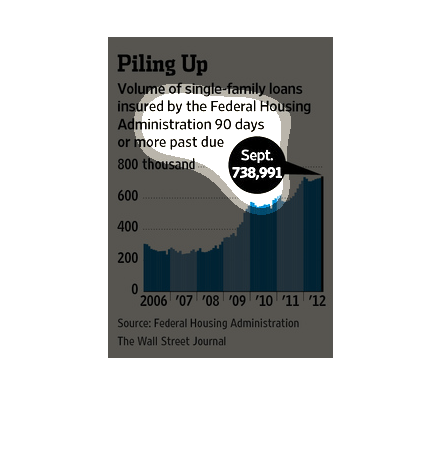
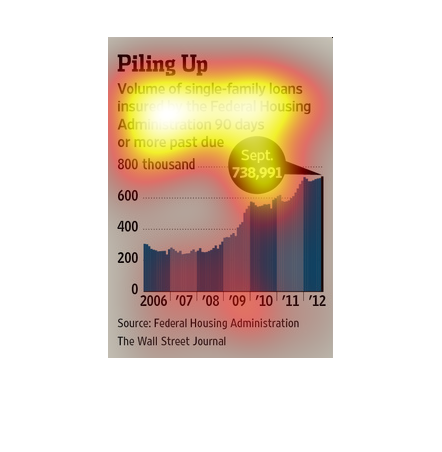
Graph shows the volume of single family home loans insured by Federal Housing Administration
from 2006-2012 that are 90 days or more past due. From2006 until 2009 there were between 200
and 400 thousand. The number spikes to nearly 600 thousand in 2009 and by September 2012 reached
738,991.
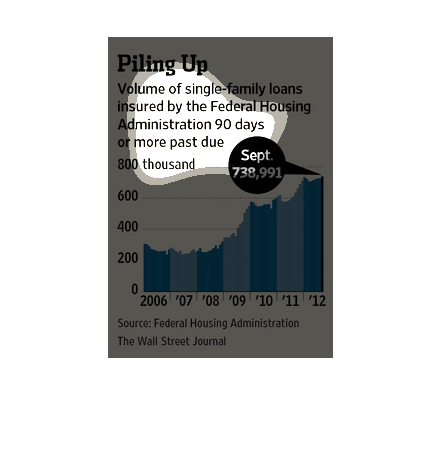
This chart describes piling up. Specifically, volume of single-family loans insured by the
federal housing administration that are 90 days or more past due.
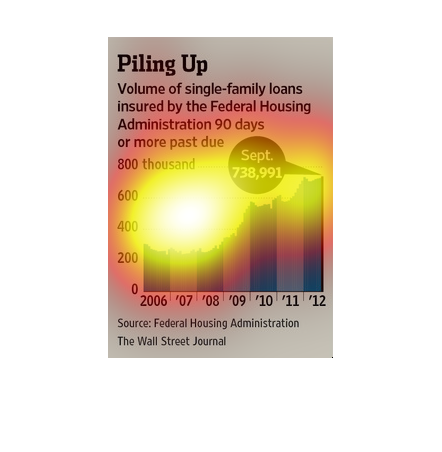
The title of the graph is Piling Up. It says that the volume of single family loans insured
by the Federal Housing Administration 90 days or more past due.
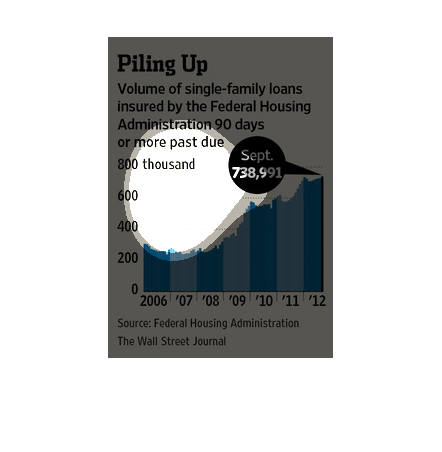
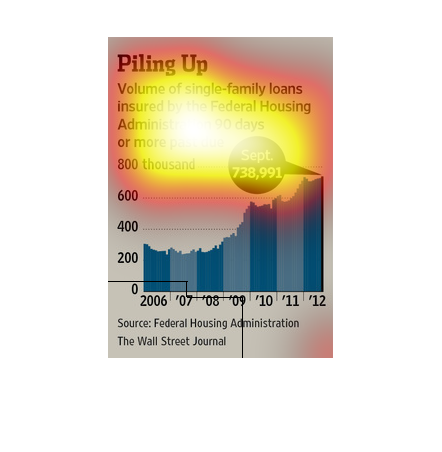
It shows a chart of the volume of single-family loan insured by the Federal Housing Administration
that is past due by 90 days or more. It has been increasing from around 300,000 in 2006 through
2012, which has a value of 738,991.
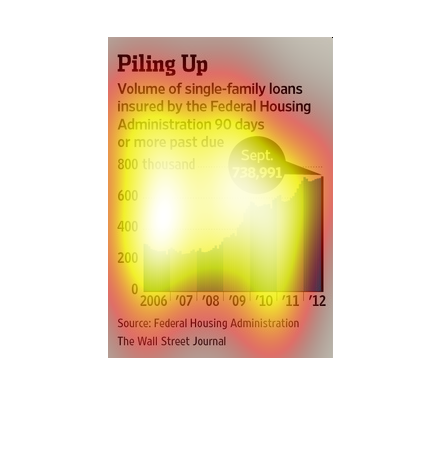
This study conducted by the Wall Street Journal from 2006 to 2012 is showing us how the housing
market has still a long way to go before it is totally recovered from this recession.
This is a graph showing the volume of single family loans insured by the federal house administration
that are 90 days or more past due. This is for the years 2006 to 2012.
The image depicts the volume of single-family loans insured by the Federal Housing Administration
90 days or more past due. Data from 2006-2012 indicates that the number has risen to an all-time
high.
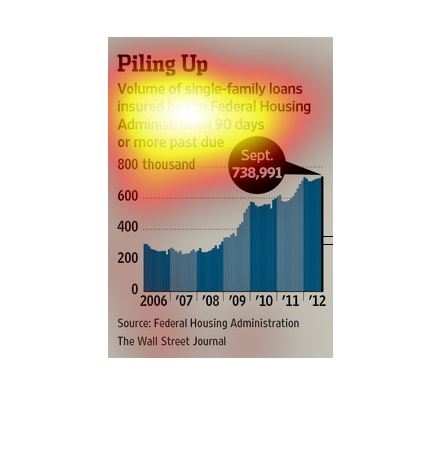
This graph shows how the volume of single family loans over 90 days past due has gone up from
2006 to 2012. As of September 2012, there were 738,991.
This is a bar graph and related statistics depicting the volumes of single family loans insured
by the Federal Housing Administration 90 days or more past due.
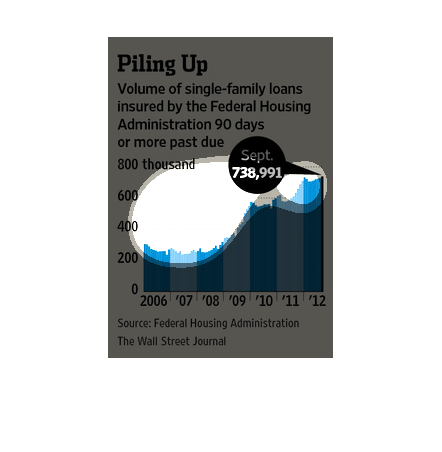
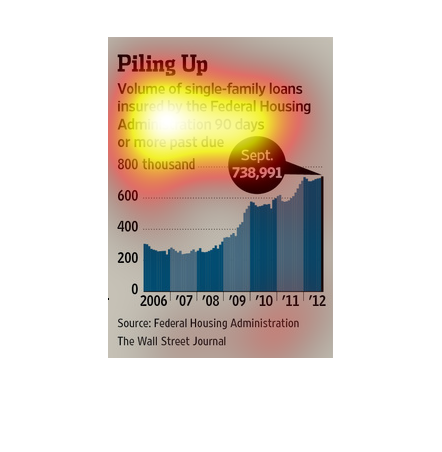
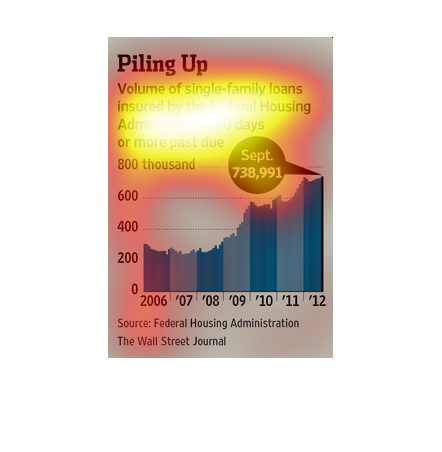
The chart shows how housing loans have increased over time from 2006 to 2012 with the peak
being reached in September 2012 at 738, 991. The market seemed to dwindle until 2009 when
it begin to pic up momentum