This describes public fear of budget deficit based on unemployment rates, GDP versus potential,
alternative fiscal scenarios, and pending projects scheduled.
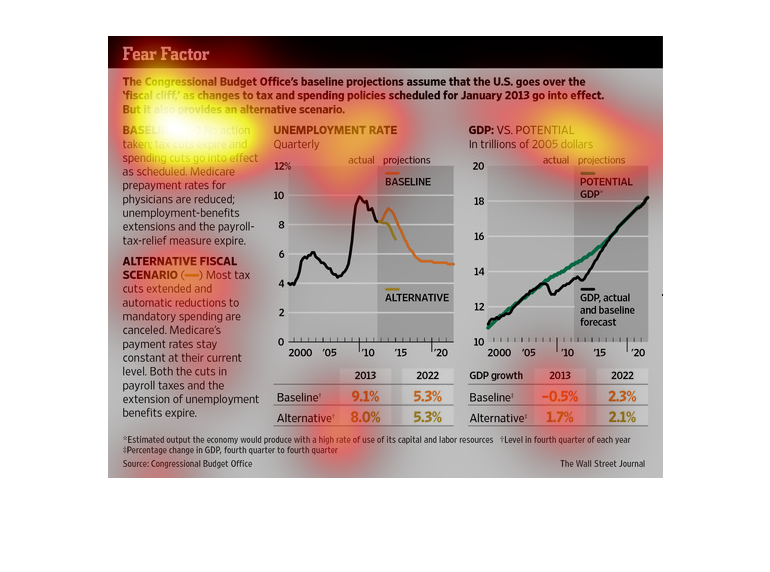
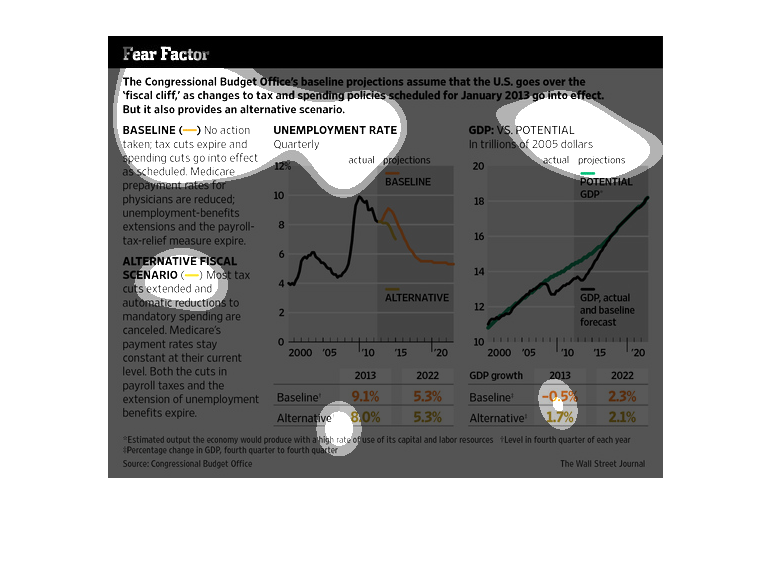
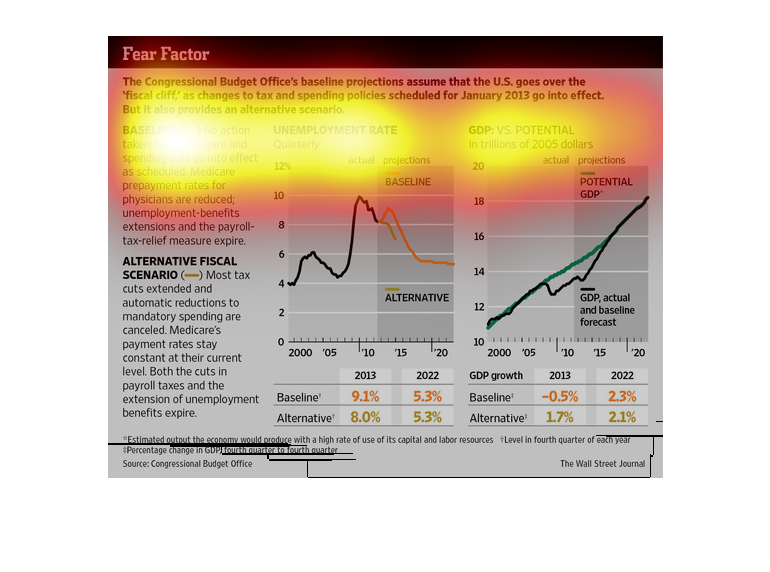
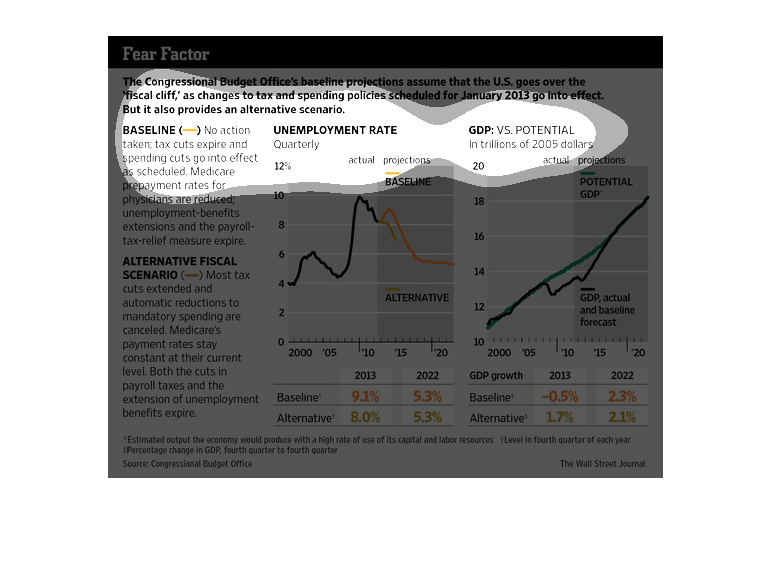
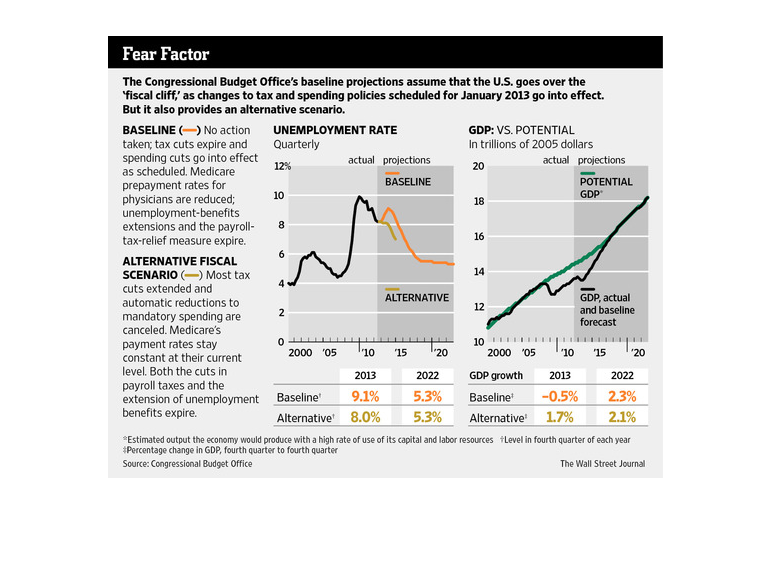
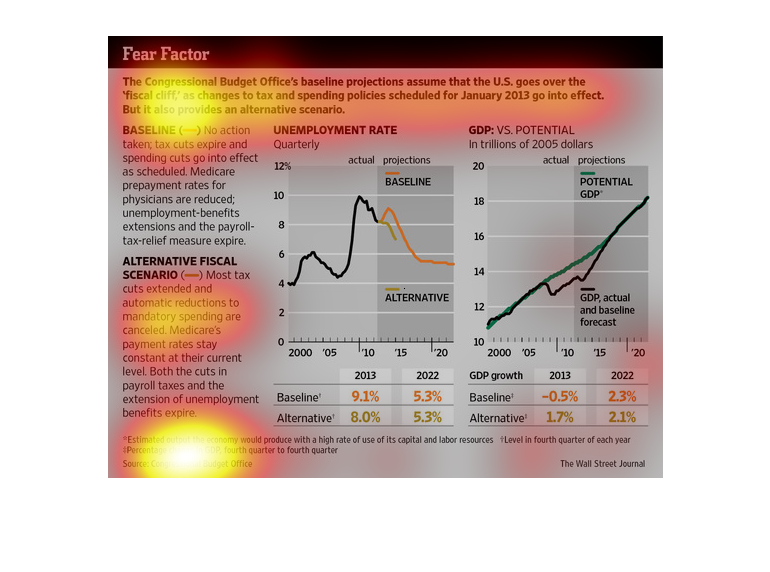
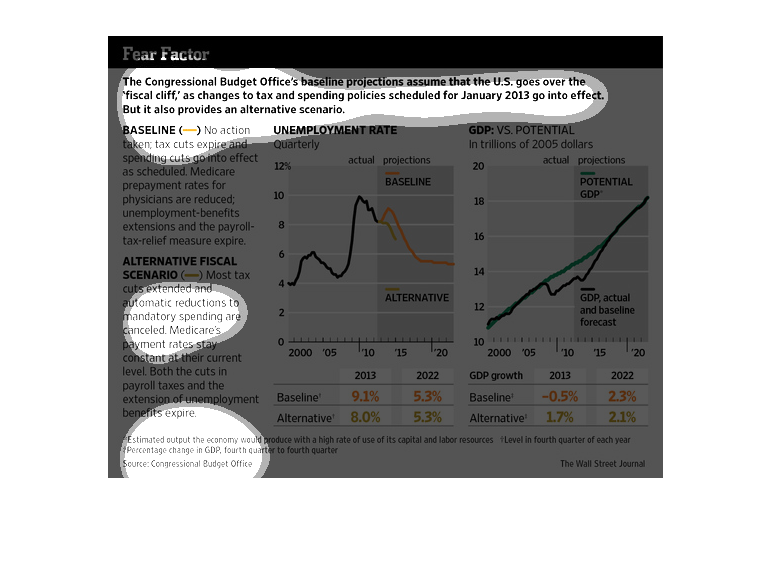
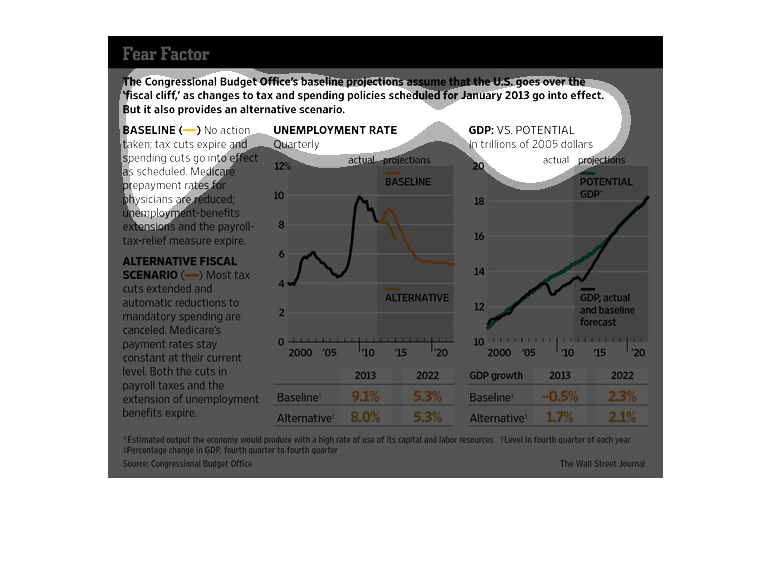
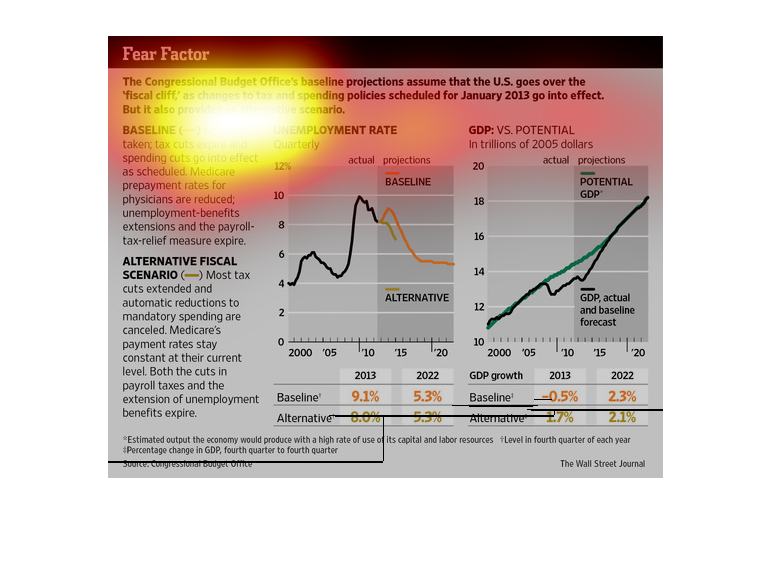
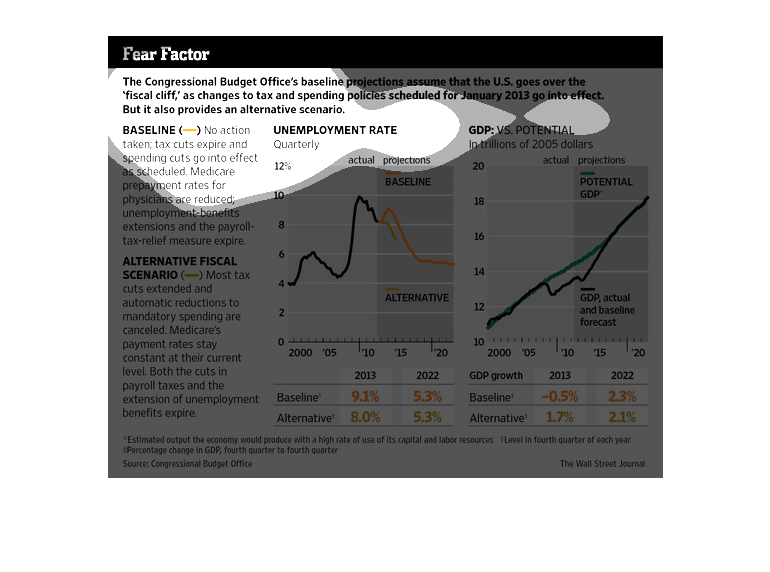
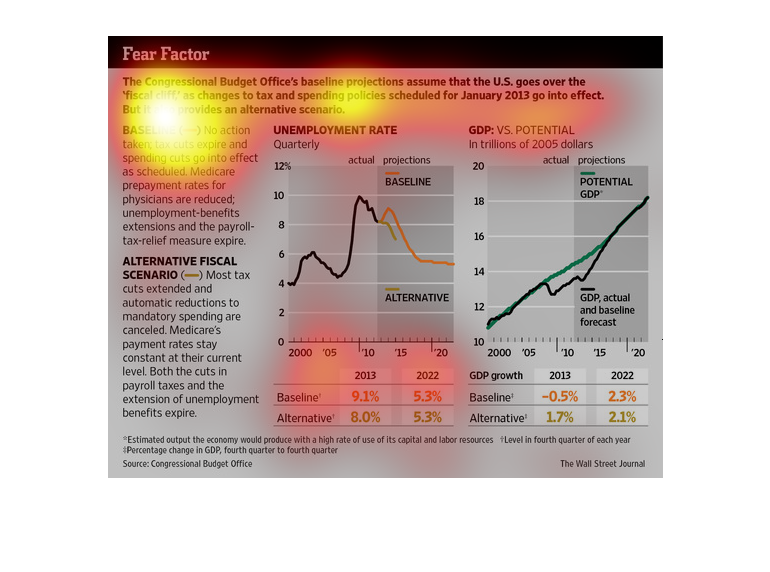
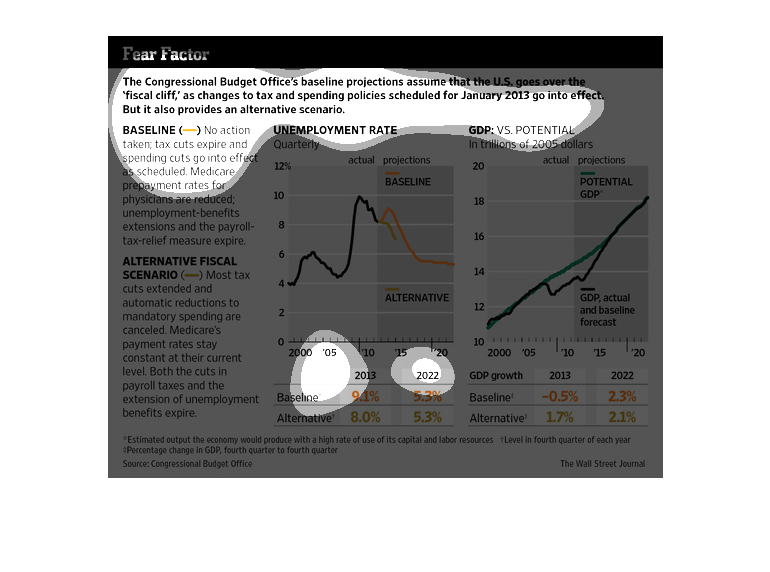
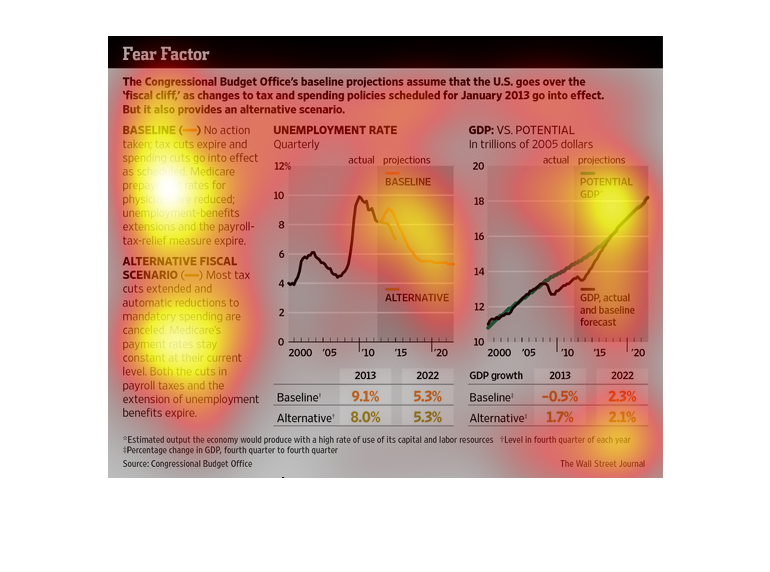
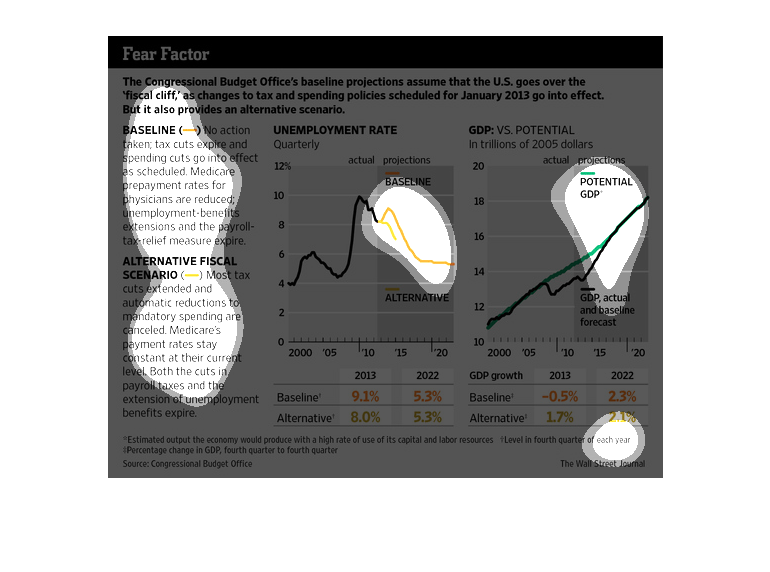
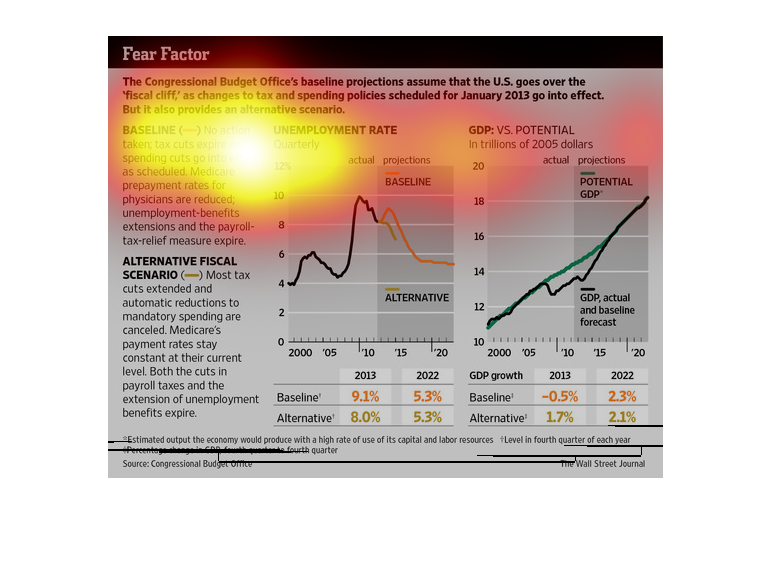
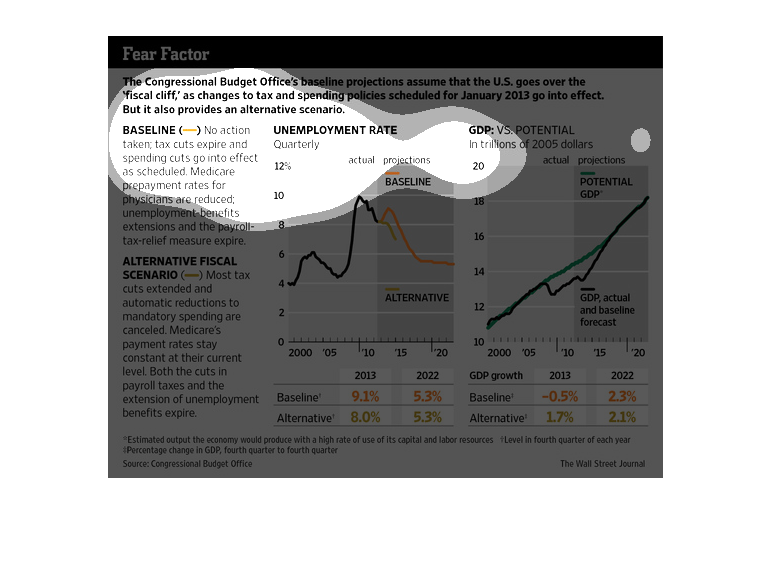
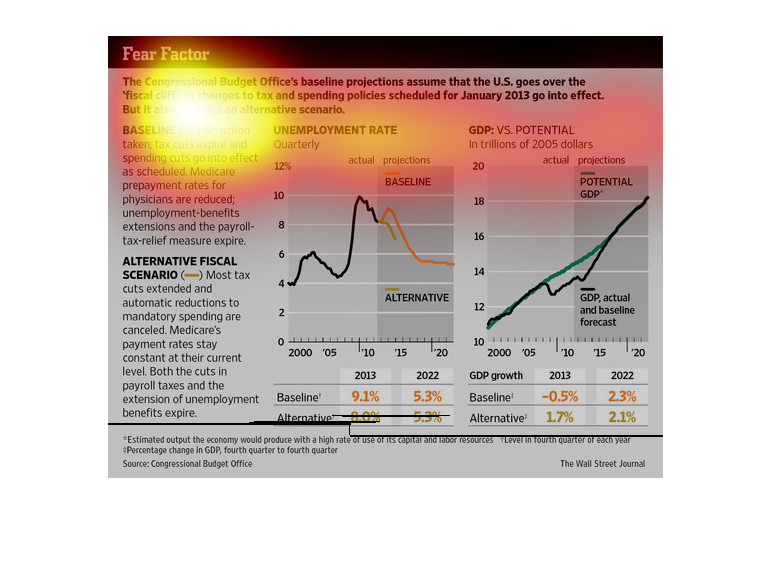
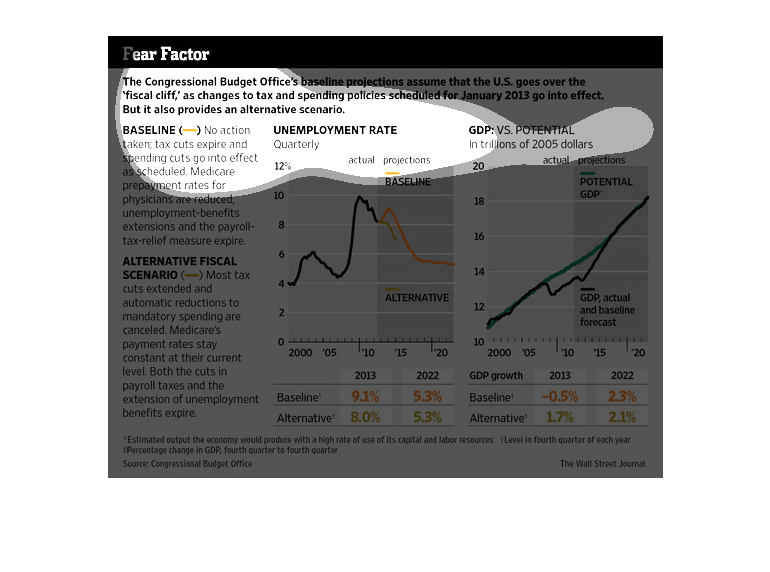
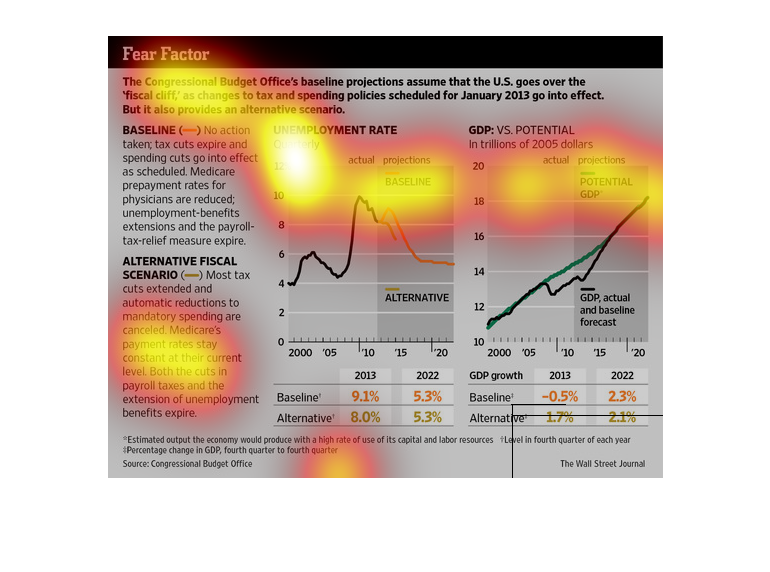
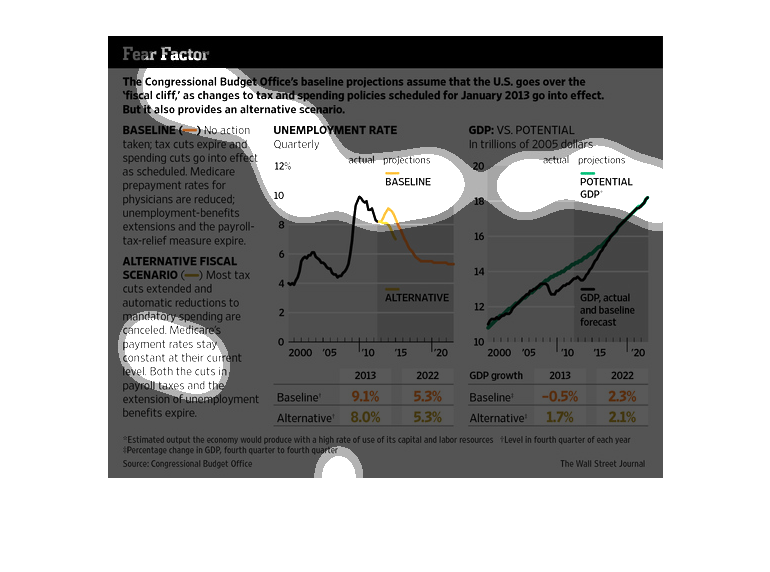
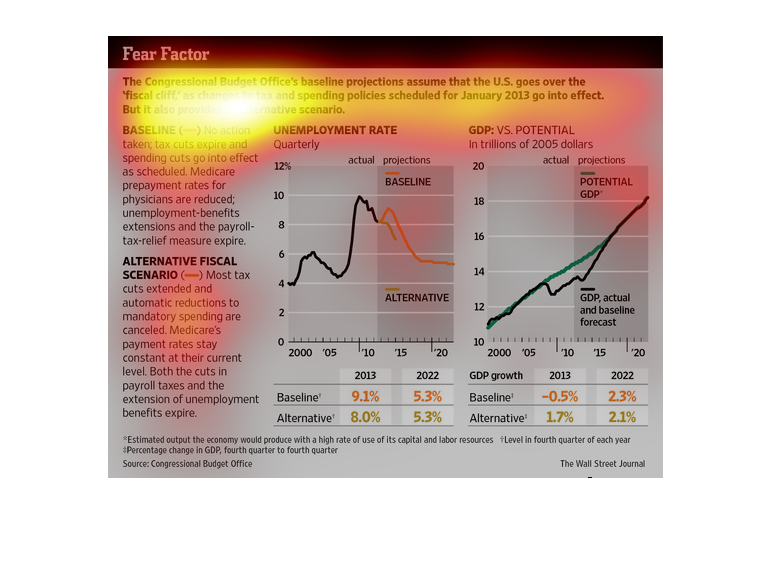
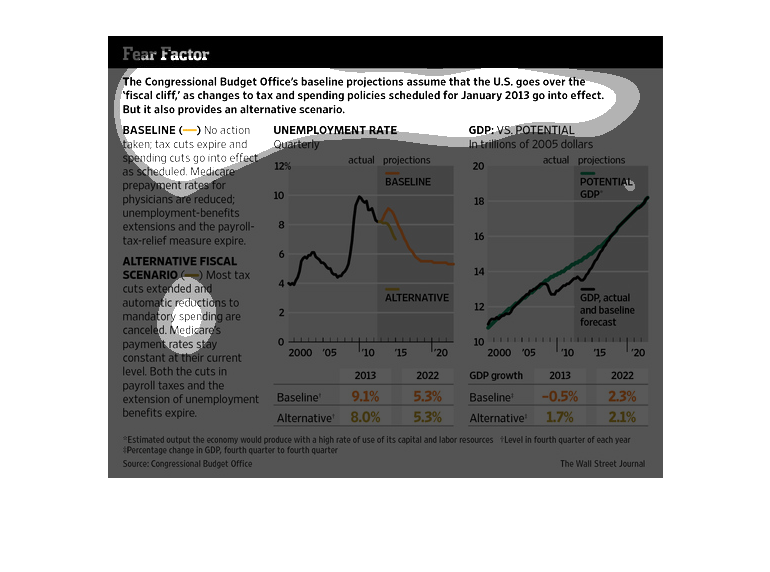
The image depicts the Congressional Budget Office's projection that the US will go over the
'fiscal cliff', as changes to taxing policy and spending go into effect in January 2013. The
data indicates negative consequences if the country goes over the fiscal cliff.
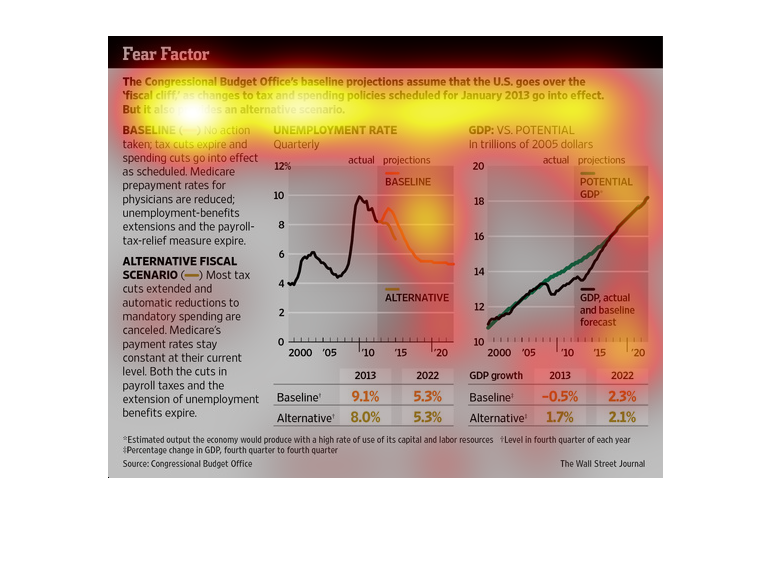
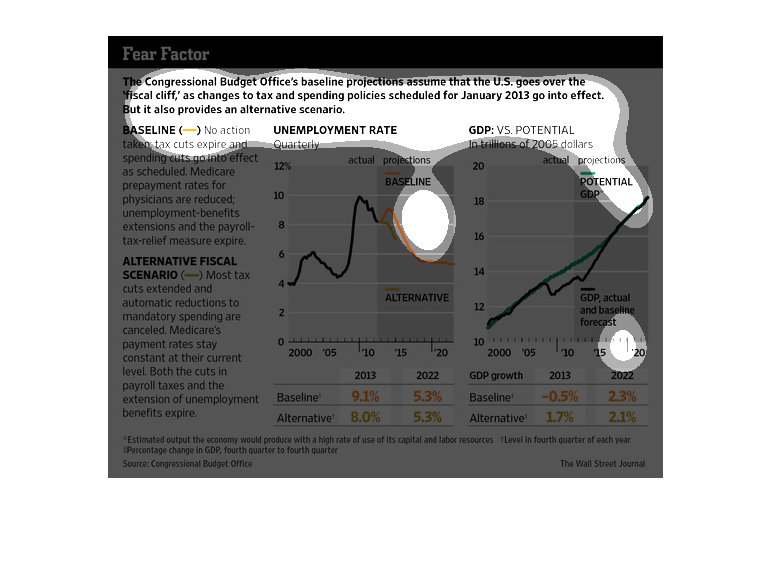
This chart is a prediction that US will go over its fiscal cliff in 2013. It also shows a
scenario where US could save this from happening. One reason for going over the fiscal cliff
would be cuts in payroll taxes.
The effects of economic policy always has huge ramifications for everyone evolved; especially
the lower classes, who don't have as much to spend. This study breaks everything down into
understandable little pieces.
Graph shows details on the tax and spending policies going into effect for January 2013. It
shows statistics for unemployment rate and GDP vs. Potential from 2013 to 2022.
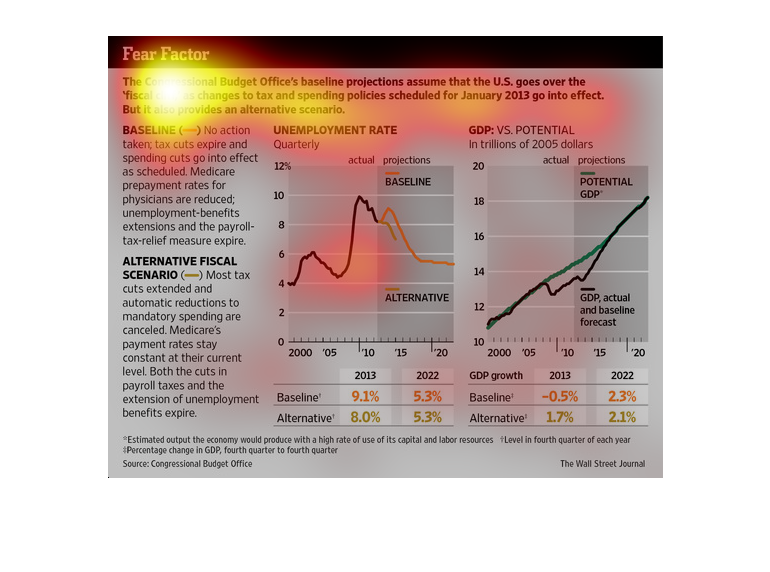
This chart describes fear factor. Specifically, the congressional budget office's baseline
projections assume that the U.S. goes over the fiscal cliff.
This Wall Street Journal study reports that the goverment has predicted the economic state
of the Union all the way through to the year 2020. Though the graphic is filled with information,
speculative scenarios more often than not are useless because they cannot predict the future
100%
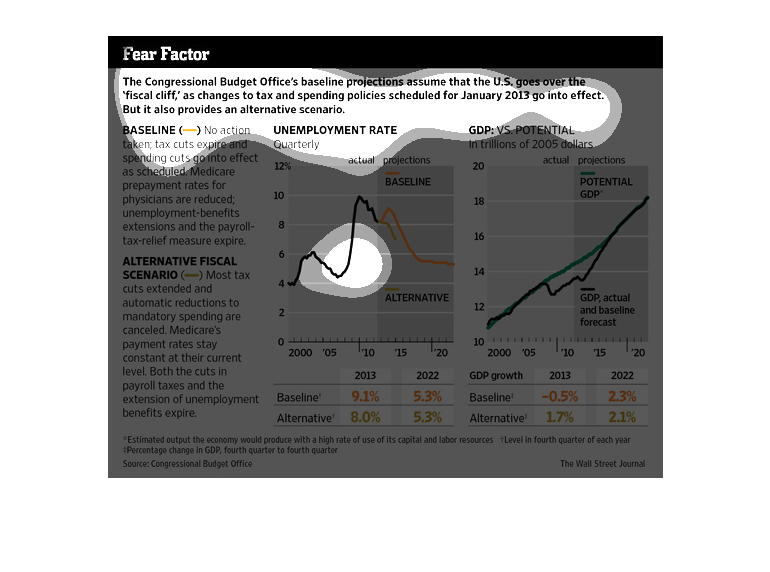
This is a collection of graphs detailing Congress' predictions on how the economy would have
played out between 2013 and 2023, based on a baseline, and an alternative proposed plan. Their
plan would have lowered unemployment and increased the GDP.
basically a graph of the financial economical status of the us. taxes are changing, and our
spending habits seem to have maybe increased, so that may affect us
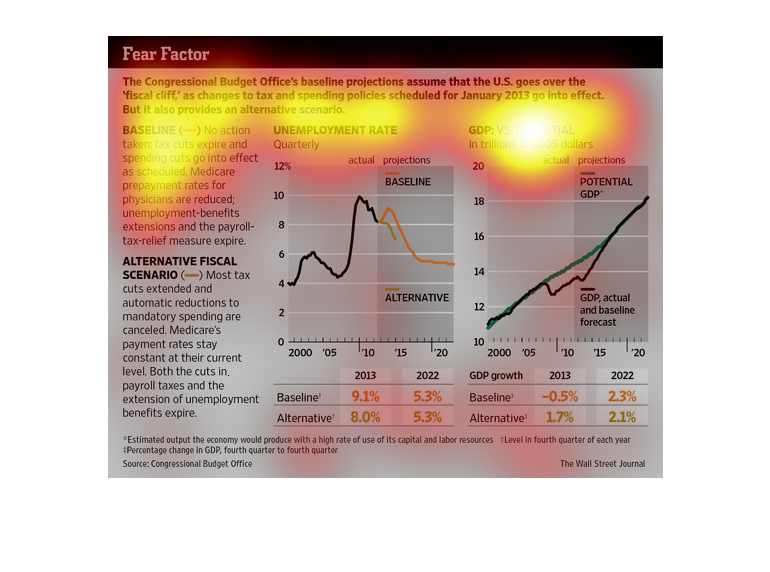
This chart describes fear factor. Specifically, the congressional budget office's baseline
projections assumes that the U.S. goes over the "fiscal cliff".
This graph illustrates several factors contributing to fear about budget deficit in the US
including the US unemployment rate, the GDP versus potential, and alternate fiscal scenarios.
This is a series of statistics and associated charts/graphs depicting the CBO's projections
assume the the US goes over the "fiscal cliff" as changes to tax policy go into effect.
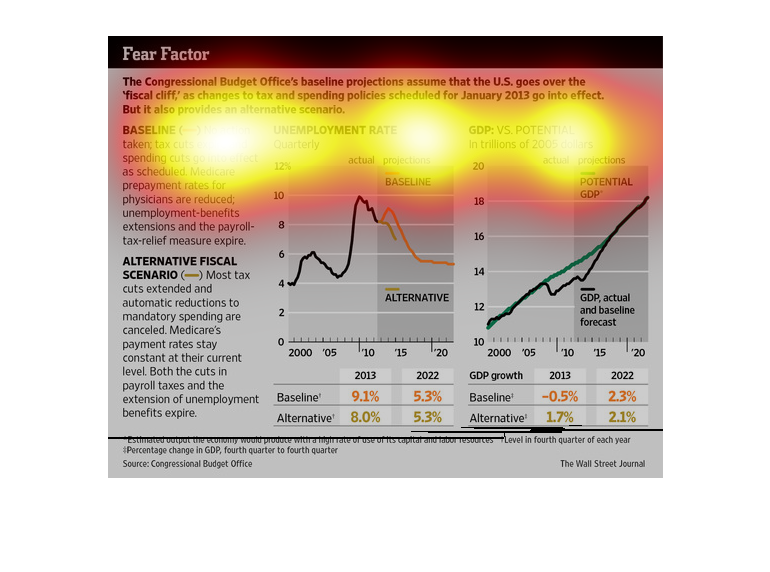
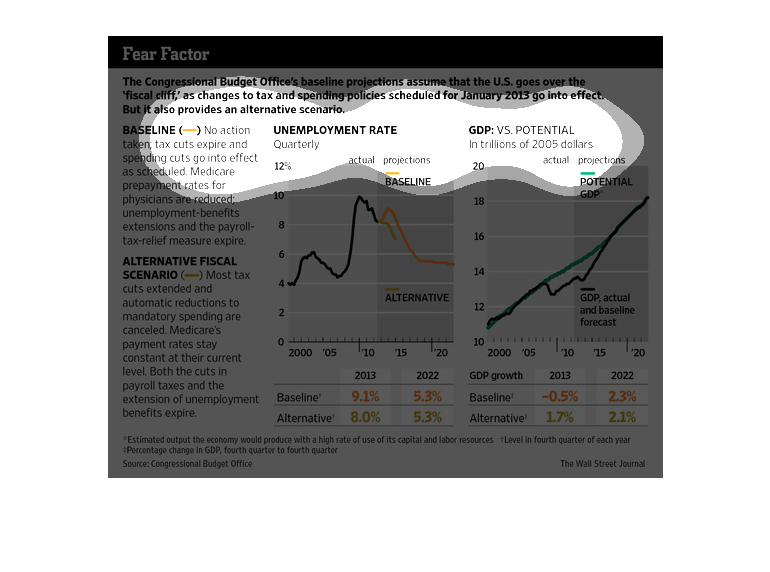
There are two different graphs depicted--a baseline and an alternative fiscal scenario. The
baseline graphs shows how the Congressional Office's baseline projections, assuming that the
U.S. goes over the fiscal cliff, as changes in tax policies of January 2013 go into affect.
The alternative fiscal scenario shows a different result with a different approach.
The following chart shows how the United States was going to go off the fiscal cliff if something
isn't done. In order to avert doing this policies must be changed.