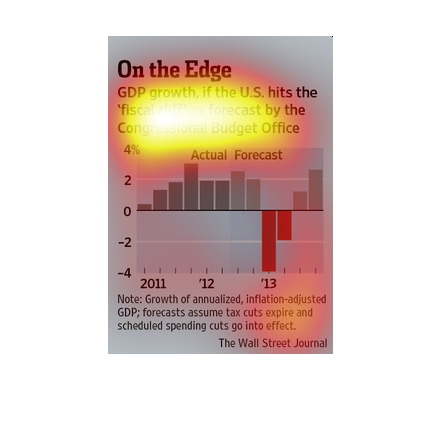
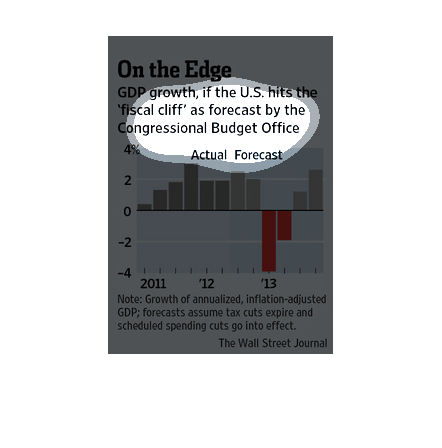
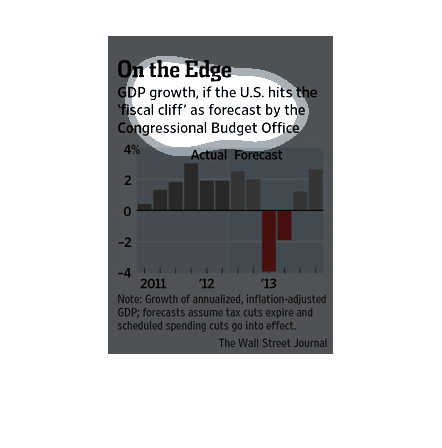
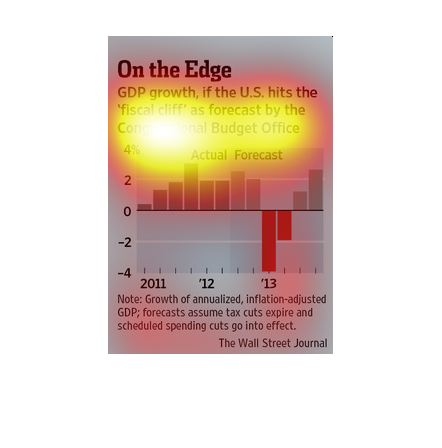
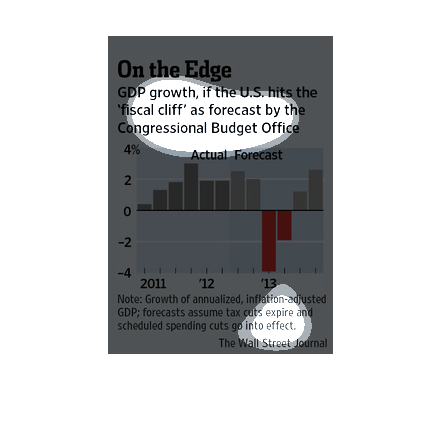
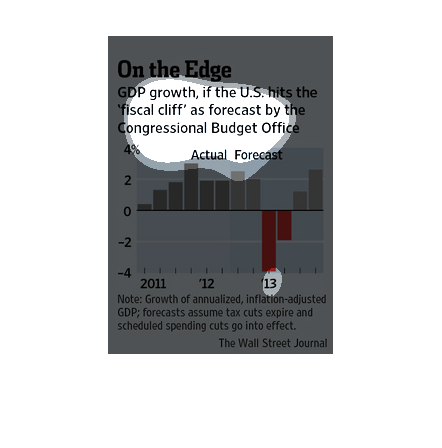
This graph details the Actual GDP forecast taking into consideration the 'fiscal cliff' brought
to attention by the Congressional Budget Office. The graph details a period of short growth,
then stagnation, before falling substantially in early 2013 due to expiration of tax and scheduled
spending cuts then leads into a recovery towards the end of 2013.
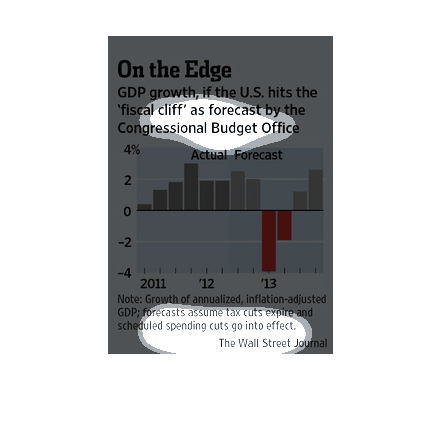
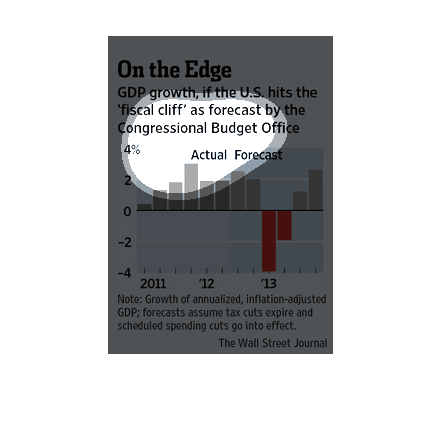
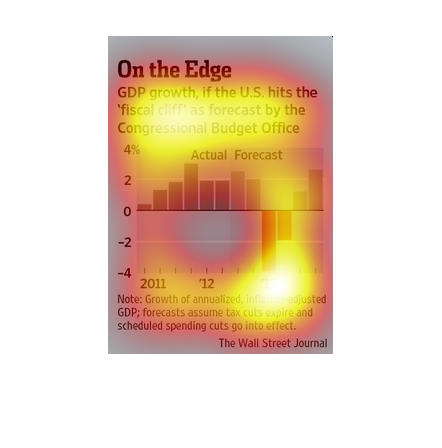
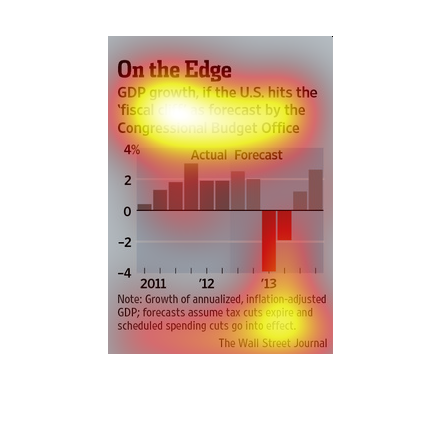
The graph is a bar graph that shows the growth of US GDP in the years 2011-2013.  The red
bar shows a decline in GDP in the year 2013.  The graph is made from data from the US Congressional
Budget Office.
This was a study done in 2011 predicating that if there wasn't a bit of control on spending
then it would mean a great deal of trouble for the American people. Luckily that did not come
to pass.
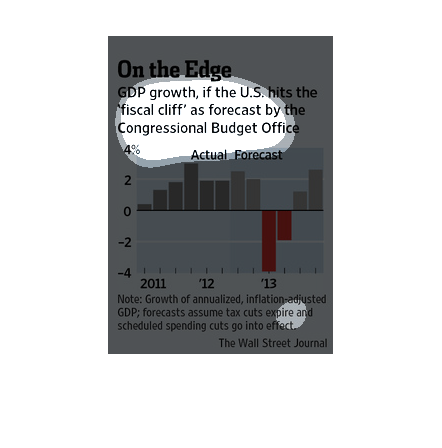
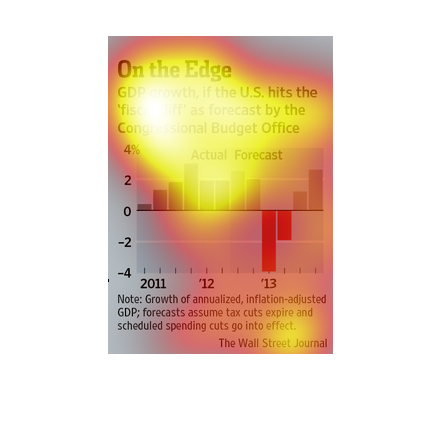
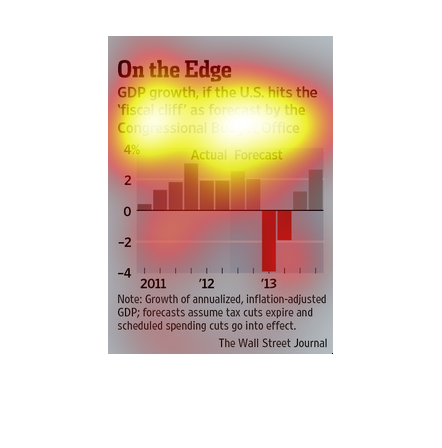
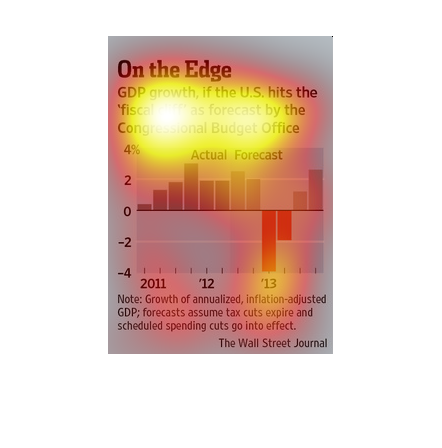
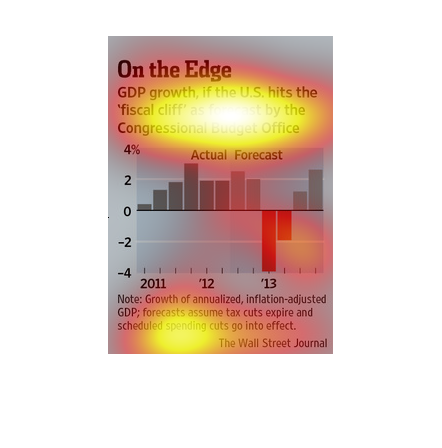
This chart describes on the edge. Specifically, GDP growth, if the US hits the fiscal cliff
as forecast by the congressional budget office. The chart covers 2011 through 2013.
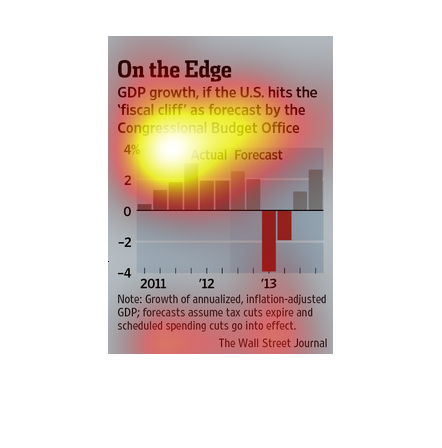
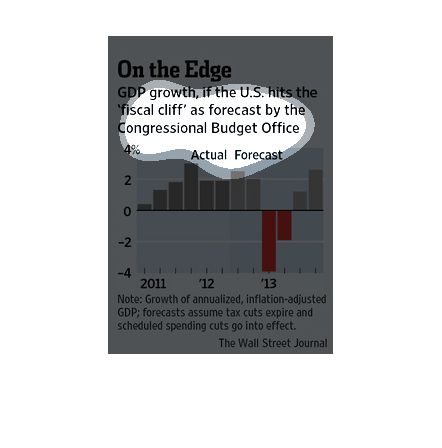
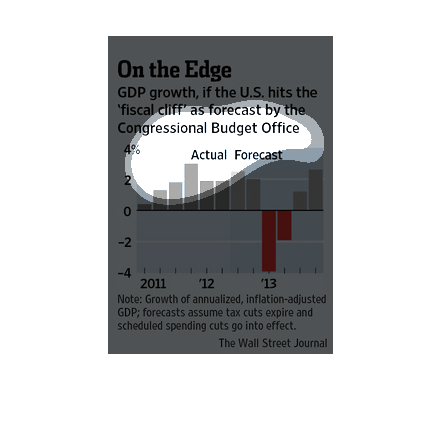
The title for this graph and subheading read, "On the Edge, GDP growth if the US hits the
fiscal cliff as forecast by the Congressional Budget Office".   There's a bar graph reflecting
this corresponding data from 2005-2013
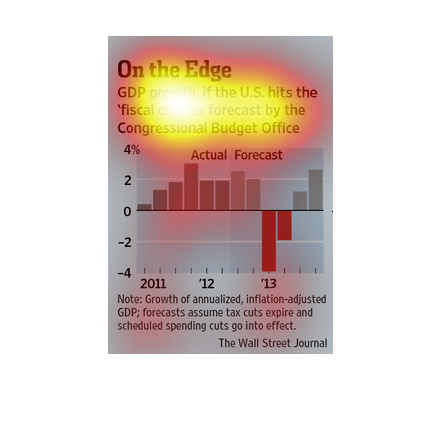
This shows the GDP growth if the USA hits the fiscal cliff as forecasted by the Congressional
Budget group. The graph shows the GDP growth dropping dramatically upon hitting the fiscal
cliff.
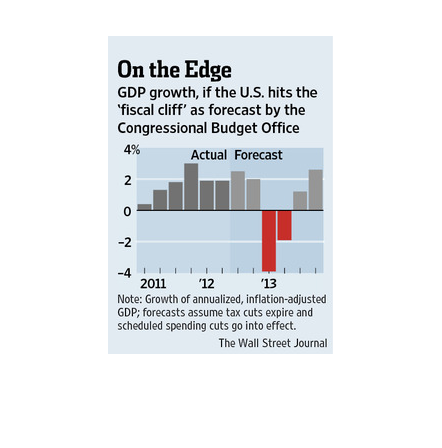
In contrast to most other years in the United States, GDP fell in 2013. Whereas most years
see increases in GDP of around 2%, in early 2013 GDP fell off a "fiscal cliff" and showed
losses of about -4%.
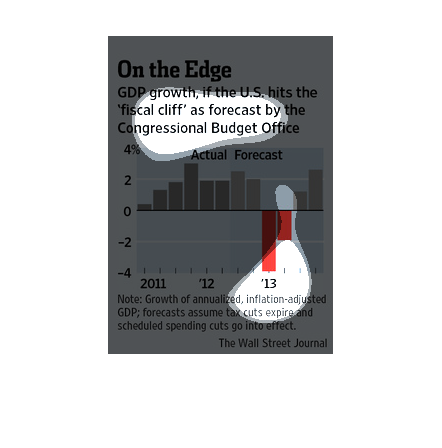
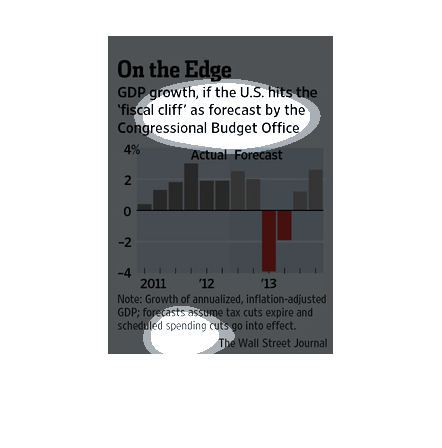
This chart shows the GDP growth, if the U.S. hits the fiscal cliff as forecast by the Congressional
Budget Office. The range is from 4 percent to negative 4 percent.
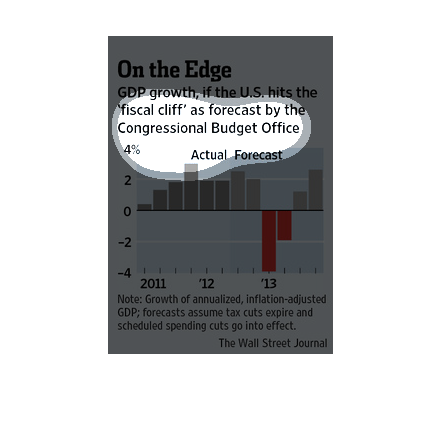
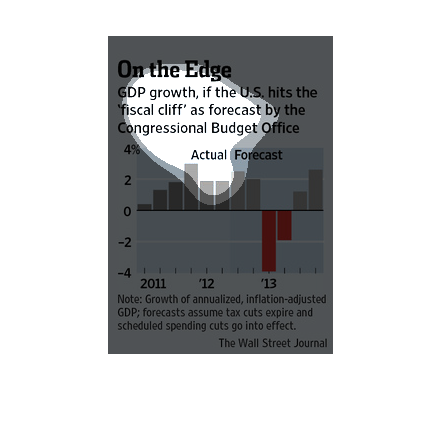
The image depicts GDP growth if the US hits the fiscal cliff as forecast by the Congressional
Budget Office. Based on the data, GDP growth forecast will constrict rather than increase,
if the US goes over the 'fiscal cliff'.
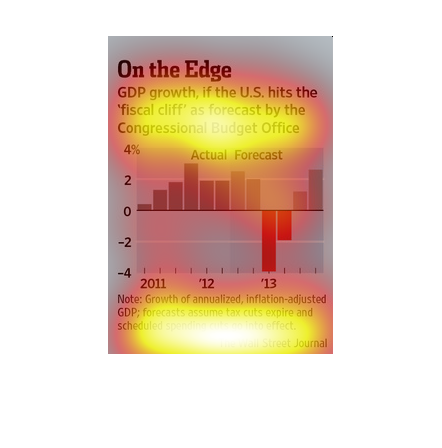
This chart shows GDP growth if the US this the "fiscal cliff" as forecast by the Congressional
Budget Office.  It has figures from 2011 to 2013 with actual and forecast.
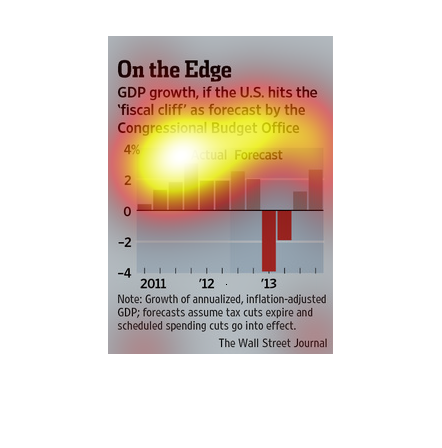
This chart shows the GDP growth of the U.S. if the country hits the "fiscal cliff" according
to the CBO. It shows the inflation adjusted growth of the country. It shows a steep 3% and
2% decline in the years immediately following, followed by a slight rebound less than 2%.
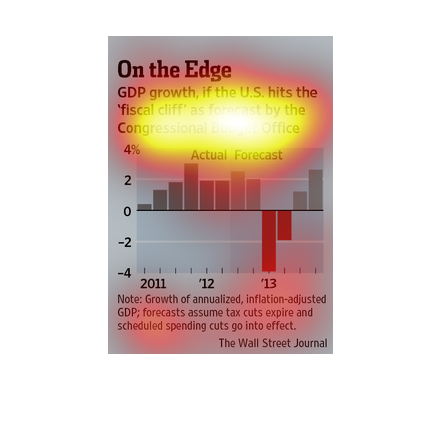
This chart describes on the edge. Specifically, GDP growth, if the U.S. hits the "fiscal cliff"
as forecast by the congressional budget office. Chart contains re and gray colors.
This is a simple series of bar graphs depicting GDP growth if the United States hits the fiscal
cliff as previously forecast by the Congressional Budget Office.
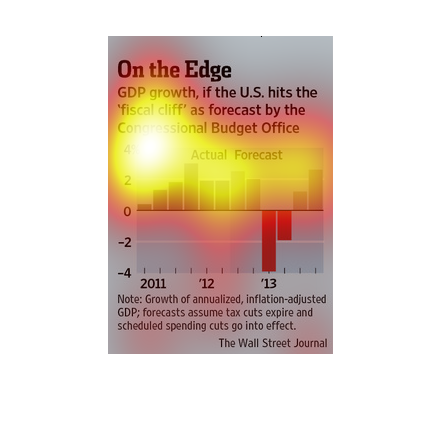
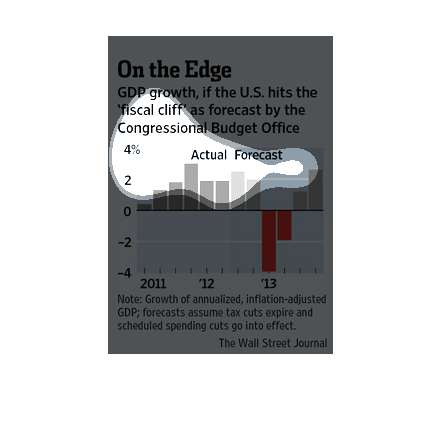
The following chart shows how much GDP would have dropped if the United States would have
fell off the fiscal cliff and new borrowing measures where not put into place.