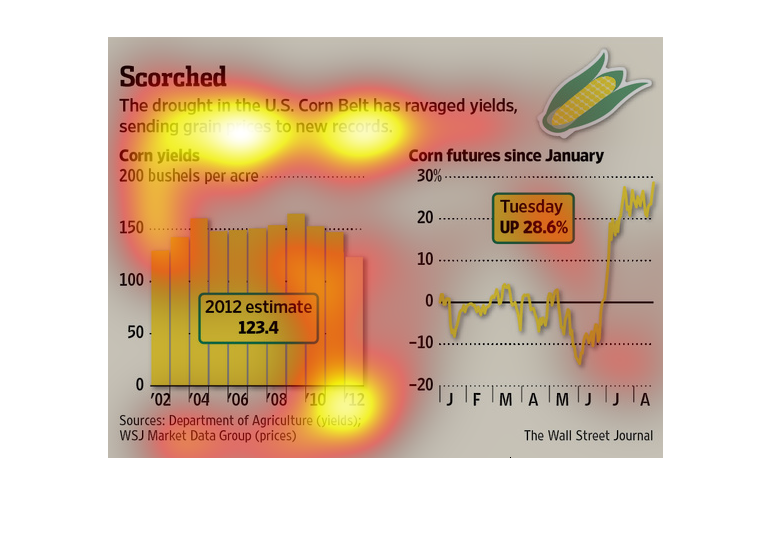
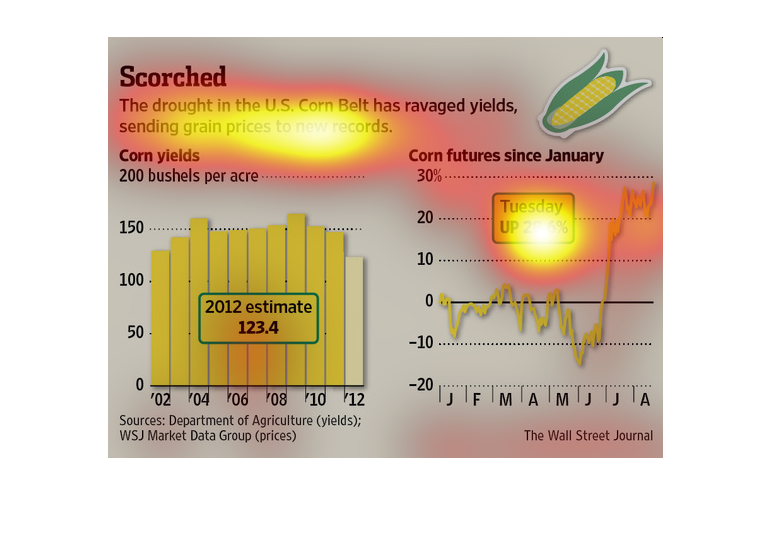
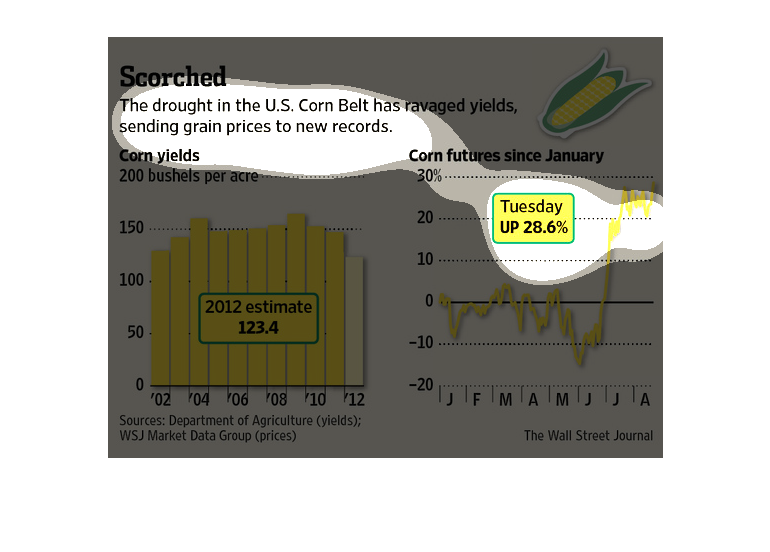
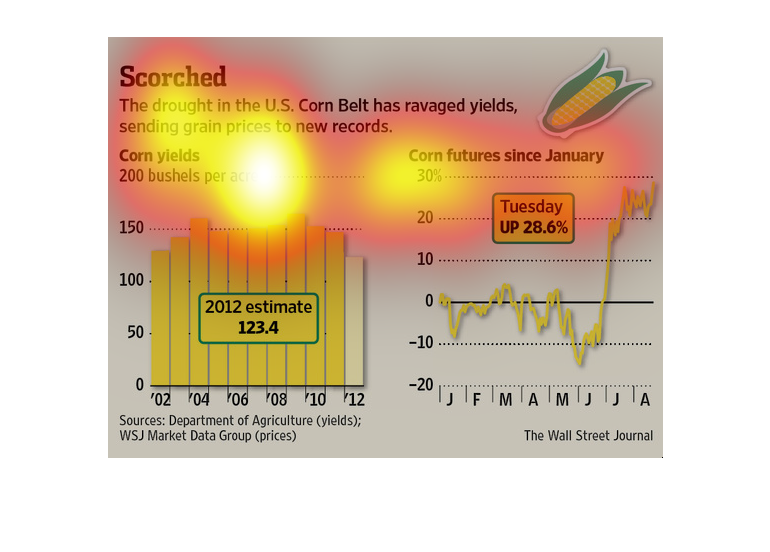
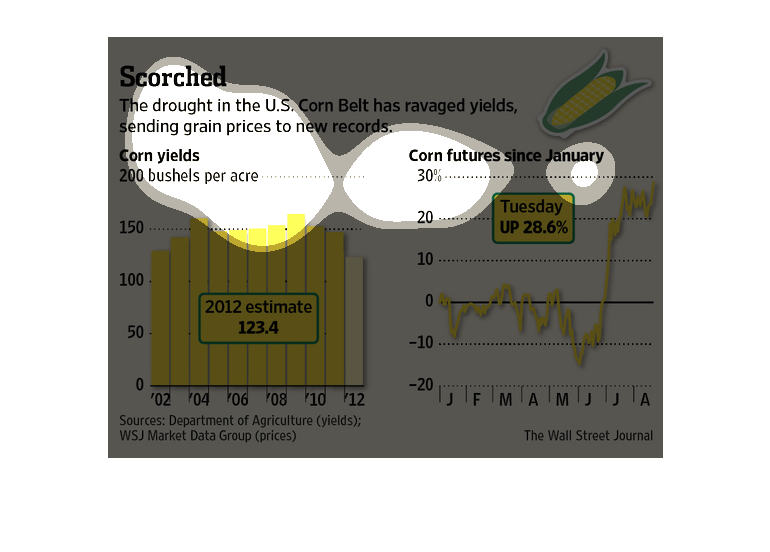
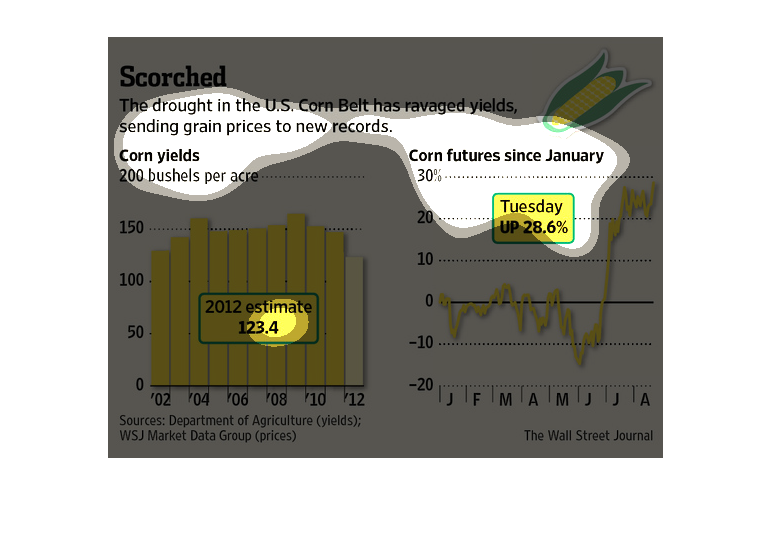
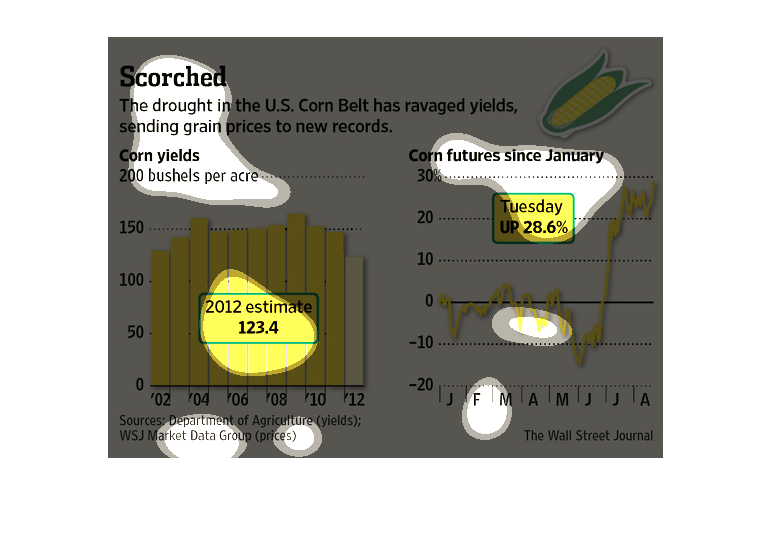
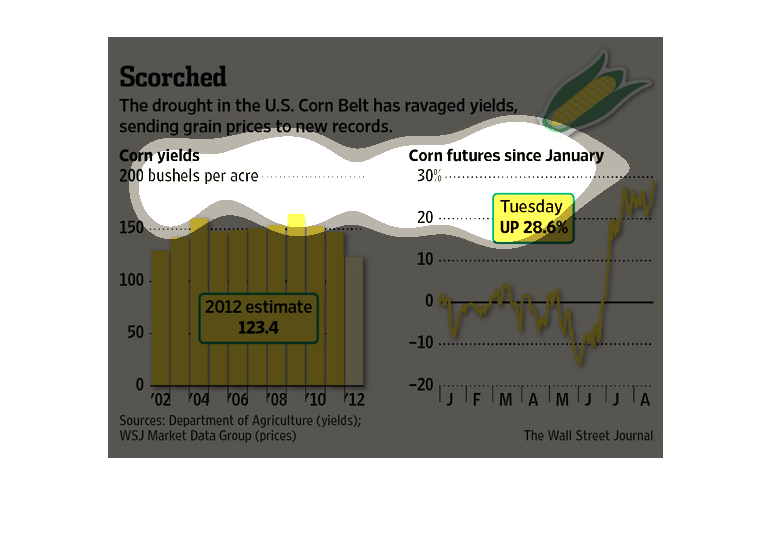
This chart is about corn and how drought is causing increases in corn prices.  It shows corn
yields from 2002 to 2012 and corn futures rising over time.

An infographic chart showing the drought in the Midwest and its effects on the prices of corn
and grains in general. Shows a huge spike in corn futures.
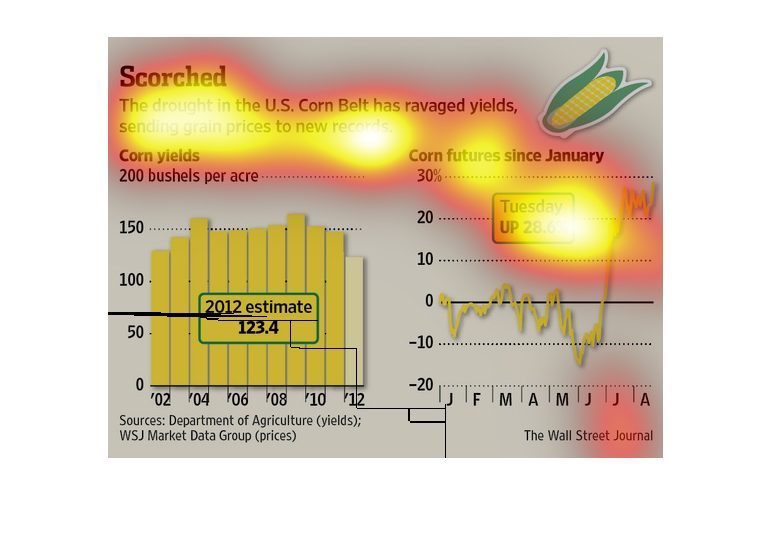
The graph is depicting the drought in the US corn belt for 2012.  They are estimating a 123.4
corn yield per every 200 bushels. This is thus sending grain prices to record highs.

Corn is very expensive this days; at least that is what this study is trying to inform us.
The graph expertly showcases the drought affecting prices; the cause and effect is quite apparent.
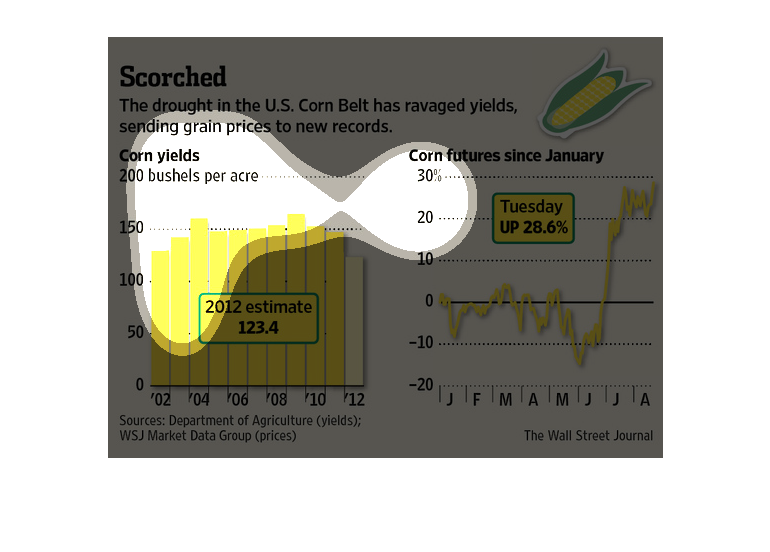
The image depicts the drought in the US corn belt ravaging corn yields, the outcome of which
increases grain prices to and forces them up to record highs. Prices rose 28.6% within a single
week.
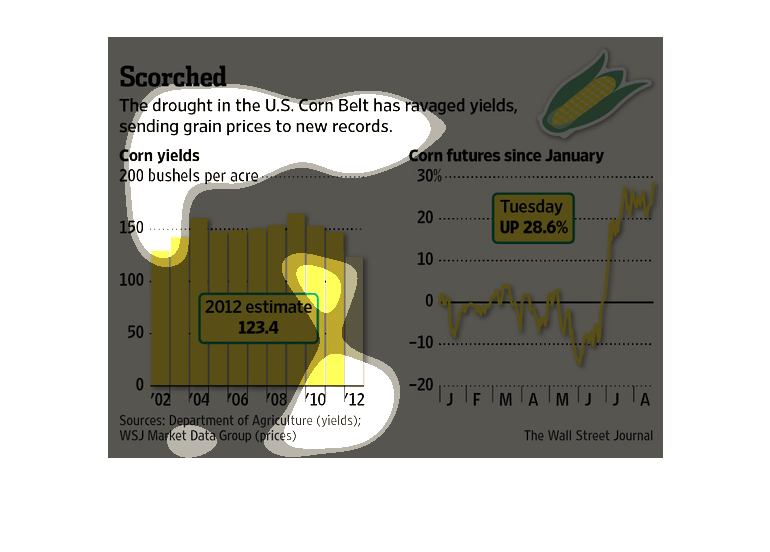
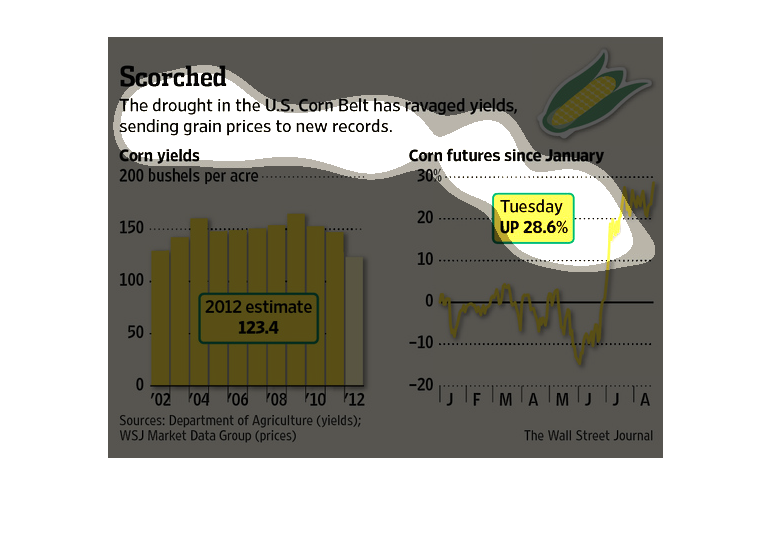
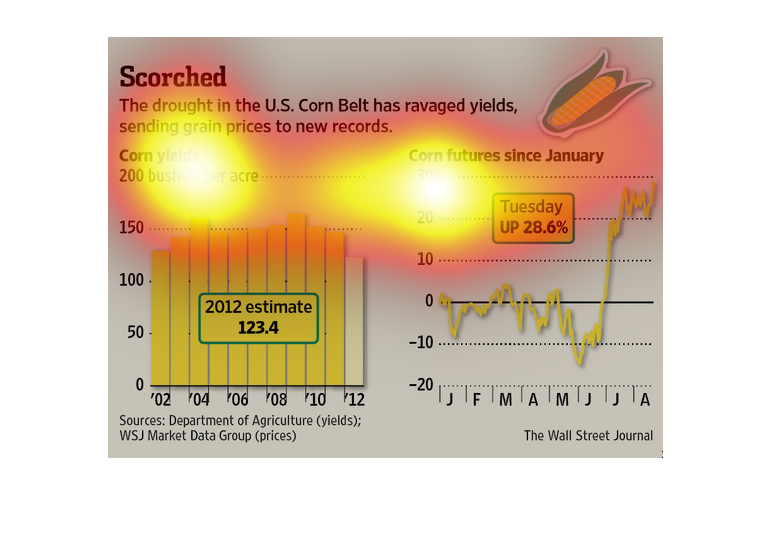
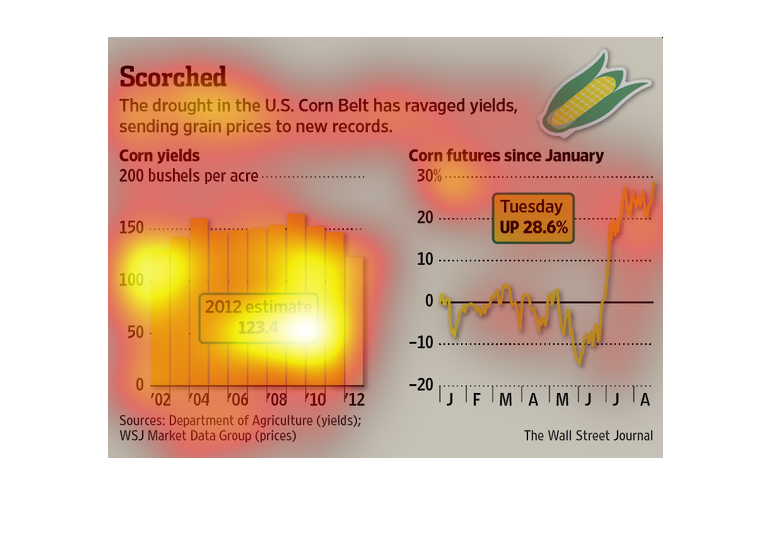
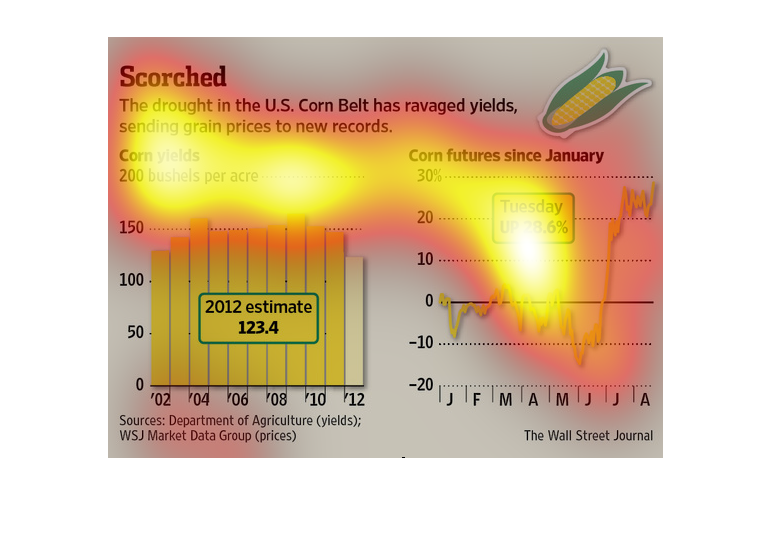
scorched. this is a description of the drought in the united states corn belt. also it describes
how the drought has damaged crop yields, and now prices are at a high
This chart describes scorched. Specifically, the drought in the U.S. corn belt has ravaged
yields sending grain prices to new records. The chart includes illustrations.
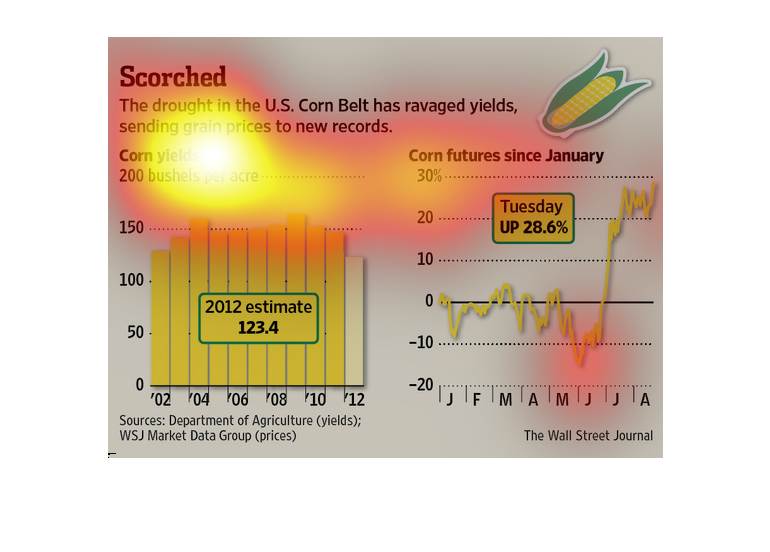
There is a chart from the Department of Agriculture that shows the amount of bushels per acre.
The second chart shows the amount they can produce in the future.
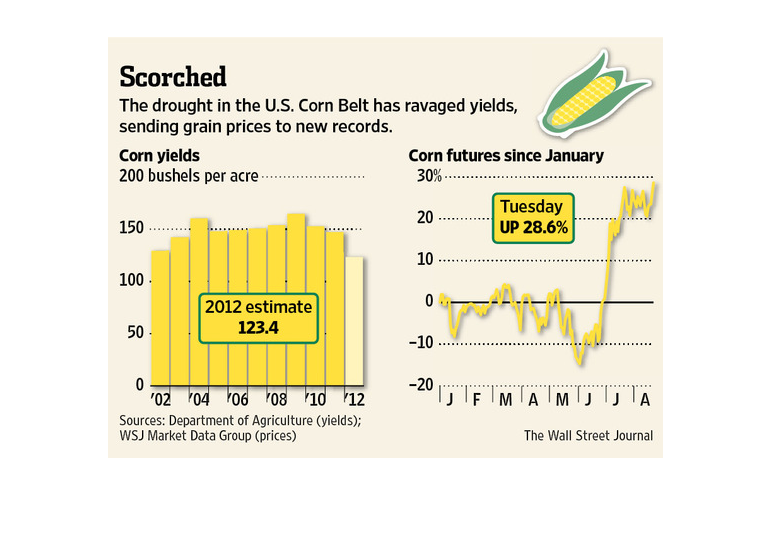
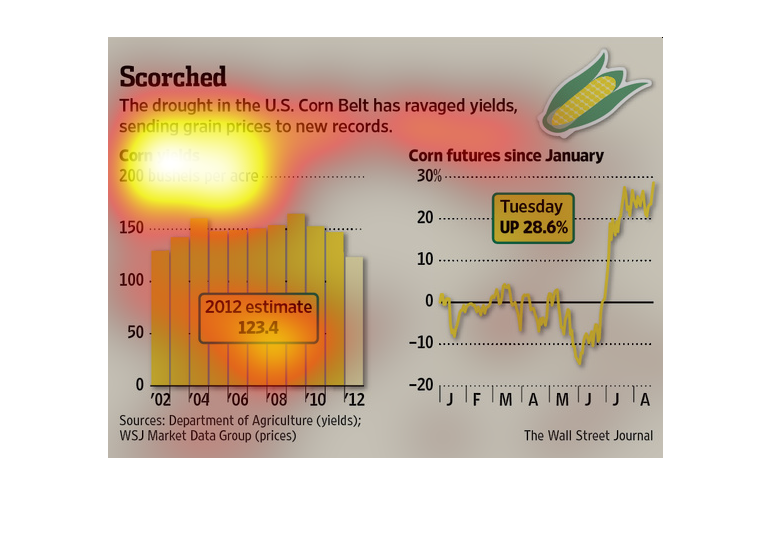
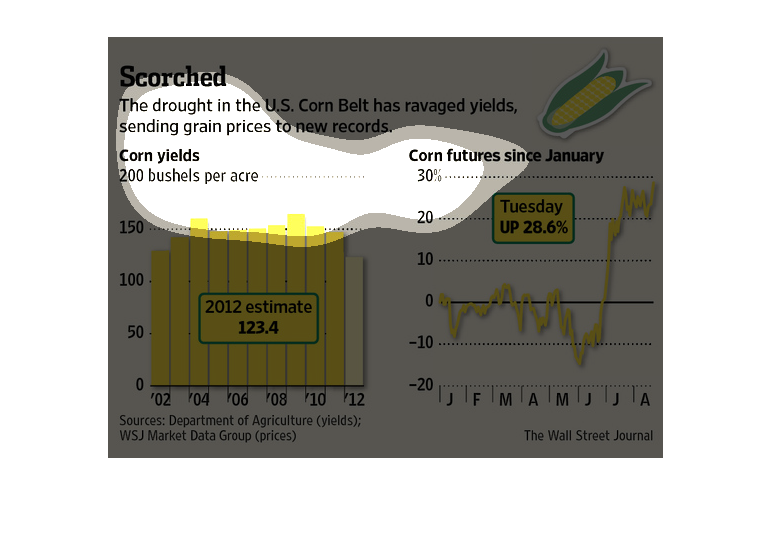
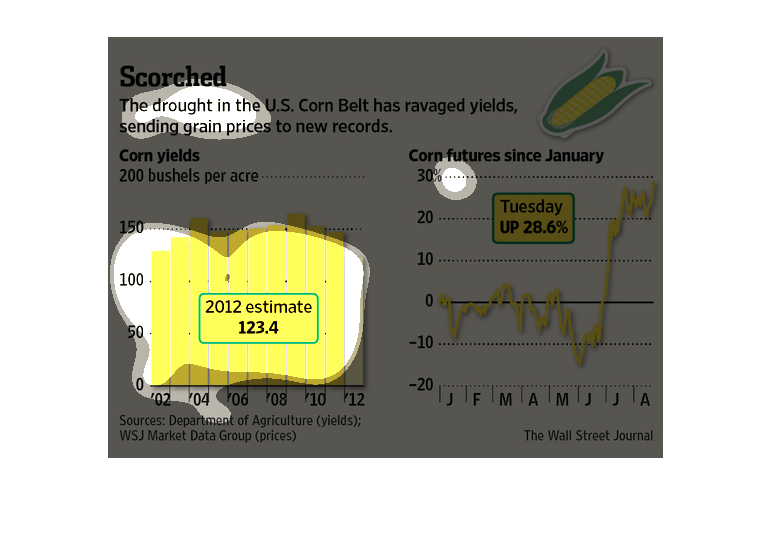
This is a series of charts and graphs depicting the drought in the United States Corn Belt
has ravaged yields, sending grain prices to new record highs.
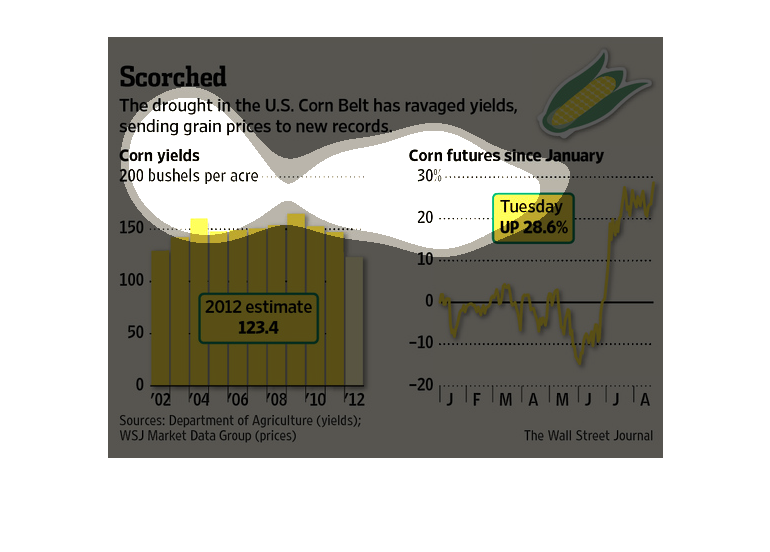
This chart sites information from the Department of Agriculture and the Wall Street Journal
on the impact of droughts on yearly harvests of corn. Focusing on the year 2012, it demonstrates
an increase in corn as drought conditions resolved.
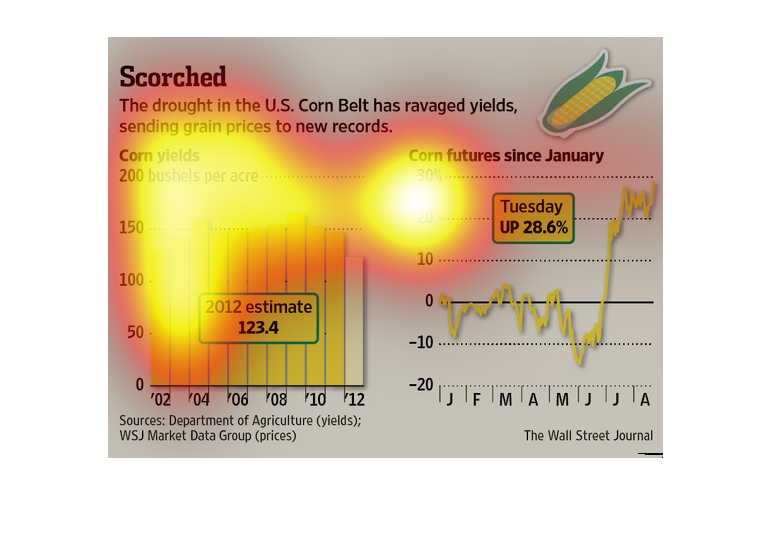
Graph concerns the drought in the US corn belt and how to affected yields as well as futures
in the industry. It seems to suggest that low yields are going to result in higher prices
and a large upward spike in futures.
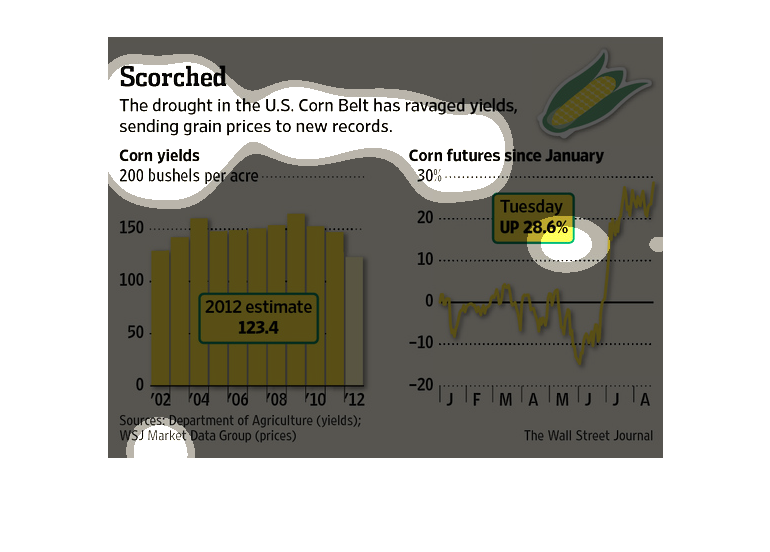
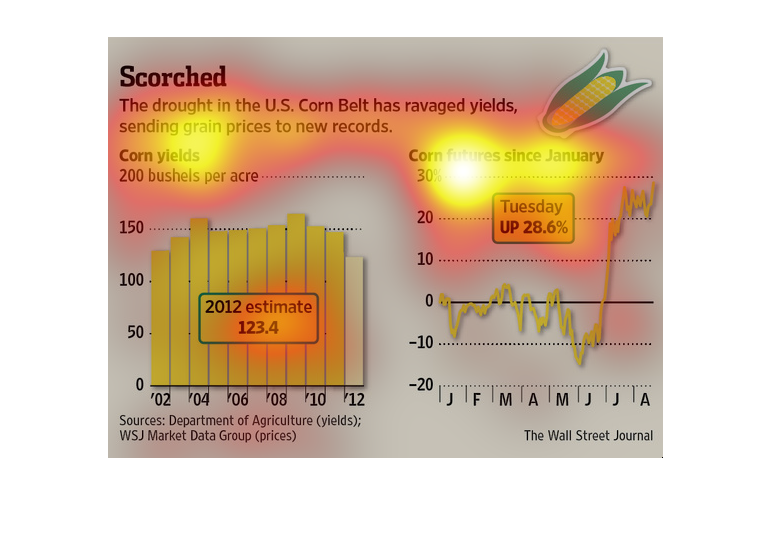
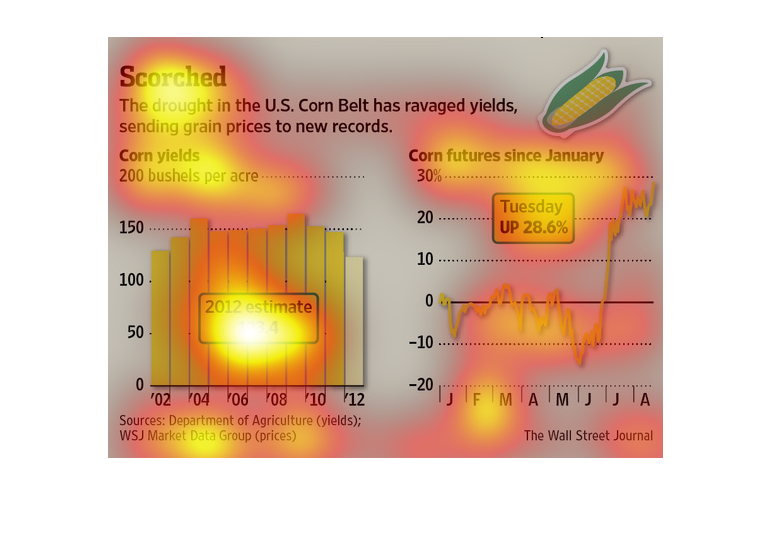
This is a series of charts and related statistics depicting that the drought in the United
States corn belt had ravaged yields, sending grain prices to new records.
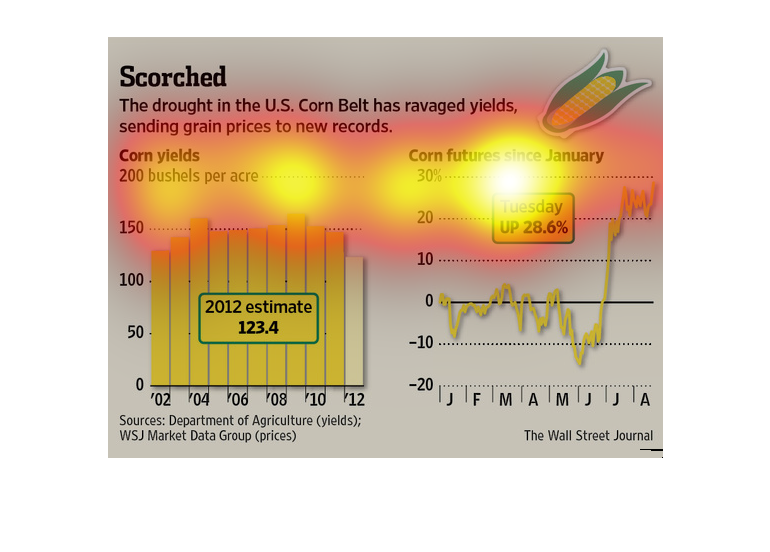
This chart describes scorched. Specifically, the drought in the US corn belt has ravaged yields,
sending grain prices to new records. Categories include corn futures.
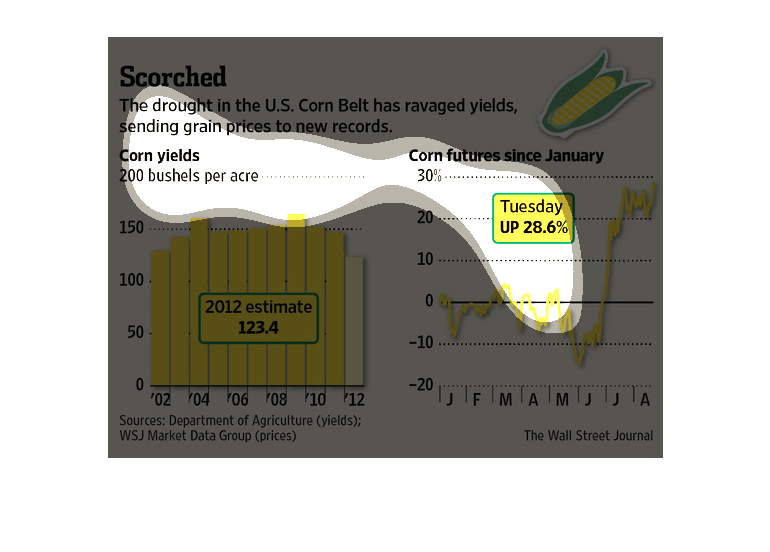
The following chart shows how the drought in the plain states of the United States of America
sent corn prices to sky rocket. Due to the drought extremely low yields where produces.