This is a graph that  changes in compensation in recent years have varied for jobs in the
banking industries. The data shows that commercial loan officers received the most compensation.
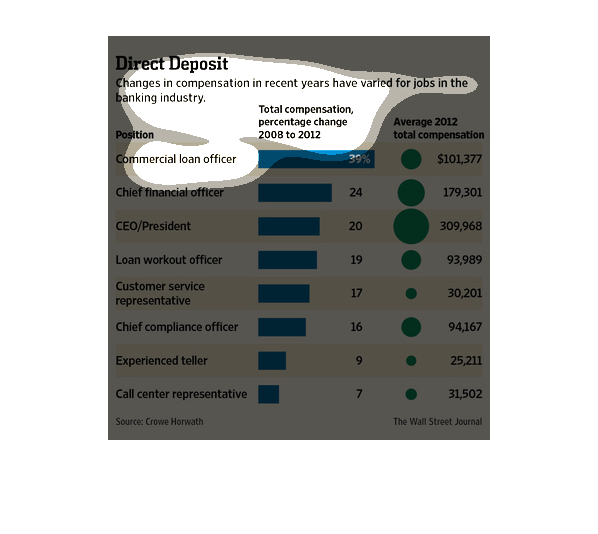
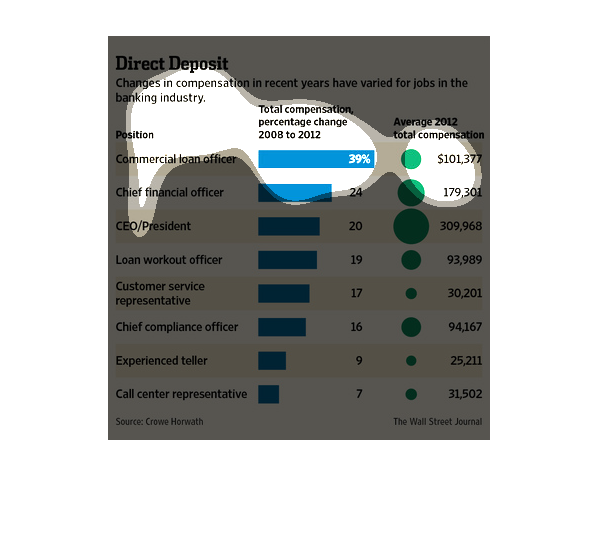
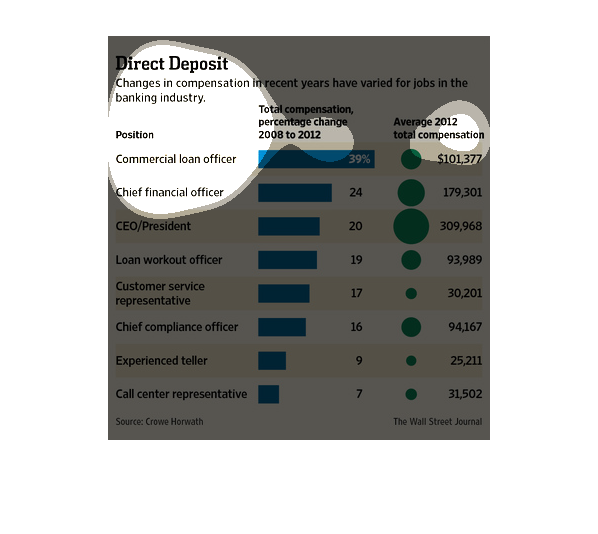
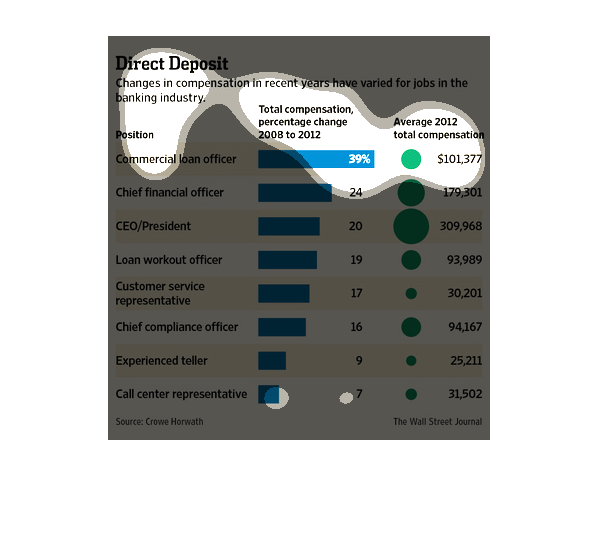
This is a series of graphs and statistics depicting that changes in compensation in recent
years have varied for jobs in the banking industry based on average 2012 numbers.
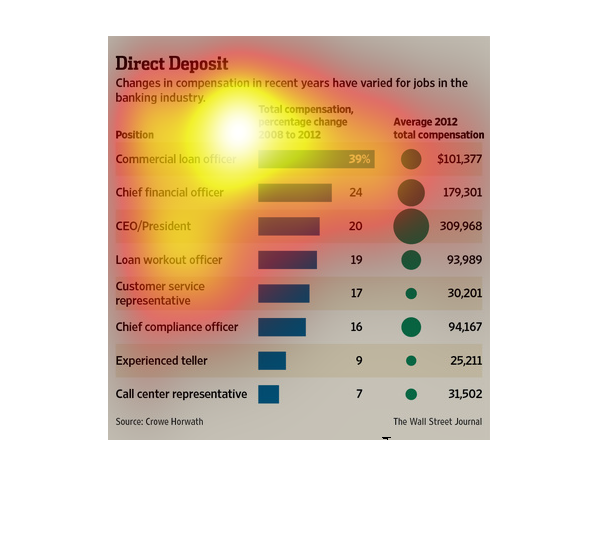
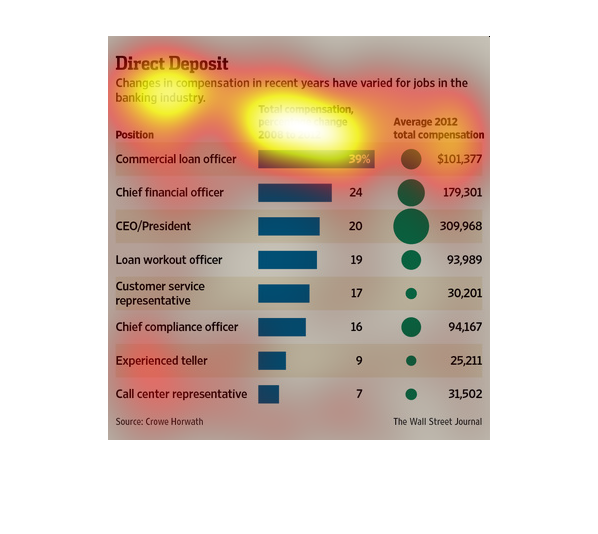
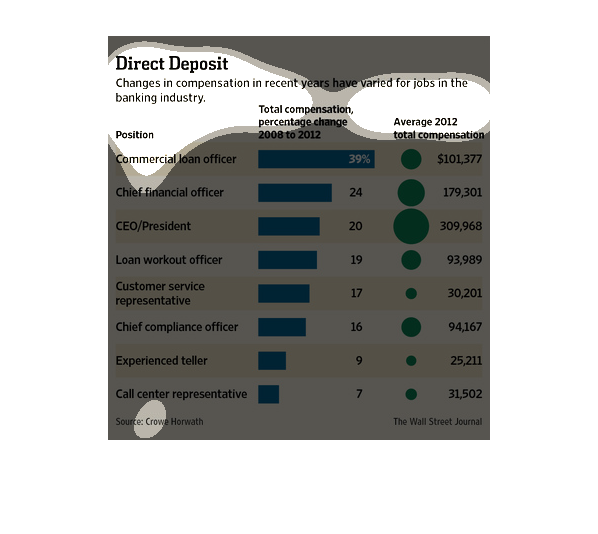
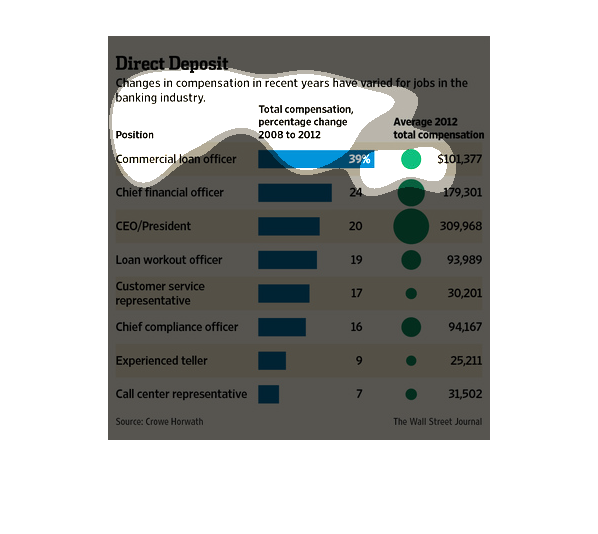
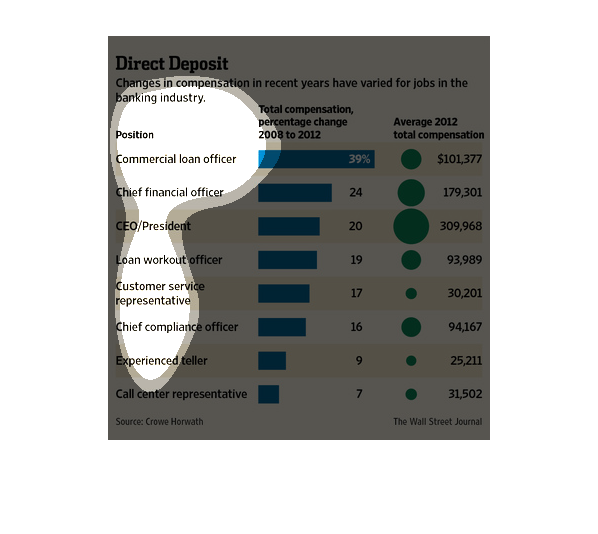
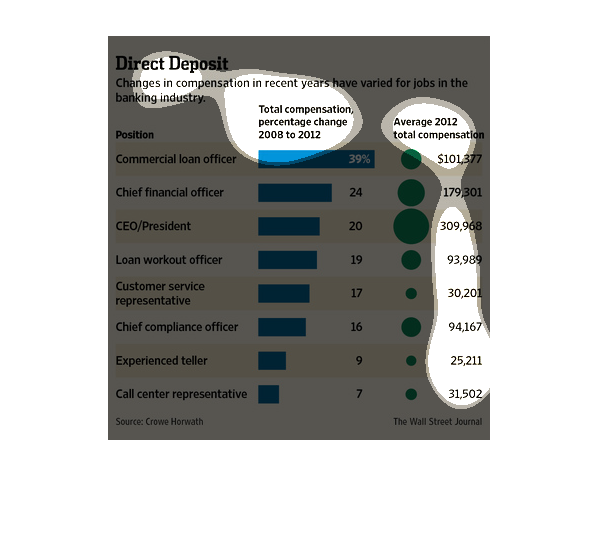
This graph illustrates the varied changes in compensation in the banking industry. Though
all have seen compensation increase, Commercial Loan Officers have seen the most dramatic
increase. The increase percentage isn't directly related to total compensation, although those
with the lowest compensation tended to have smaller increases.

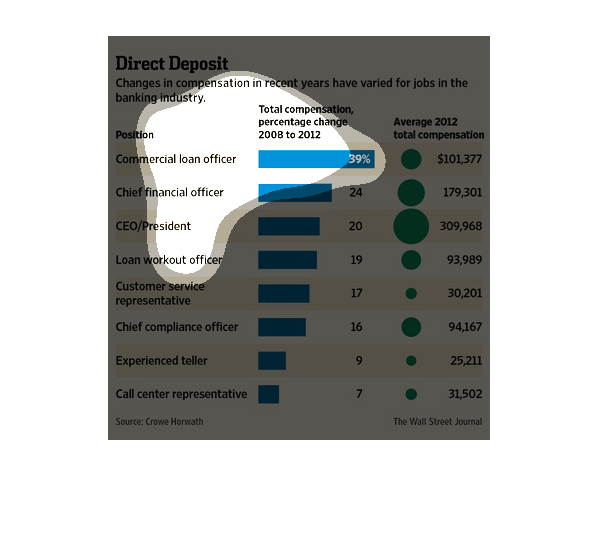
The graph is showing changes in compenstaion in the banking industry for various banking jobs.
The graph shows the average change in compensation and the total average compensation. Various
jobs in banking all seem to be experiencing increases in compensation.
Direct Deposit is a great way to pay employees and have them be content with their sum of
money. The fact that over the years business are starting to take that into consideration-
as this chart clearly states- it is a great step in the right direction.,
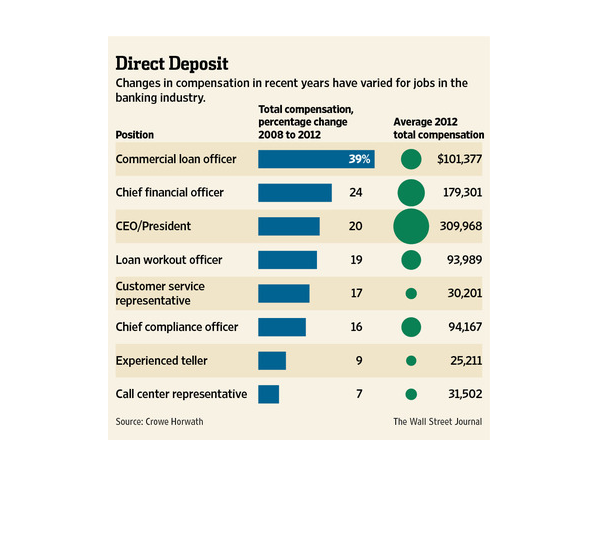
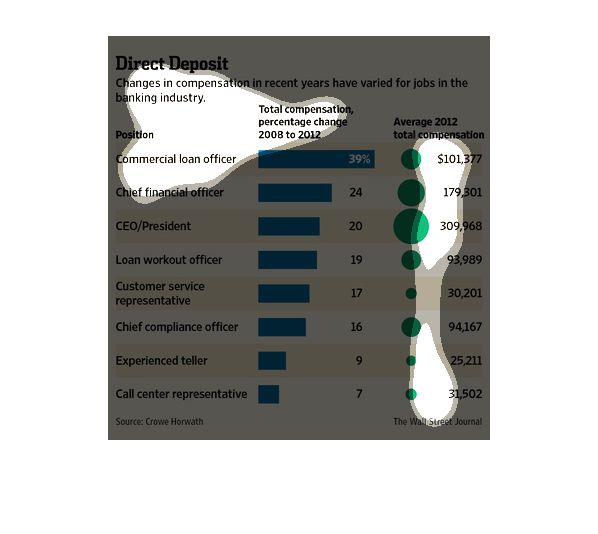
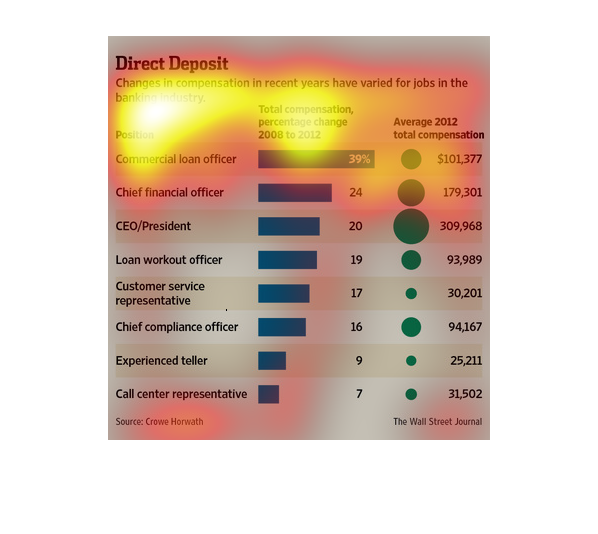
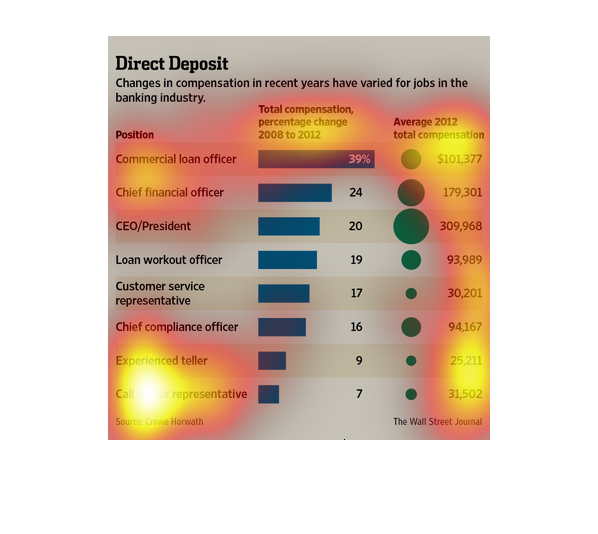
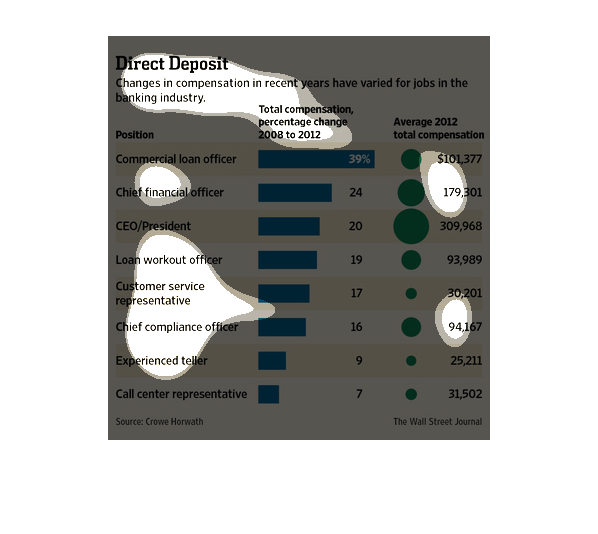
The graph shows changes in compensation in the banking industry. It compares compensation
changes across different levels of jobs. It looks at the total compensation percentage change
between 2008 and 2012 and compares that to the average compensation of 2008.
The image depicts the changes in compensation in recent years within the baking sector, based
on job tier. Commercial loan officers appear to make the most money, while call center representatives
make the least.
This is a series of bar graphs and related statistics depicting that changes in compensation
in recent years had varied for jobs in the banking industry.
This chart describes direct deposit. Specifically, changes in compensation in recent years
have varied for jobs in the banking industry. Categories include commercial loan officer.
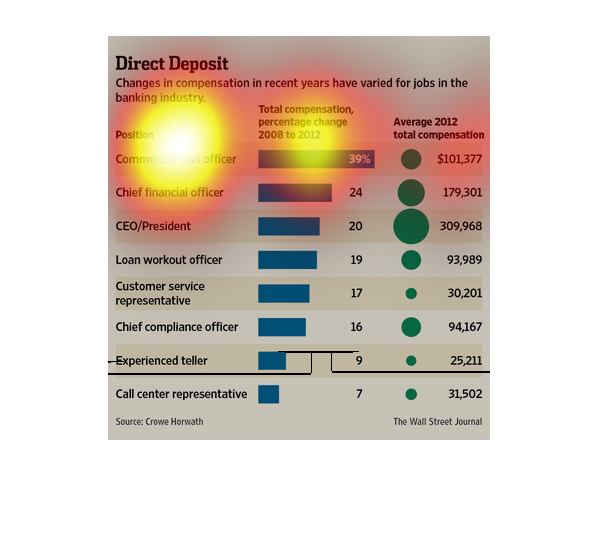
This chart breaks down the salary of bank workers by the positions that are held it shows
all positions from the basic teller and customer service positions to the ceo position
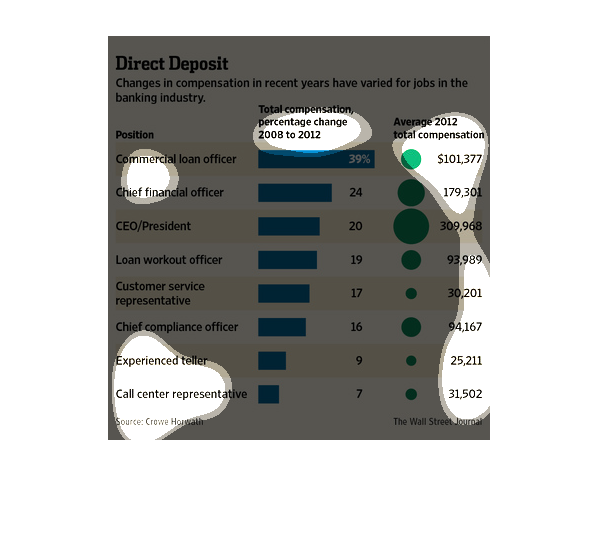
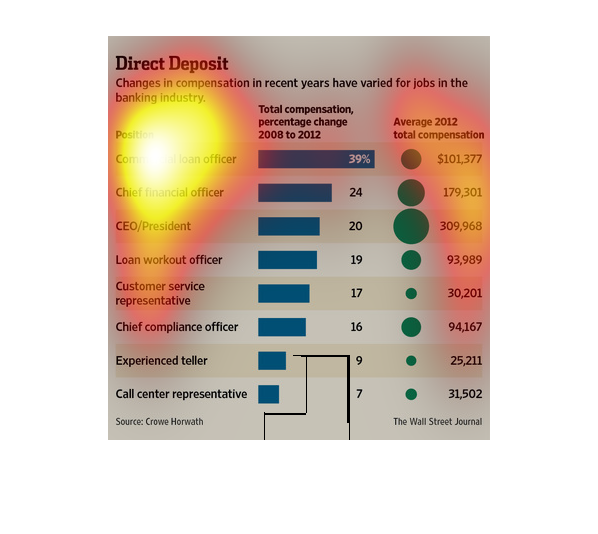
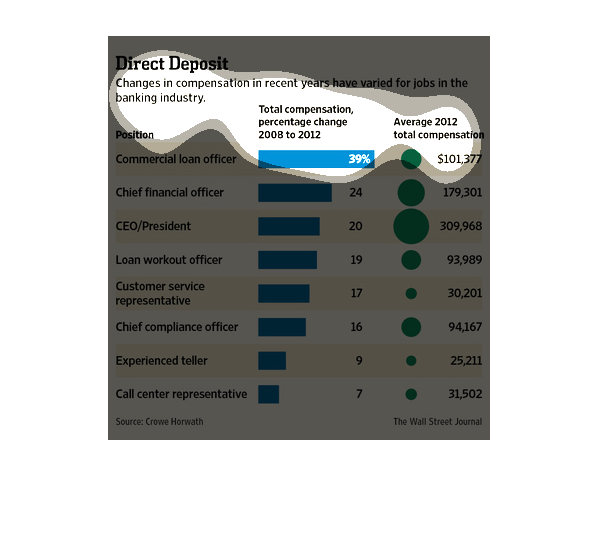
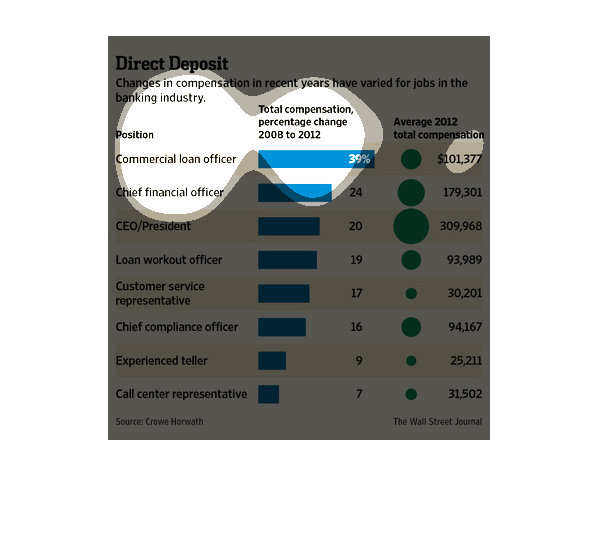
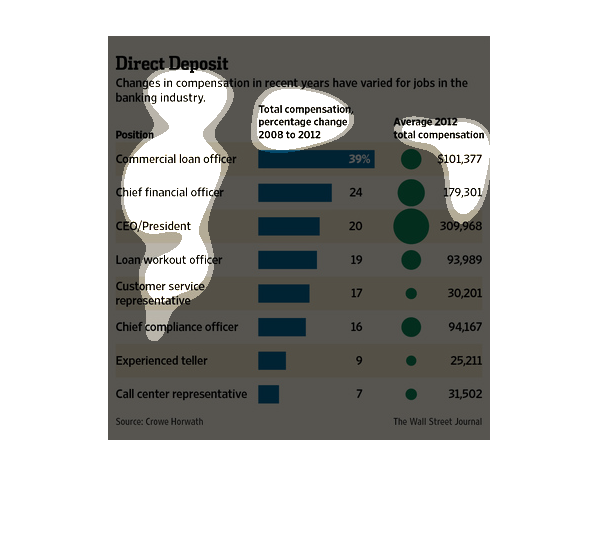
This graph details the relationship between jobs in the banking industry and direct deposit
compensation. The blue column details the total compensation percentage change from 2008-2012,
indicating that commercial loan officers have had the largest increase at 39%, while call
center representatives have had the smallest increase, at 7%. The green column details the
average 2012 total compensation; here, CEO/Presidents have the greatest composition at an
average of $309,968, while experienced tellers have the least at an average compensation of
$25,211.
This chart shows changes in compensation in recent banking history.  It shows total compensation
percentage change from 2008 to 2012 and average 2012 compensation.
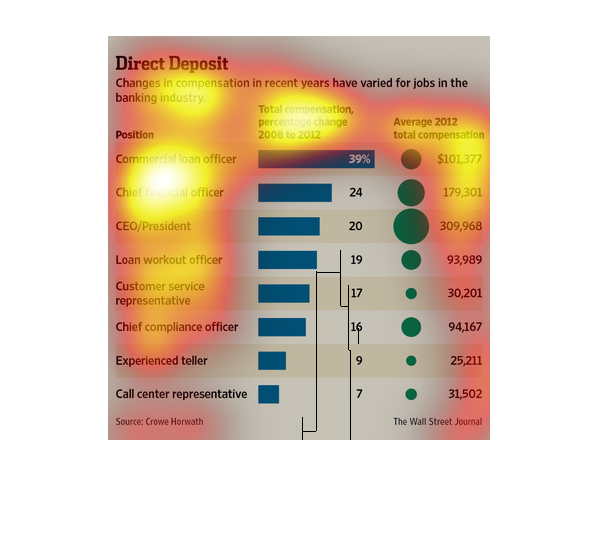
The following chart shows the changed in compensation for different bank employees in the
United States with Those near the top of the pecking order receiving the highest increases
in Salary.
This chart describes direct deposit. Specifically, changes in compensation in recent years
have varied for jobs in the banking industry. Categories are represented by different colors.
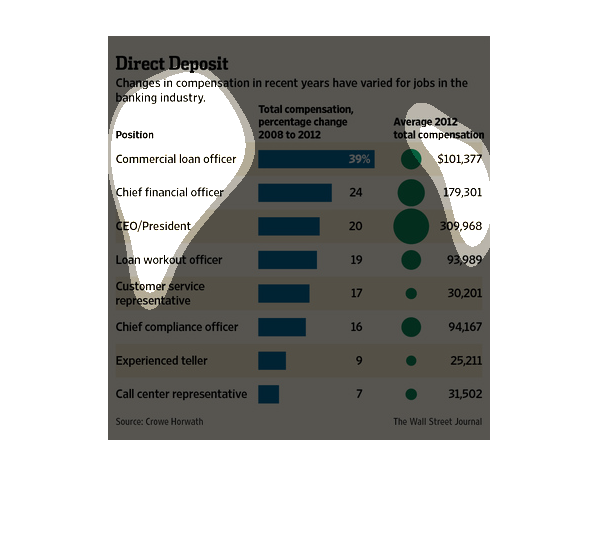
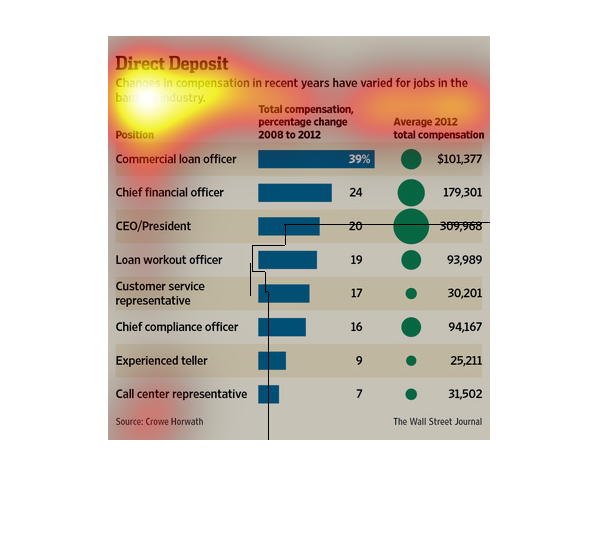
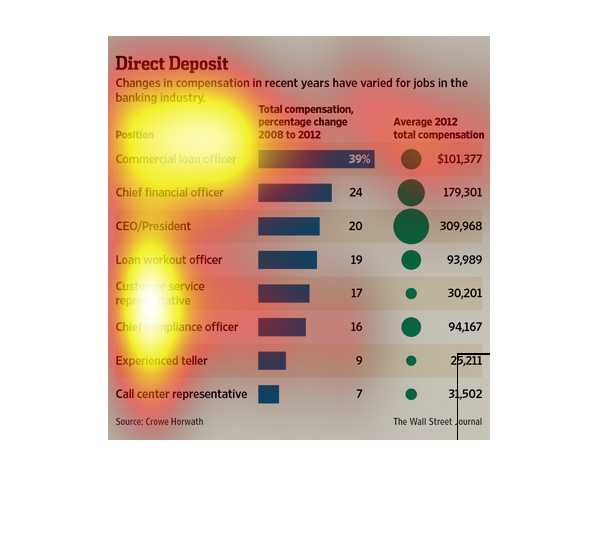
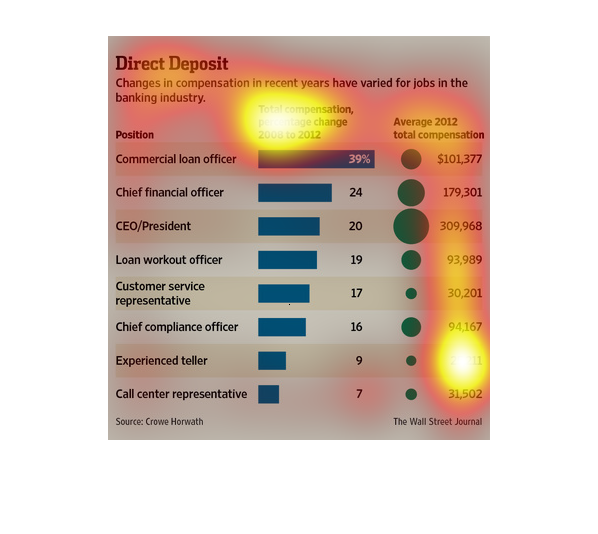
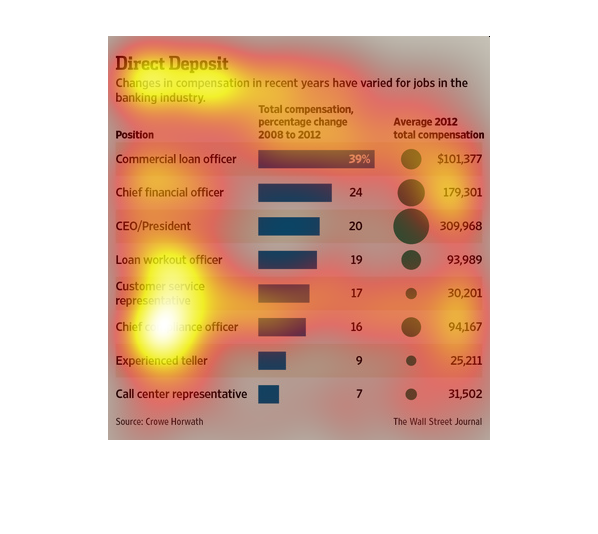
This chart compares compensation given to different positions in the banking industry. Commercial
loan officers have seen a 39% increase between 2008-2012, average 2012 compensation $101,377.
Experienced bank tellers have only seen an increase of  9% and make an average of $25,211.

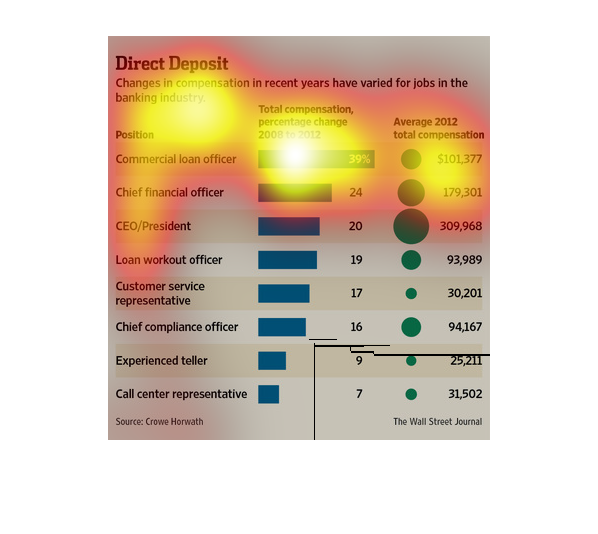
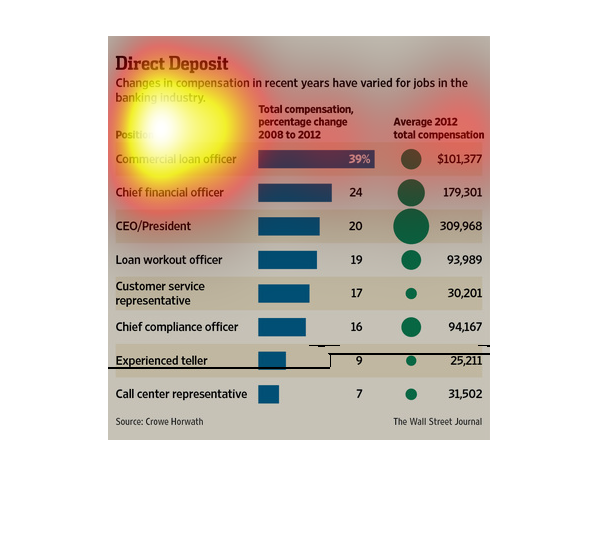
This chart shows that for jobs in the banking industry, compensation has varied greatly. From
2008 to 2012, commercial loan officers have seen the greatest change while a call center representative
has seen the least change.