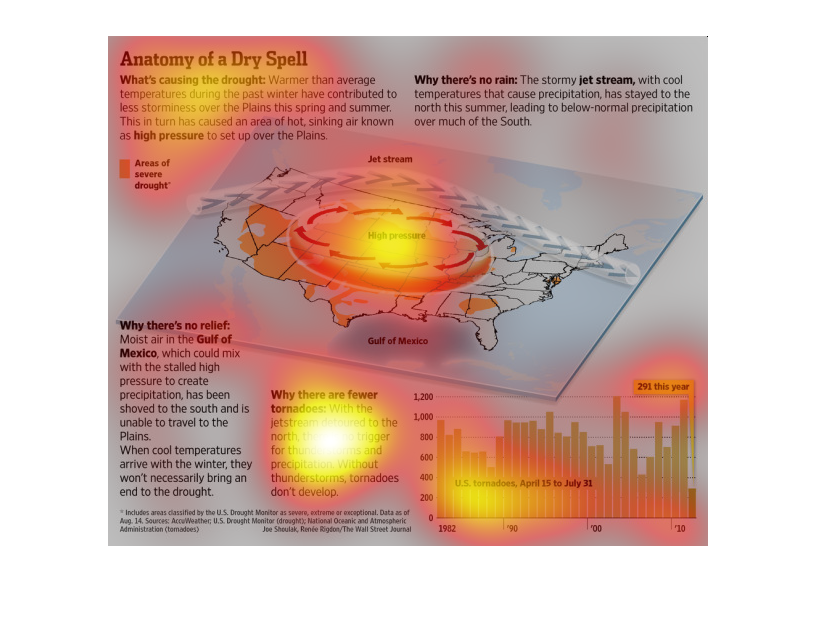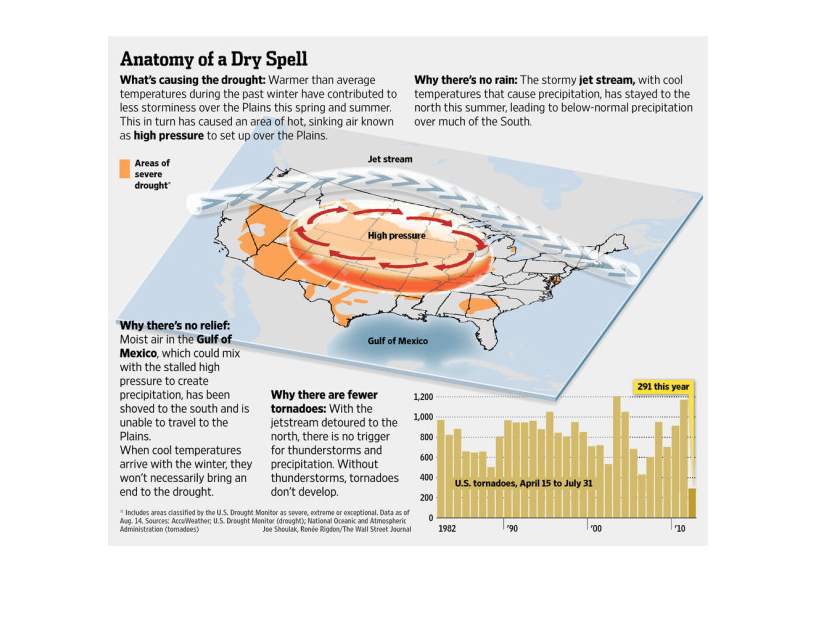
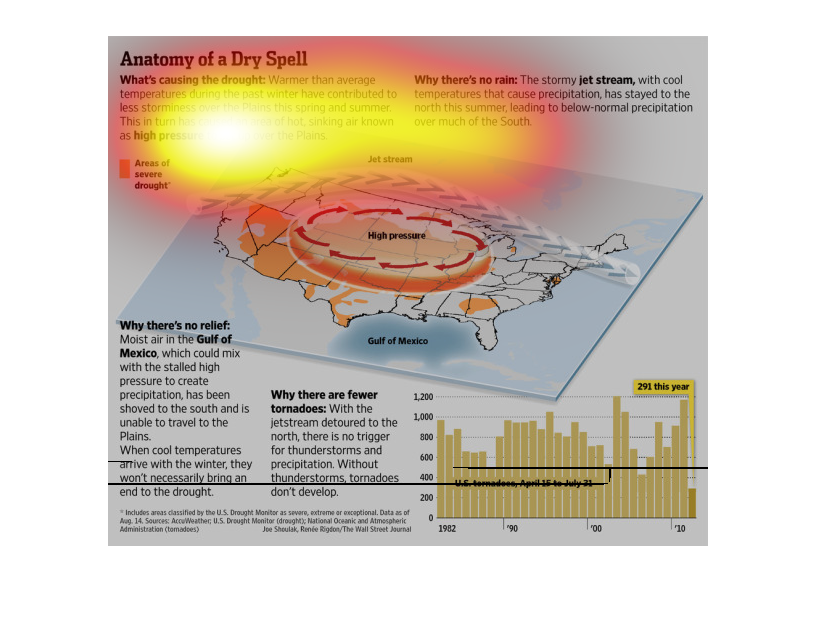
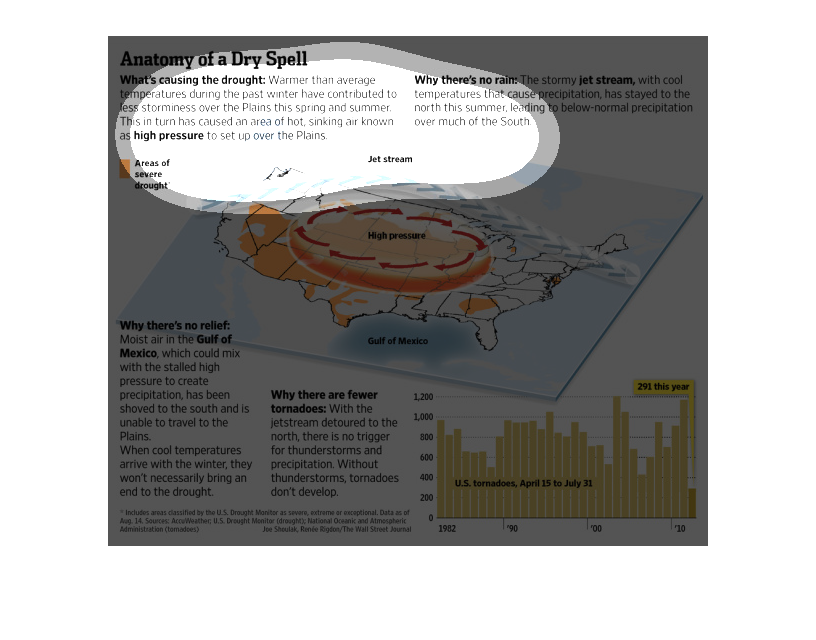
This chart describes anatomy of a dry spell. Specifically, what's causing the drought: warmer
than average temperatures during the past winter have contributed to less storminess over
the plains this spring and summer.
This chart describes anatomy of a dry spell. Specifically, what's causing the drought: warmer
than average temperatures during the past winter have contributed.
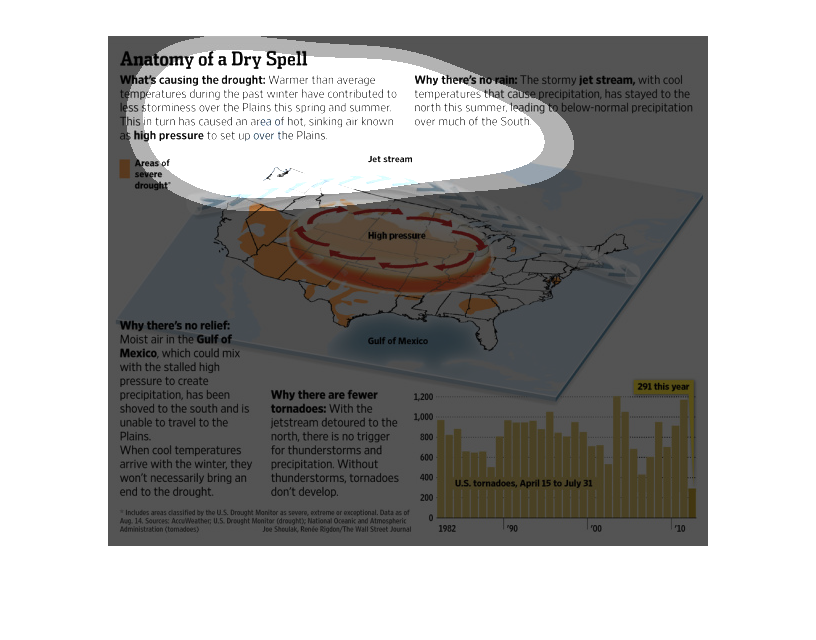
This is a map of the United States. It contains arrows and colors to show weather patterns
that cause droughts in the country. The map details how winds cause droughts and make them
persist.
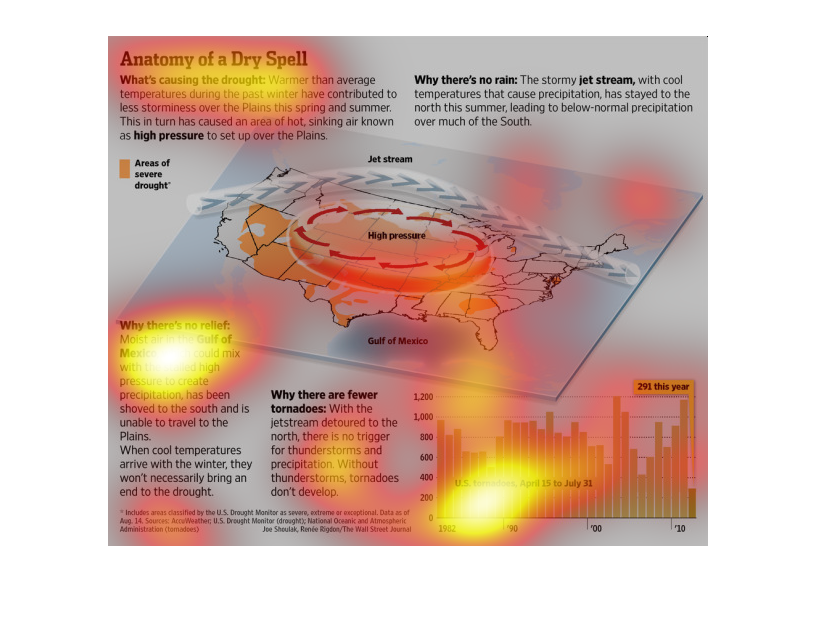
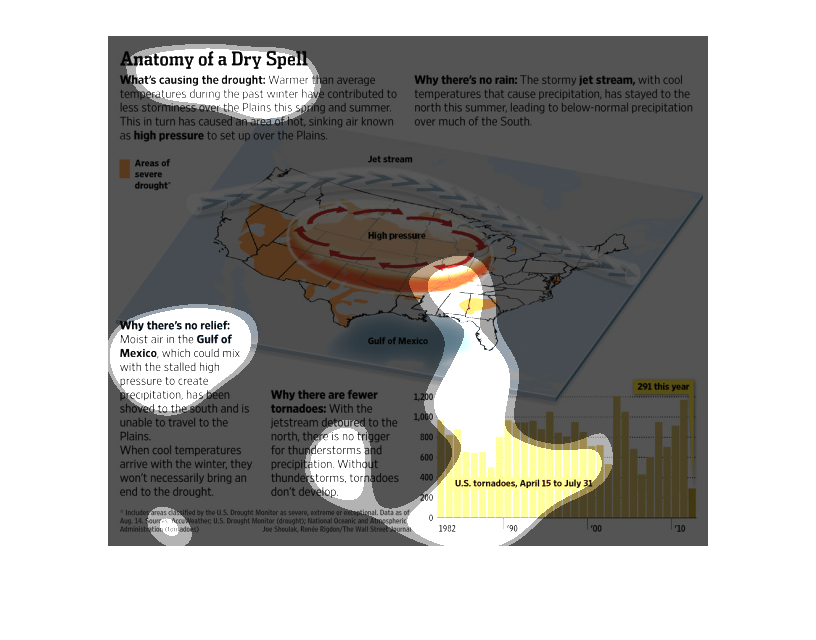
The following chart talks about how warmer than average temperatures and much lower rain caused
the drought in the plain states of the United States. It can be attributed to the Jet stream
staying further north than usual.
This chart describes what causes a drought in the US. It is a result of warmer than average
temperatures in the winter that subsequently causes an area of high pressure in the plains
region. There is no rain because the standard stormy jet stream then stays to the North in
the summer leading to lower than normal rainfall. There is no relief because moist air in
the Gulf of Mexico is unable to travel north and all this leads to tornadoes.
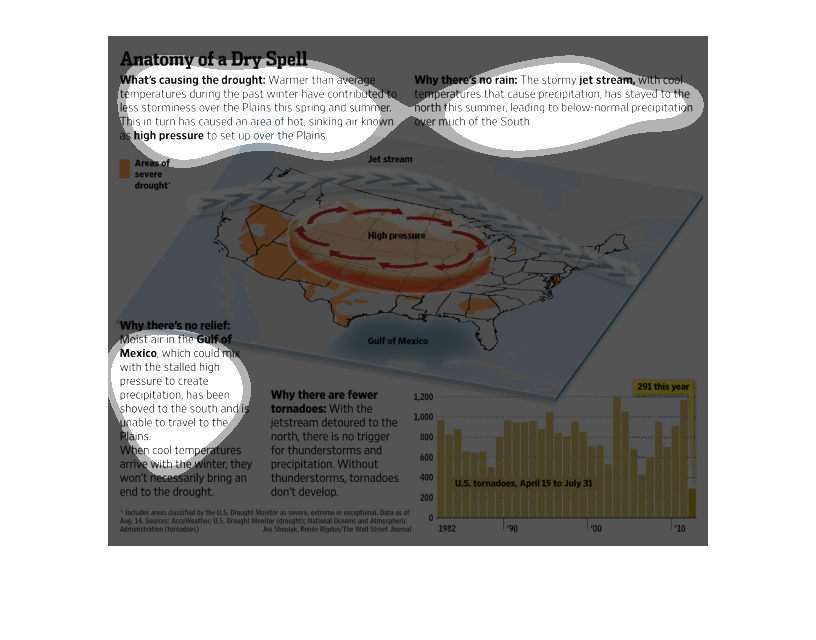
This chart details the causes and effects of drought in the USA. It shows that there are areas
of severe drought in the Southwest. It also shows that with the jetstream detoured to the
north, there are fewer tornadoes this year than in previous years because there are fewer
thunderstorms.
The image depicts the reasons for the ongoing drought in the US, as well as citing reasons
for certain unpredictable weather events. Due to high pressure, cold/dry air, drought occurs
in certain parts of the US, effecting large swaths of the country.
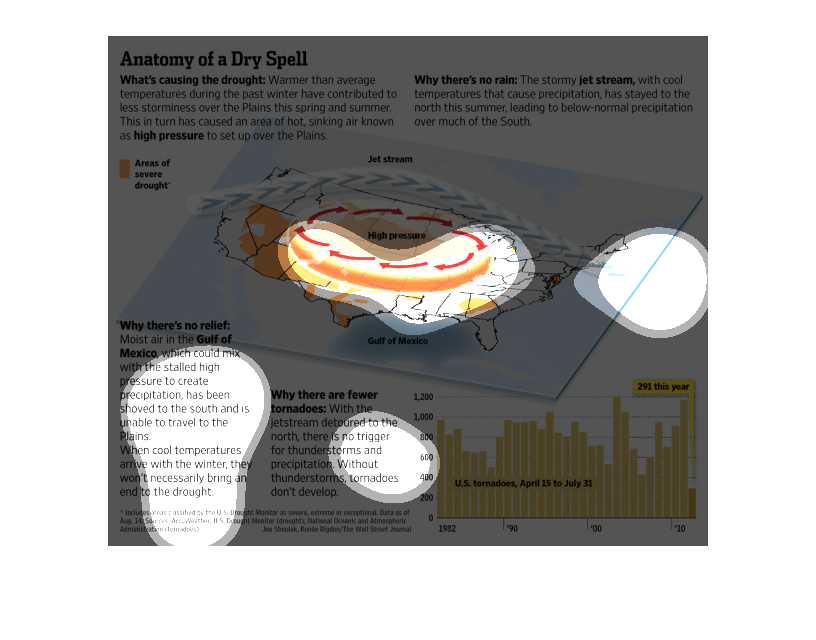
This chart is all about what causes droughts, why there is no rain during certain periods,
why there are fewer tornadoes and why there is no relief coming.
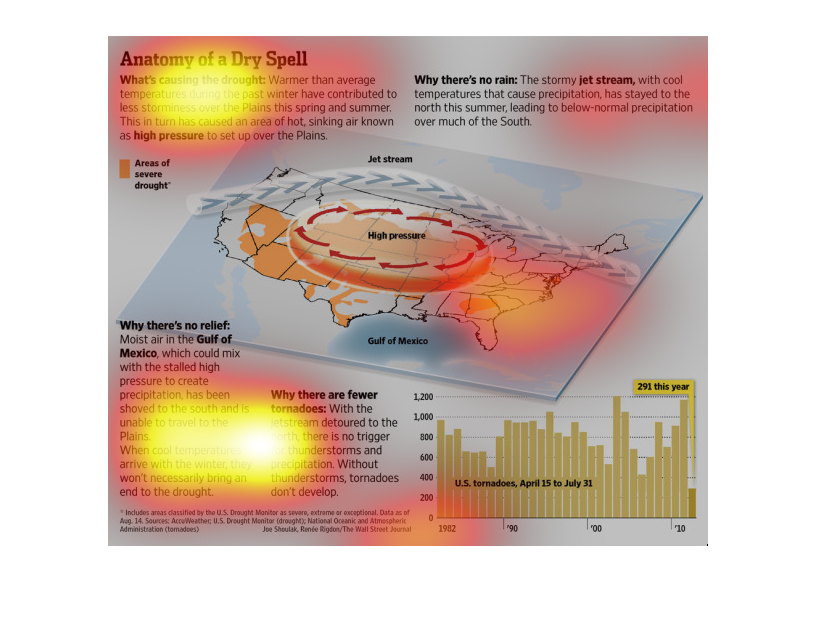
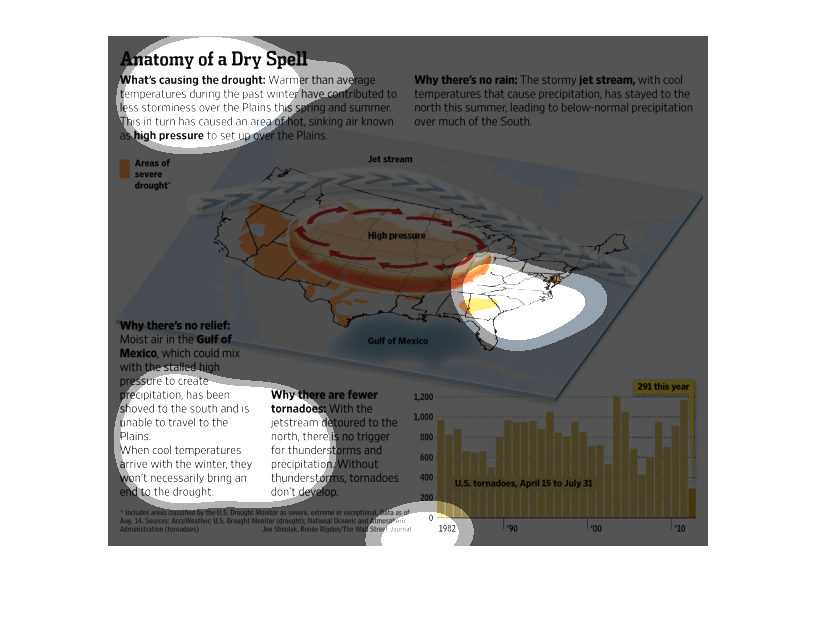
The image describes the different factors that go into creating a drought. This image in particular
describes a drought in the mid- and south-west caused by a warmer than average winter, which
then resulted in less storms during the Spring and Summer. The jet stream that carries cool
air, which results in storms has stayed farther north than usual leading to less rain.
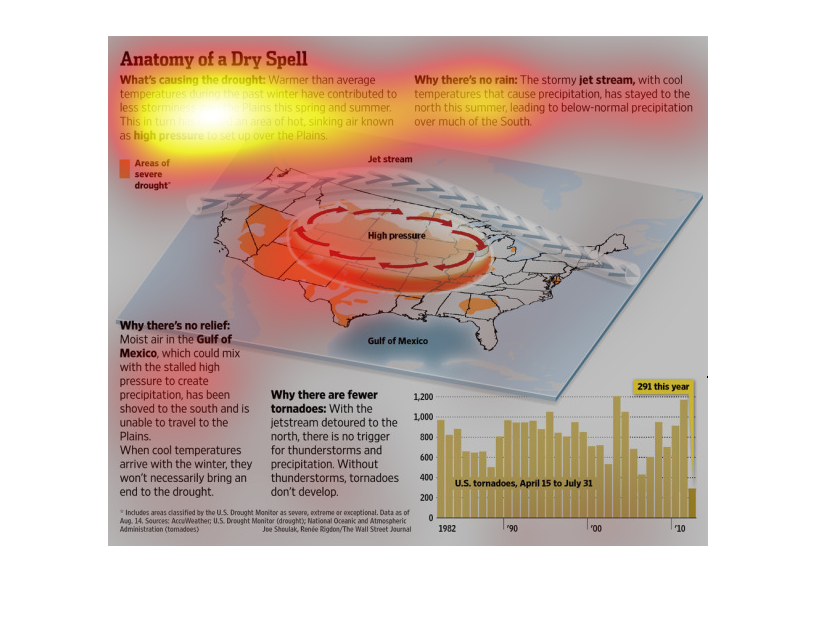
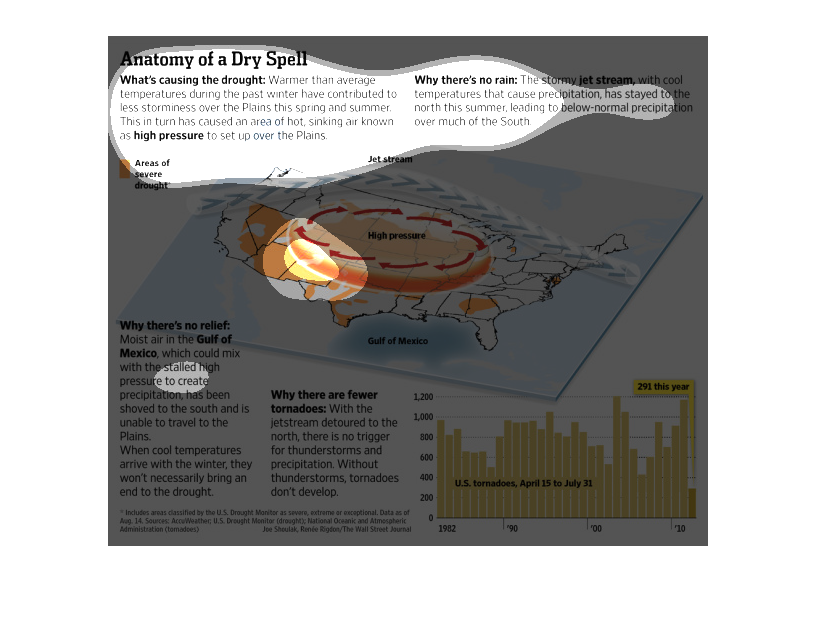
This graphic explains the nature of a dry spell. It answers how it happens, why it happens,
and why there is nothing that can be done about it. It also includes information on why there
are fewer tornadoes during the dry spell.
This is an image of a high pressure system moving in a clockwise motion over the middle of
the United States. Image discusses why there is a lack relief in the Gulf of Mexico.
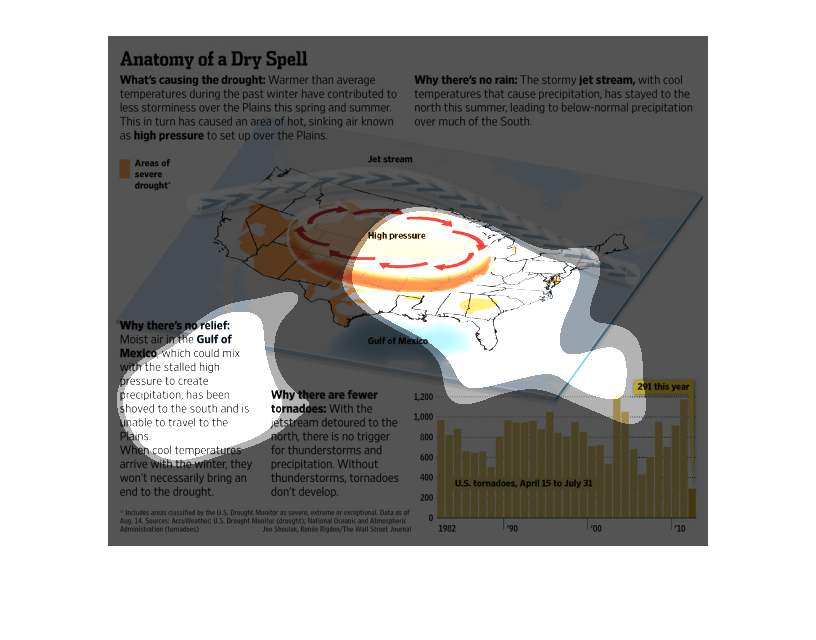
This appears to be an image of the United States when it was going through a national drought.
The article gives an overview for why droughts occur and points to the Gulf of Mexico. The
article also mentions the rate at which tornadoes occur.
Graph describes about anatomy of dry spell and the weather. It mainly describes about reason
for drought, why there is no relief, why there is no rain, why there are fewer tornadoes and
so on
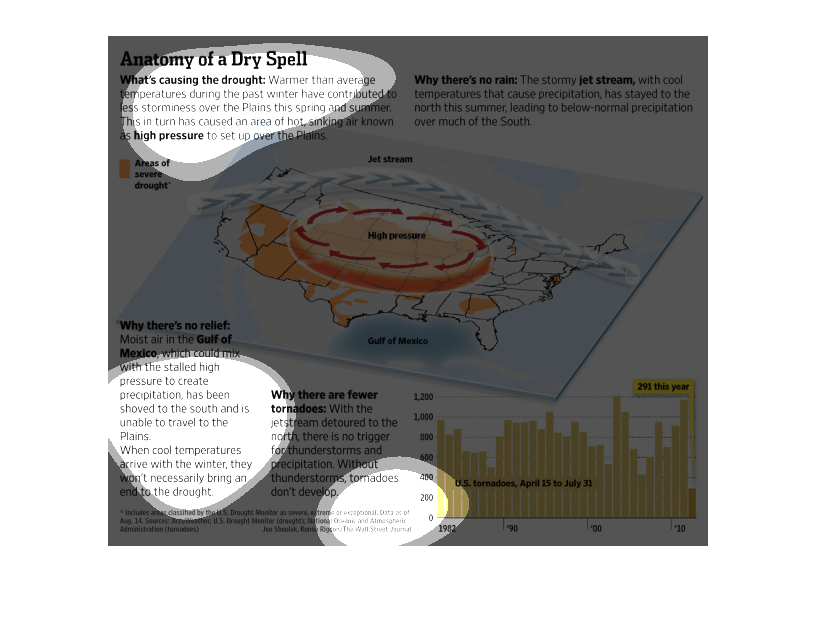
This graph is an explanation of droughts. It shows many descriptions of droughts and how they
are caused and the factors of them. It also shows their relationship to tornadoes and shows
a graph depicting how that happens. There is also a small chart for tornadoes.