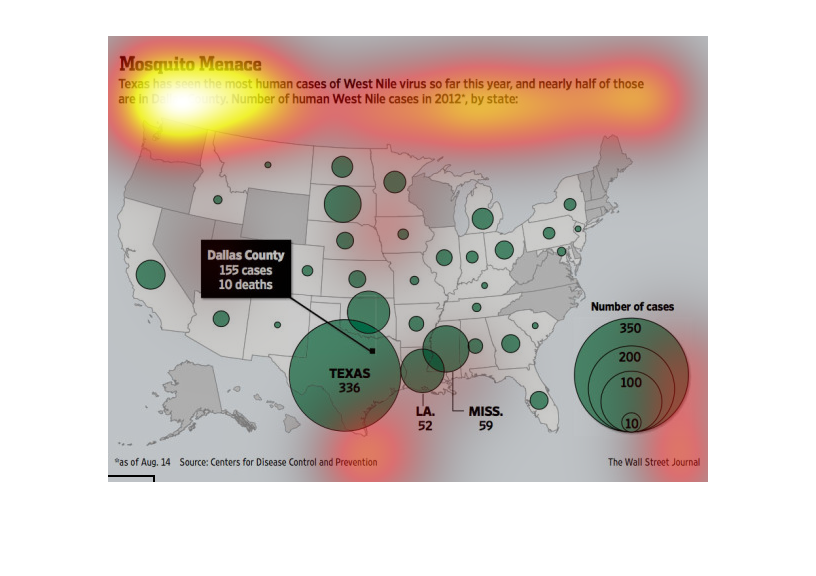
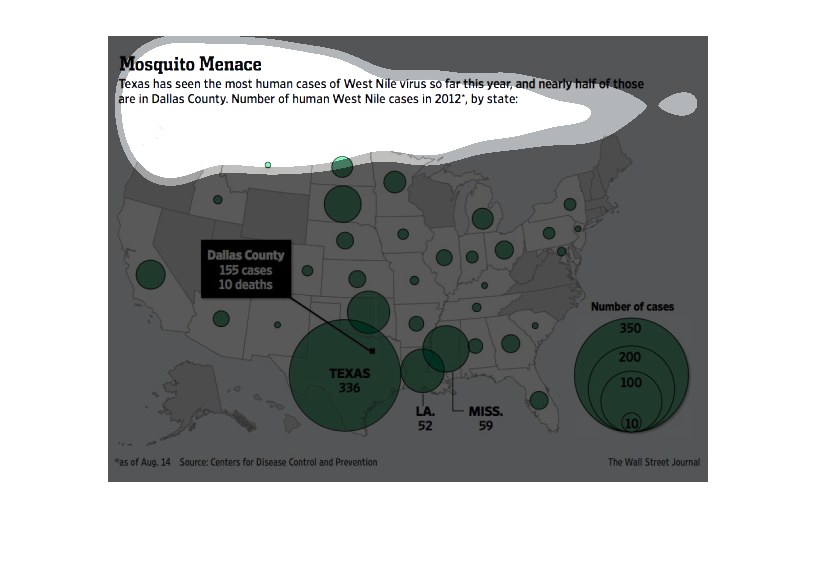
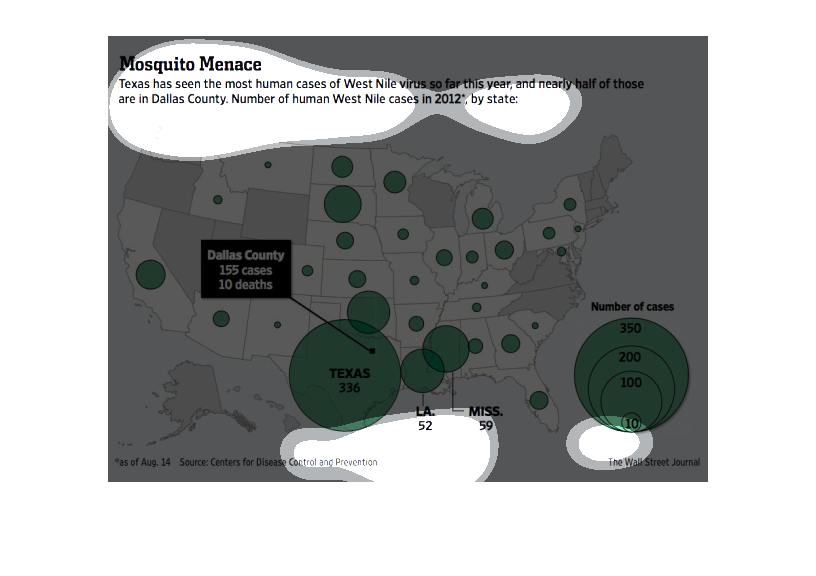
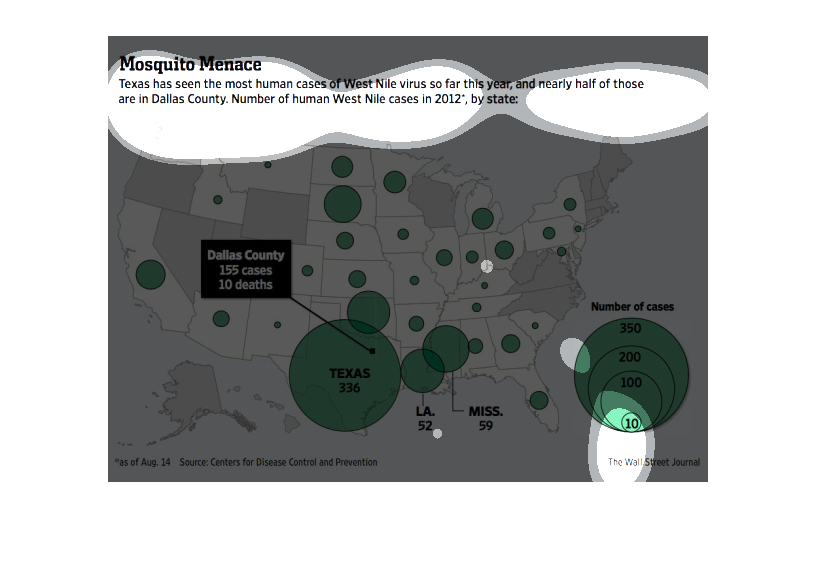
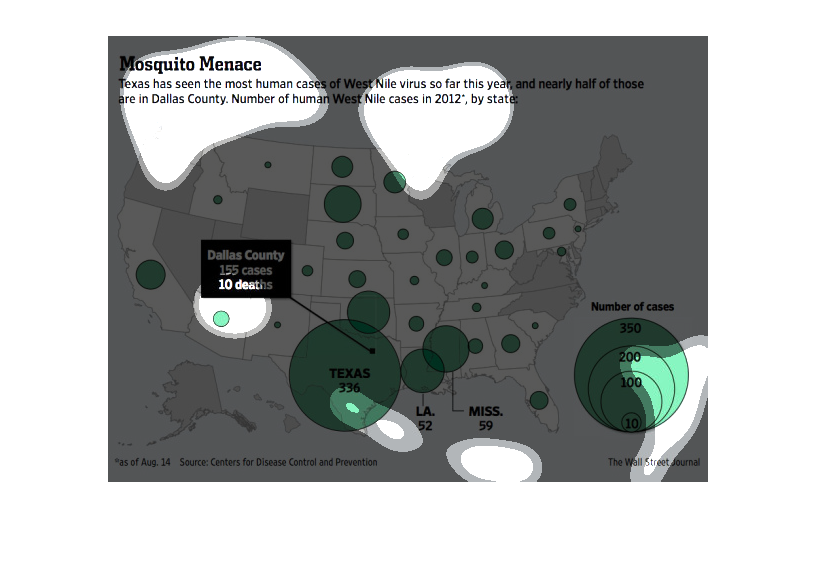
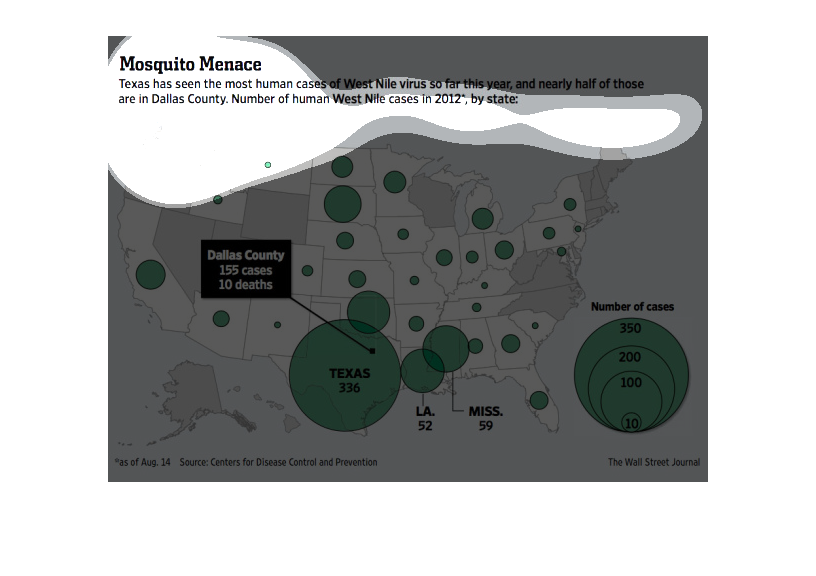
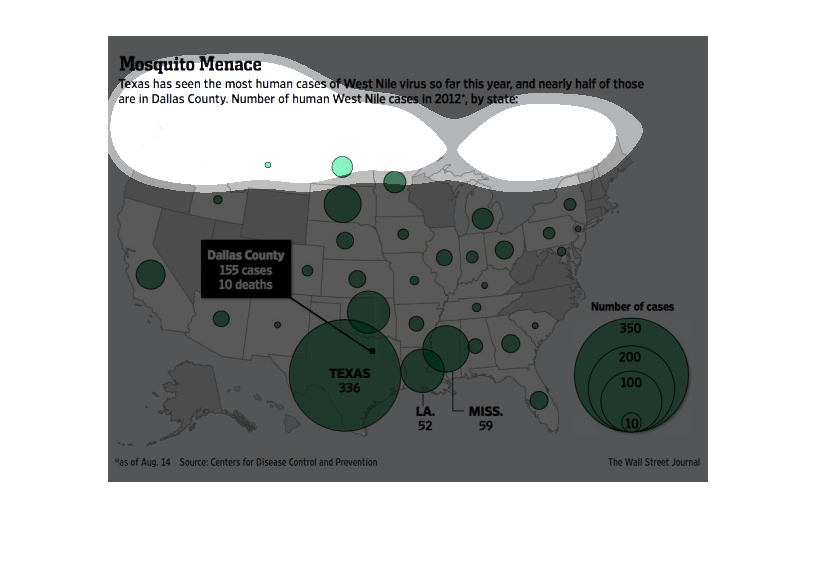
This is used to describe the cases of west nile virus. It is divided by state and illustrates
texas has the most cases of any state, with most occurring in dallas county
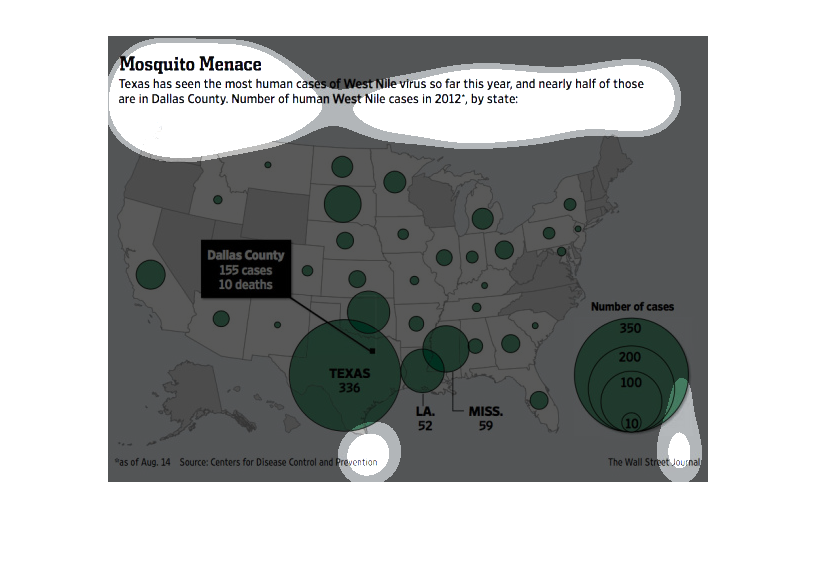
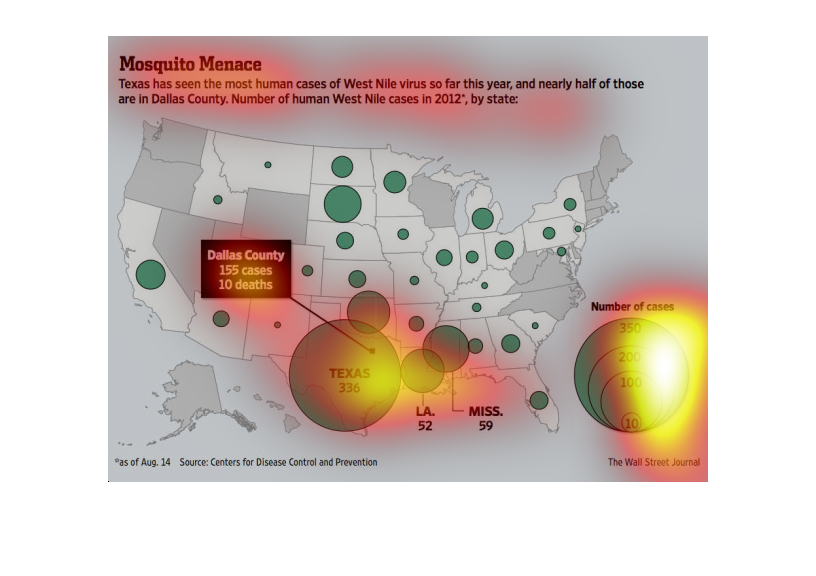
This chart shows the amount of outbreaks of a particular illnesses broken down by starte.
It uses a map and green dots to signify how many people of each state where infected
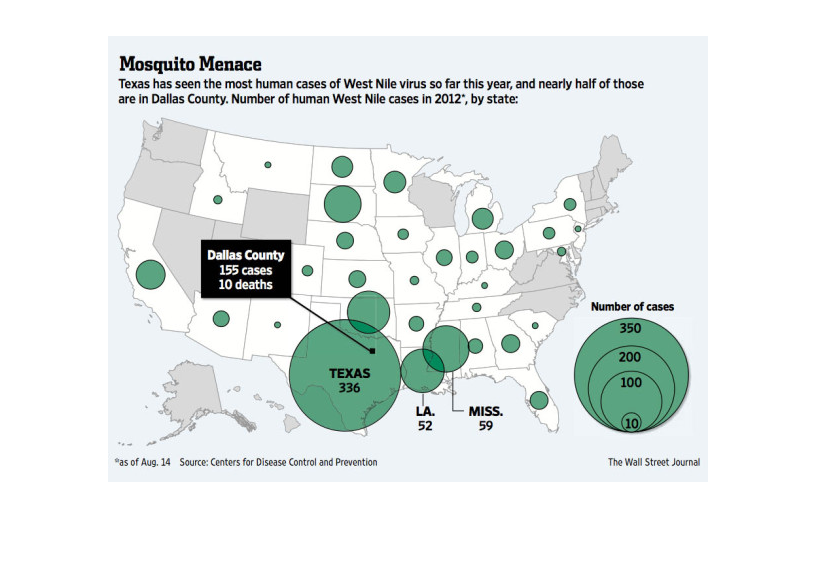
The following chart shows the number of West Nile Cases in 2012. Shows that Texas has the
highest number of cases. With dallas county texas having the highest number of  cases within
the state.
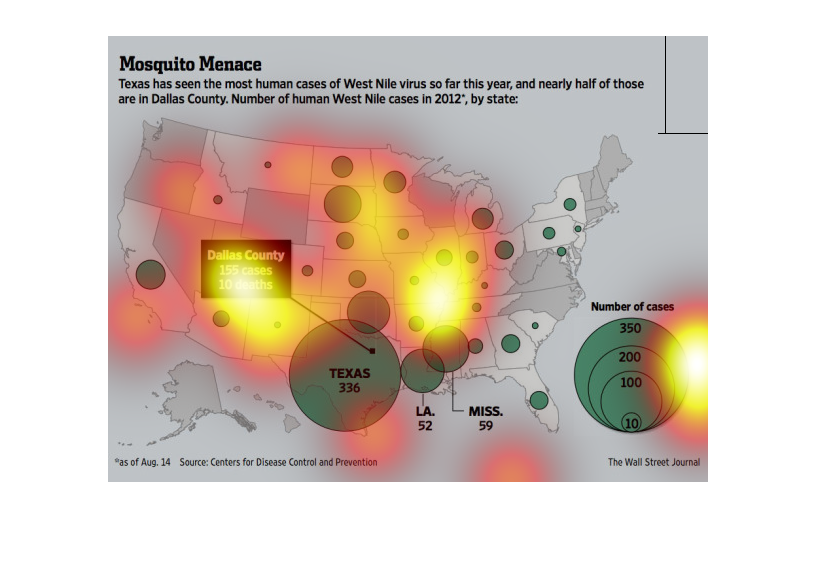
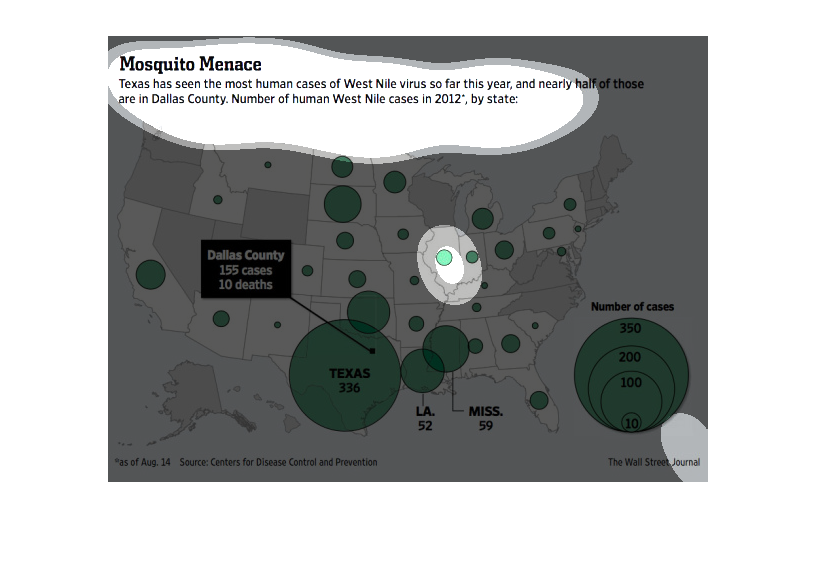
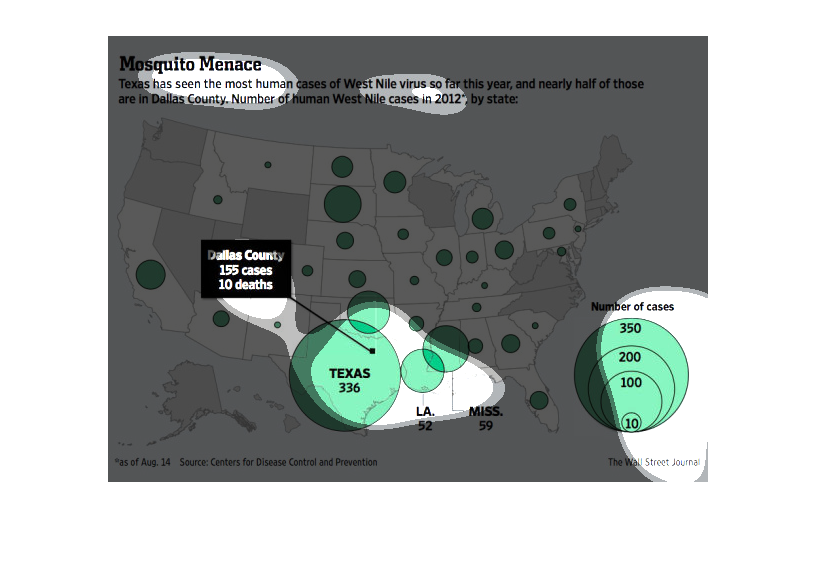
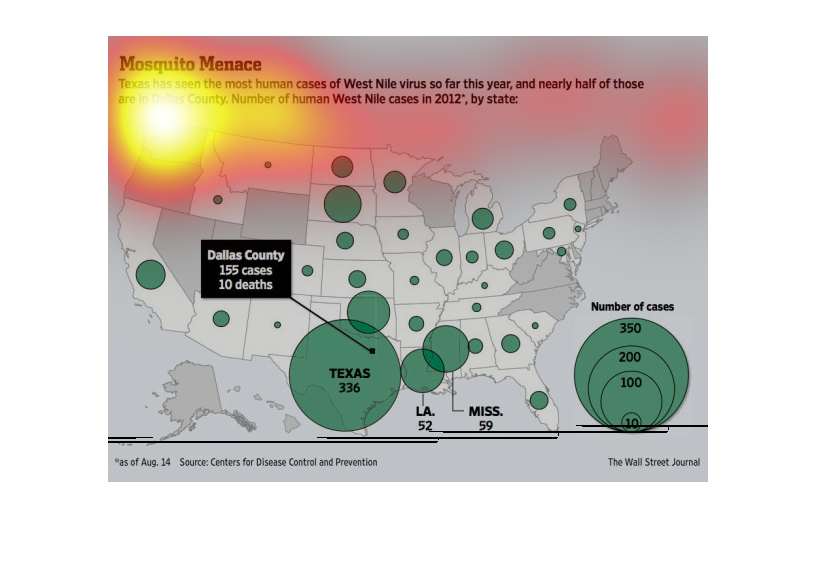
This graph shows the prevalence of the west nile disease int he United States. In particular,
it shows the prevalence of the disease in Texas. The bigger the circle, the more prevalent
it is.
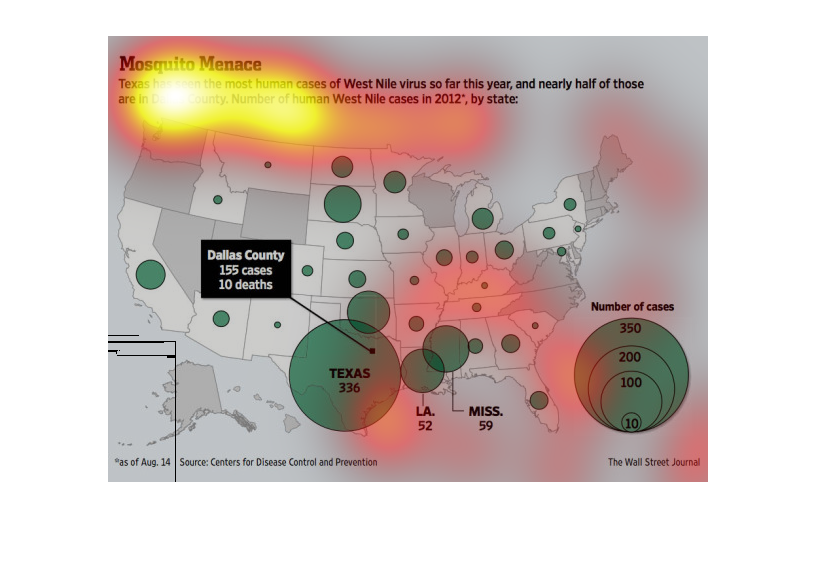
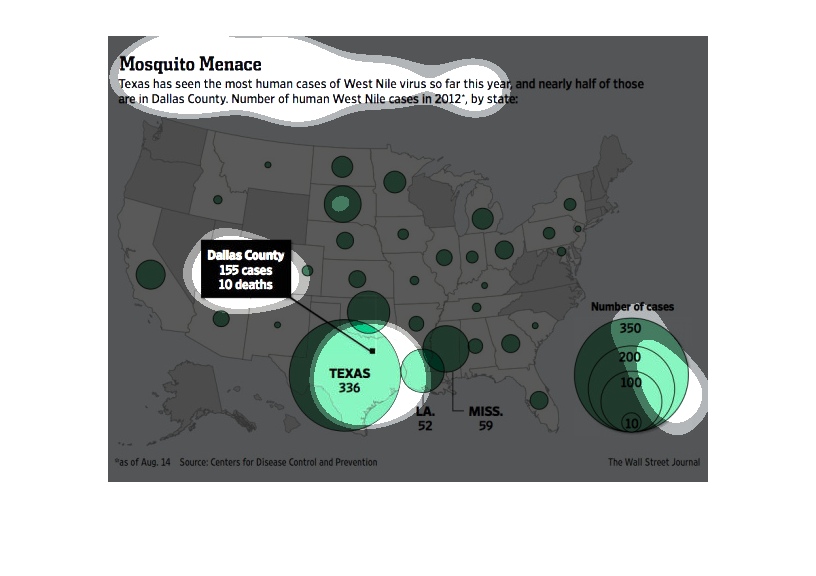
This chart shows how many cases of west nile virus have been reported across the country.
Texas has the most cases at 336, Specifically in Dallas County where there have been 155 cases
and 10 deaths
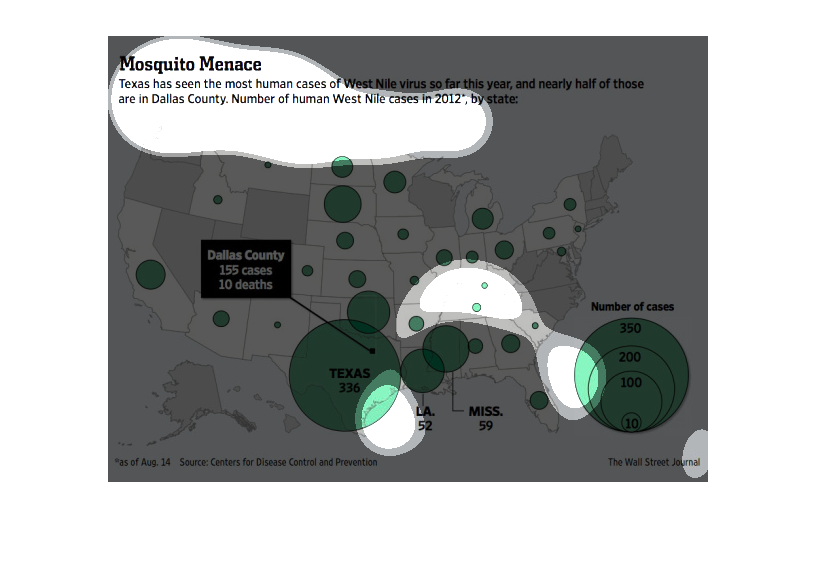
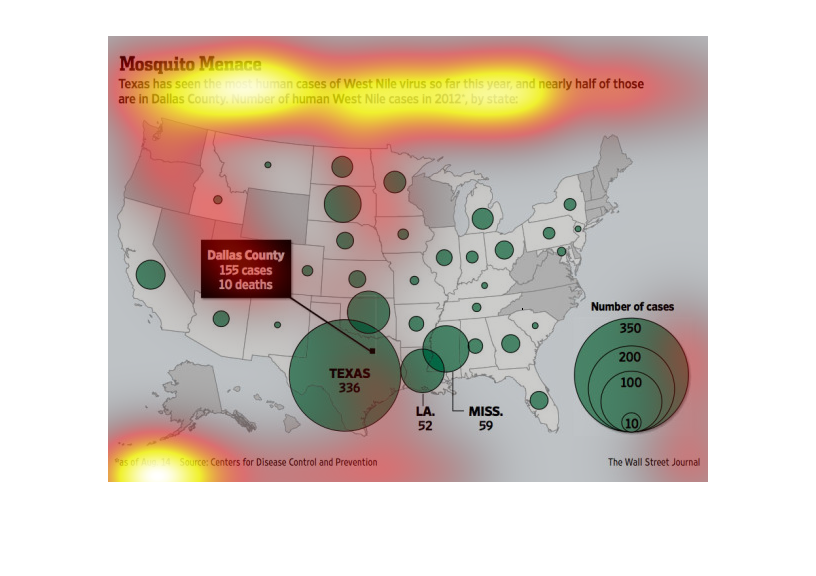
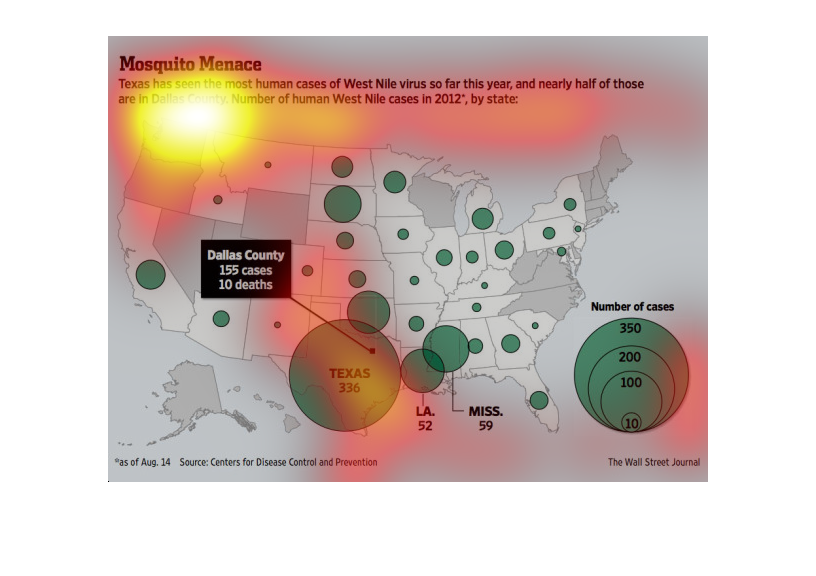
This is a series of statistics overlaid on a map of the United States depicting that Texas
has seen the most cases of West Nile virus in the year 2012.
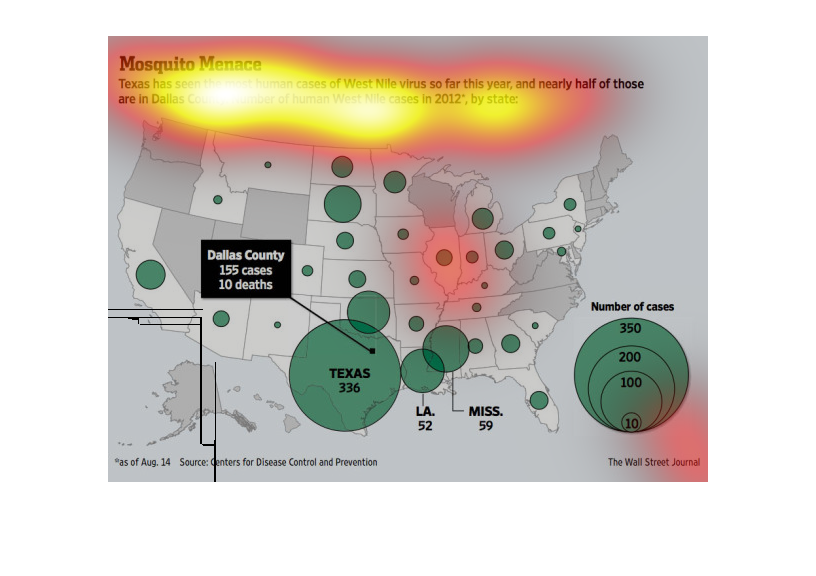
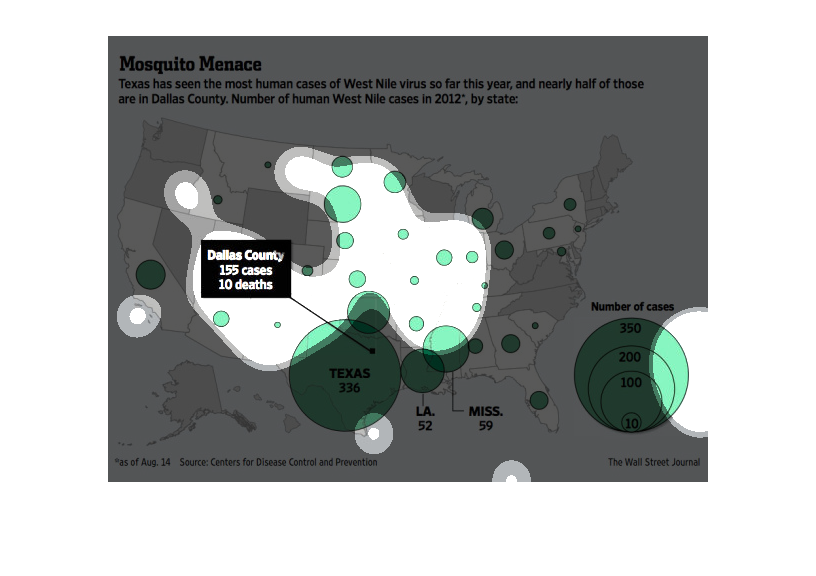
This is a map of the United States with overlaid statistics depicting how Texas is shown have
had the most cases of human West Nile virus, and that nearly half of those were in Dallas
county.
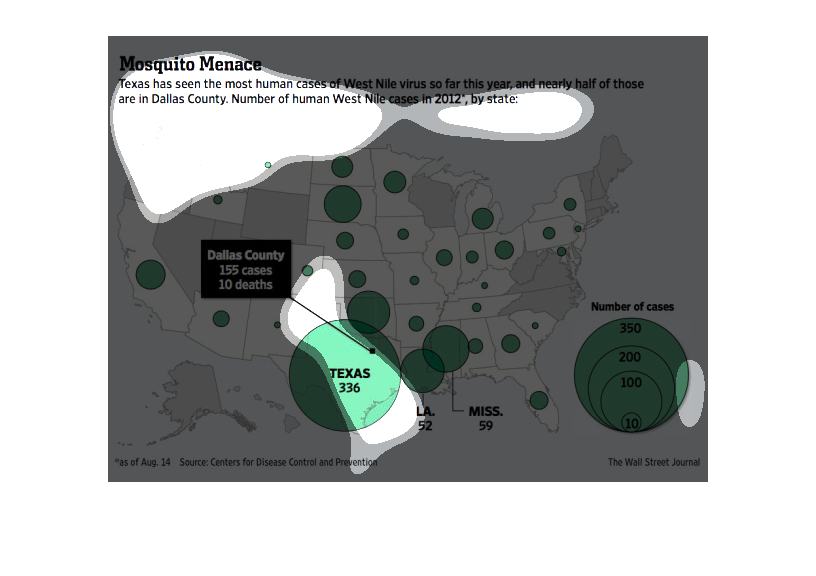
The image depicts how Texas has seen the most human cases of west nile virus in the months
studied in 2012. Nearly half of those cases were concentrated in Dallas county. Also shows
west nile virus cases by state in the US.
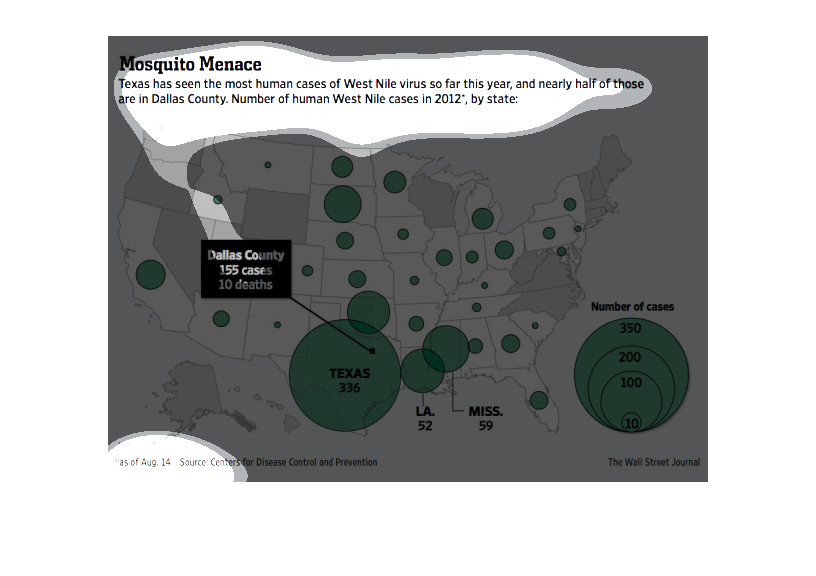
This shows the number of mosquito and Nile cases that were present in 2012.  It has a map
detailing particular areas with cases and also the number of cases being reported in different
years.
This is a map of the us and it is divided by states. The data being shown is the amount of
west nile virus cases reported. There is a major concentration of cases in Texas when compared
to the rest of the country.
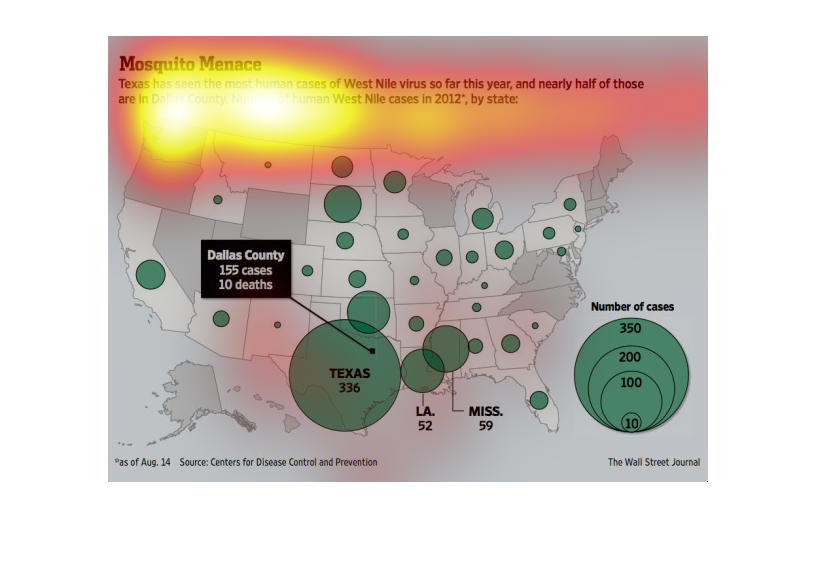
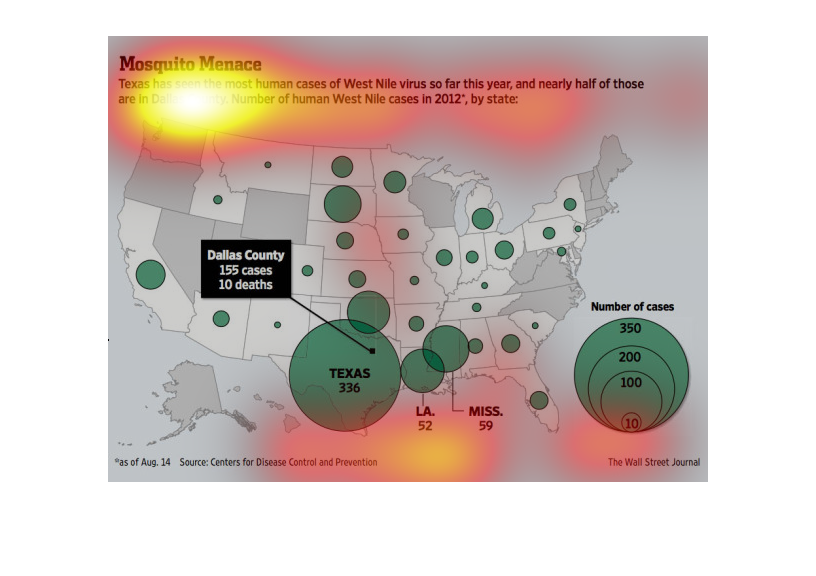
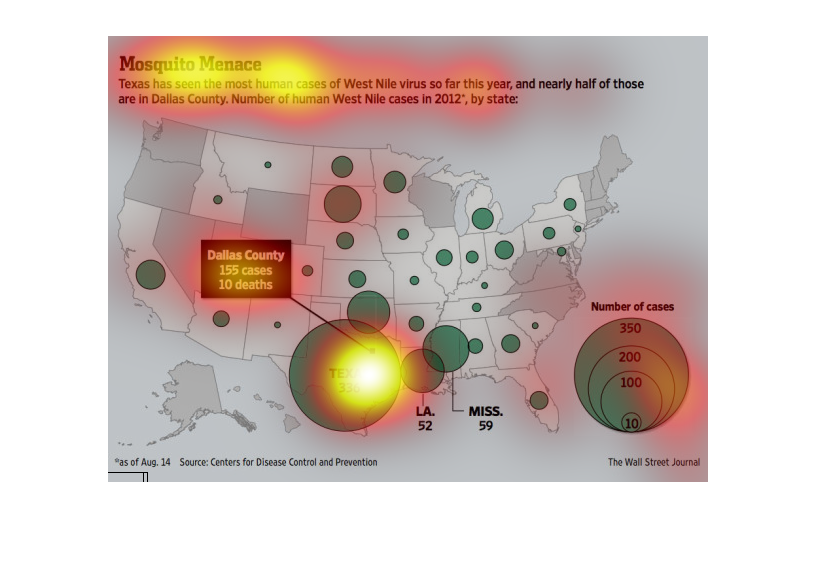
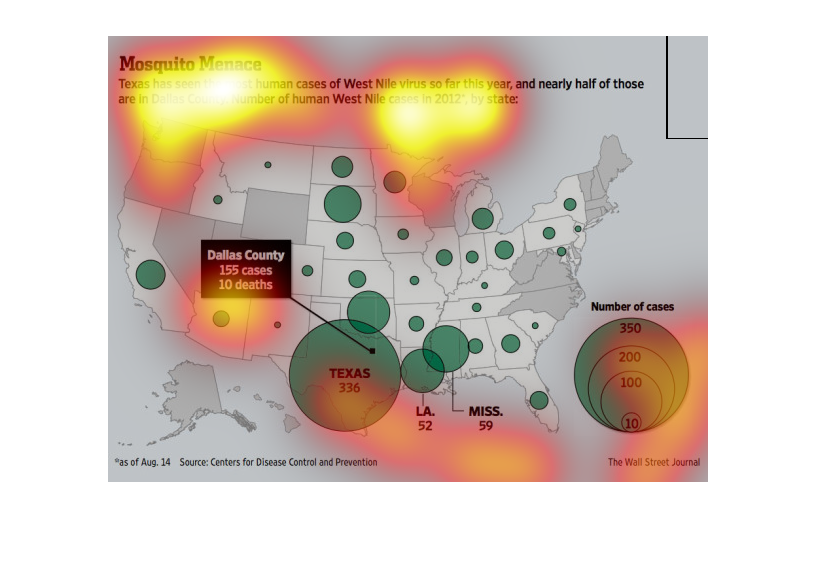
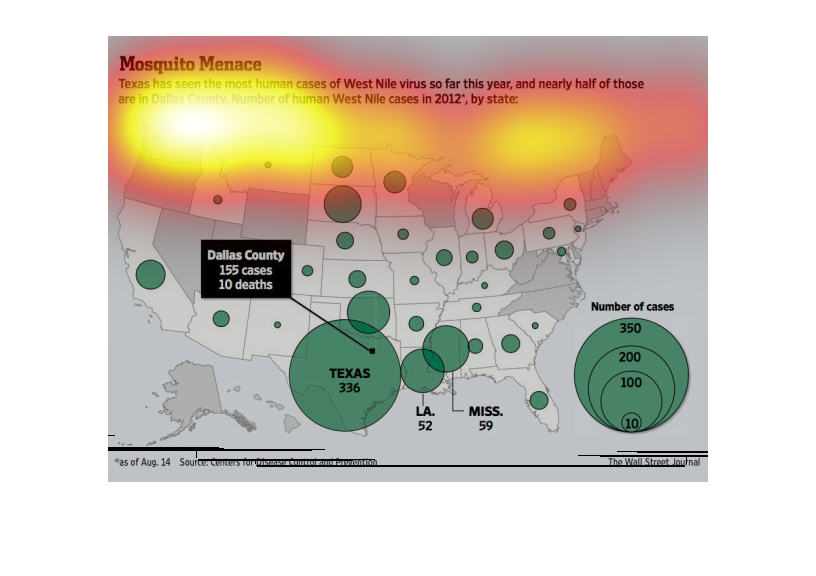
This chart describes mosquito menace. Specifically, Texas has seen the most human cases of
West Nile virus so far for this year, and nearly half of those are in Dallas.
This is chart showing the effects of the wes nile virus. Texas has seen the worst of it, specifically
in Dallas county. Dallas county has seen 155 cases and 10 deaths from wes nile.
This chart depicts the number of people affected by the wes nile virus in 2012 living in the
United States. Texas has the most, specifically in the Dallas county.
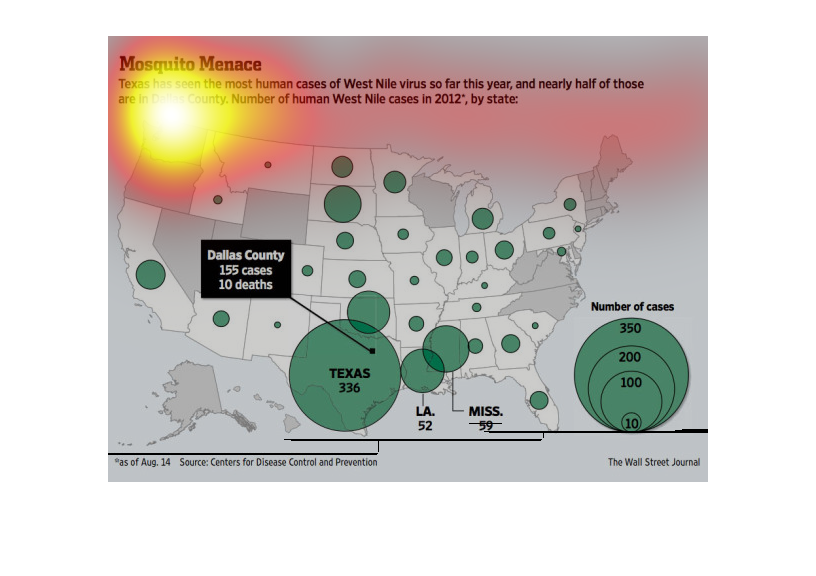
This chart describes mosquito menace. Specifically, Texas has seen the most cases of West
Nile virus so far this year, and nearly half of those are in Dallas.
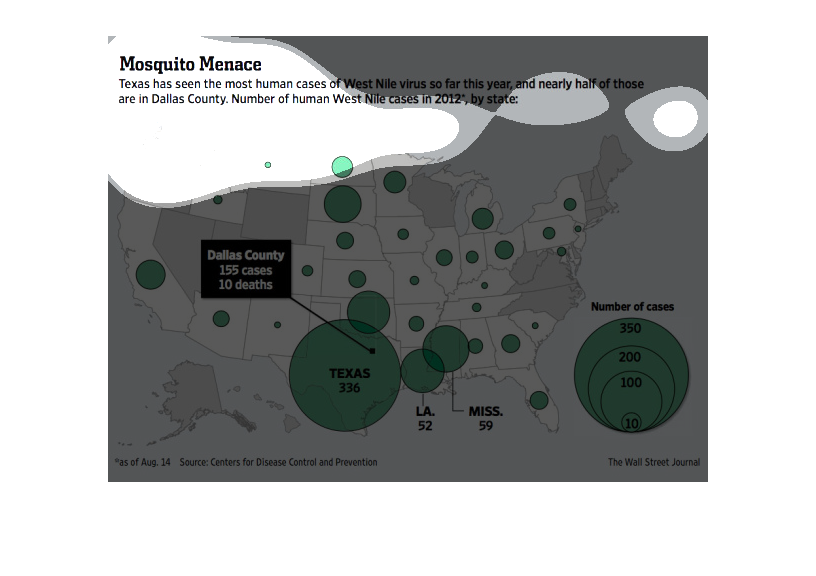
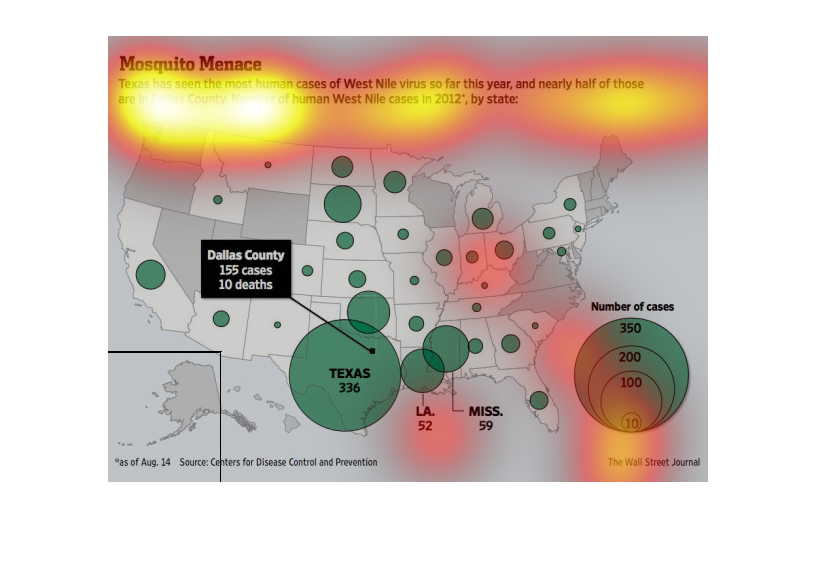
The image depicts how the state of Texas has seen the most human cases of west nile virus
in the year studied, with nearly half of those cases being in Dallas country, as well as west
nile virus cases by state. Texas has a major issue with west nile virus compared to any other
state in the union.