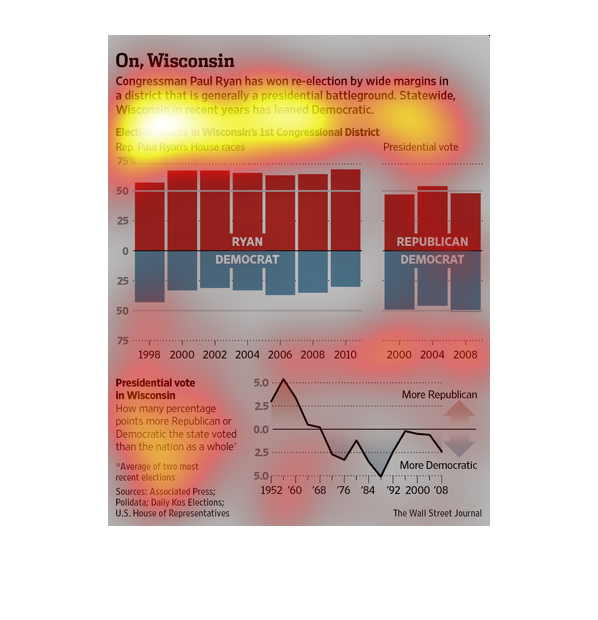
This chart highlights the success of Paul Ryan,(a Republican) in Wisconsin, a traditionally
Democratic state. The chart notes that he won reelection by wide margins.
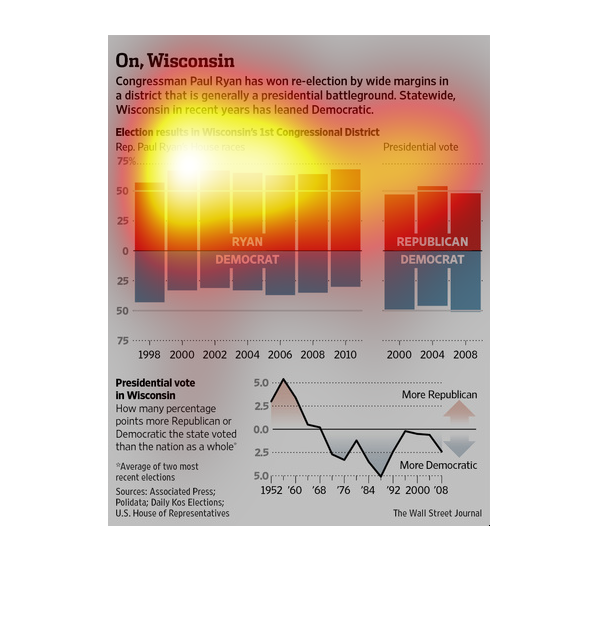
For the Wisconsin politics congressman Paul Ryan has won the re-election in an area in which
it has been known to be a "presidential battleground". Wisconsin is also on the democratic
side now.
Wisconsin is getting taken over by the Democrats. In this graph we see that the population
of the state is suddenly swinging the other way, after years of staunch Republican support.
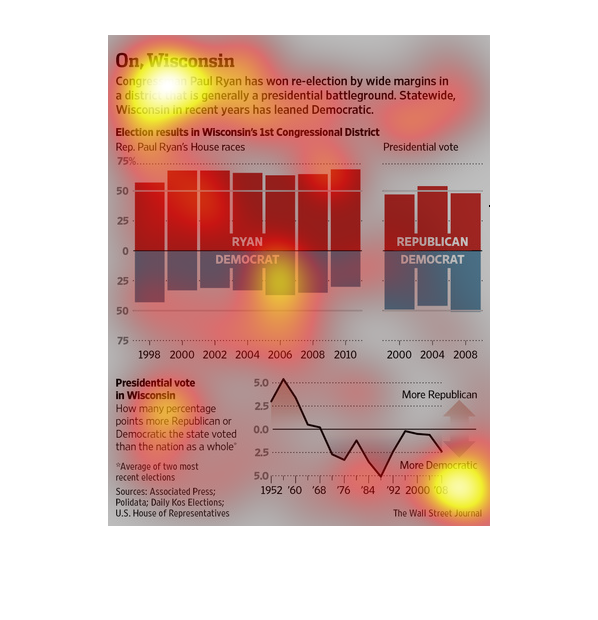
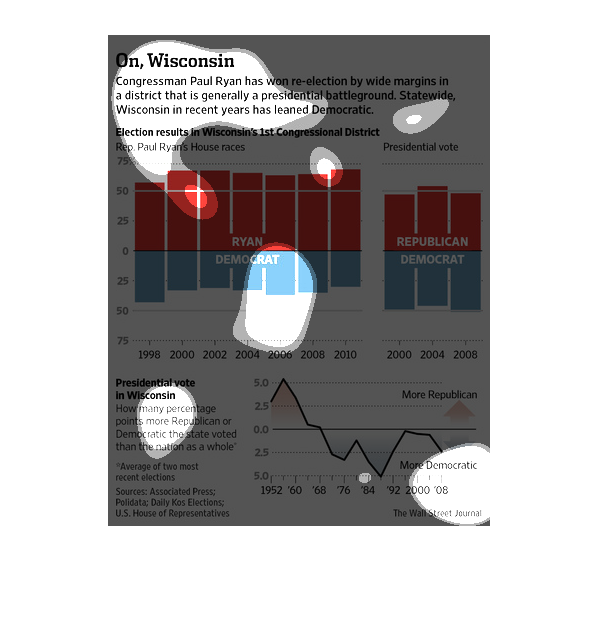
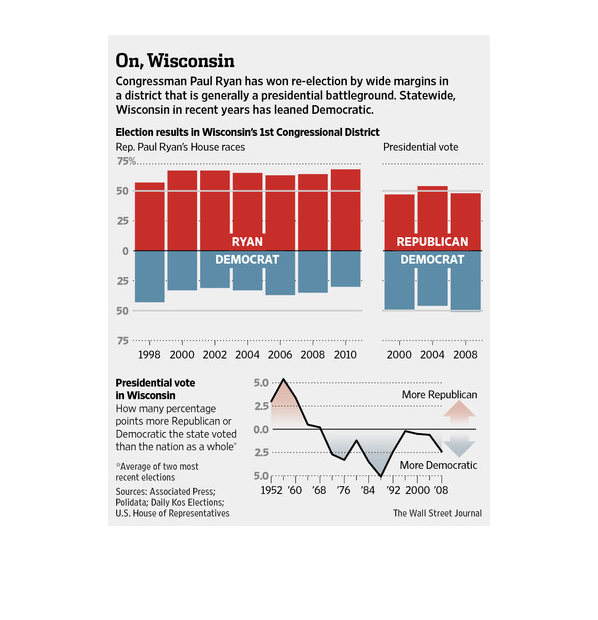
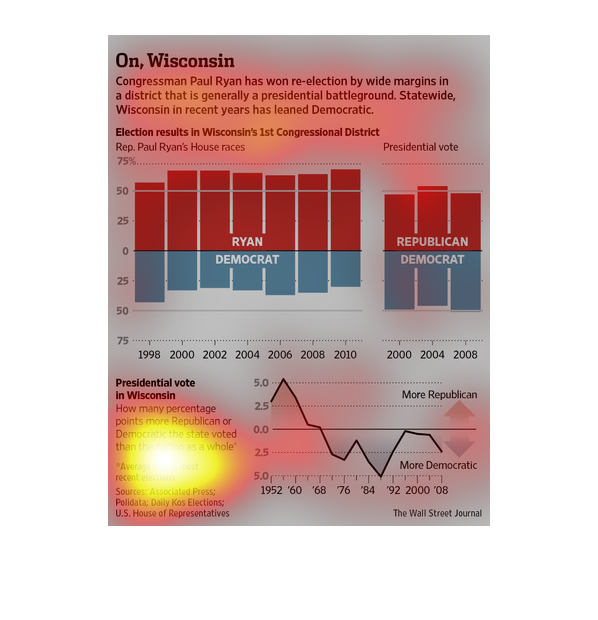
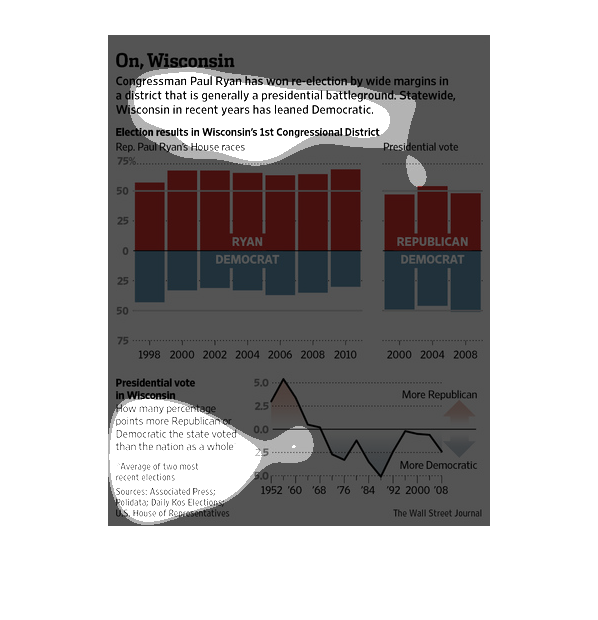
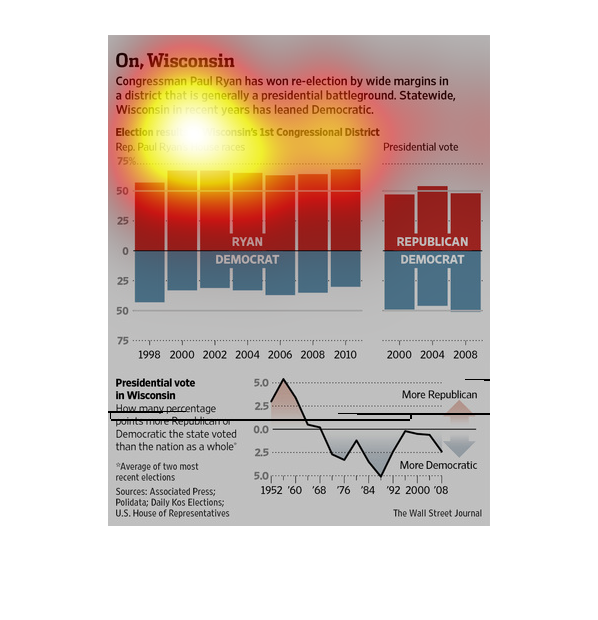
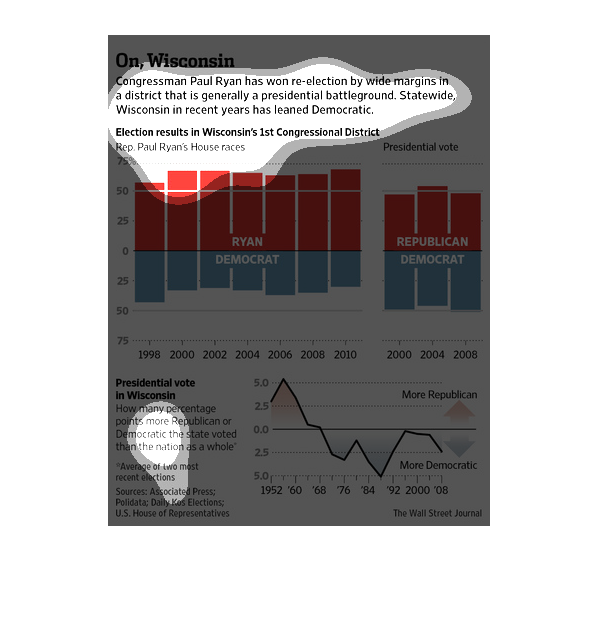
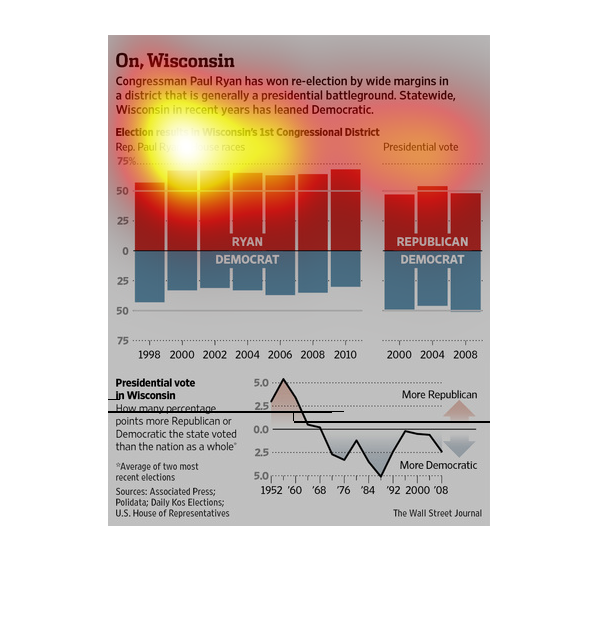
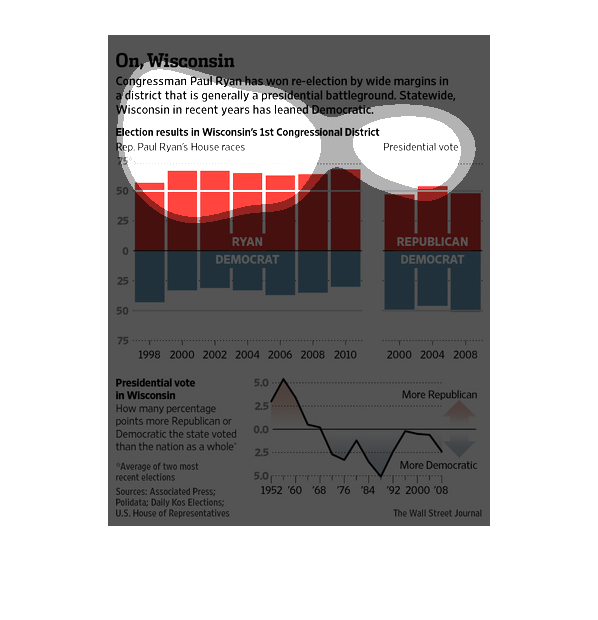
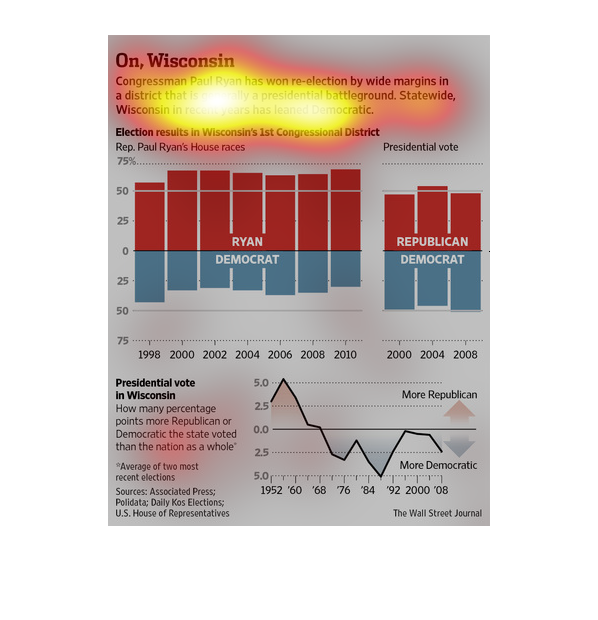
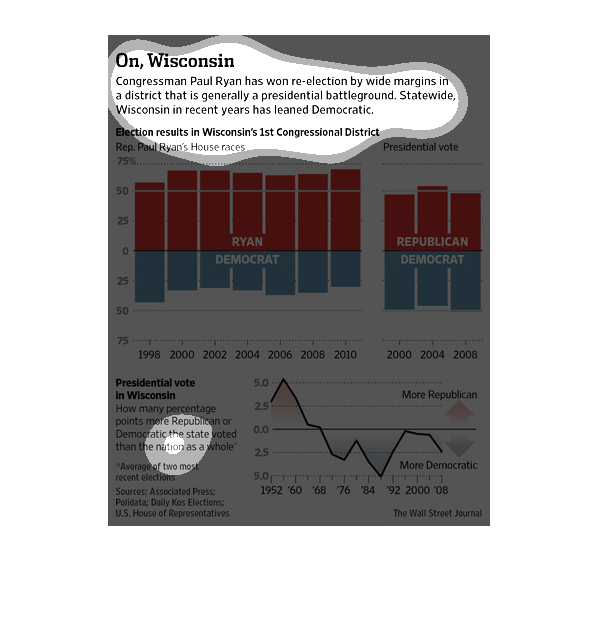
This chart describes on, Wisconsin. Specifically, congressman Paul Ryan has won re-election
by wide margins in a district that is generally a presidential battleground.
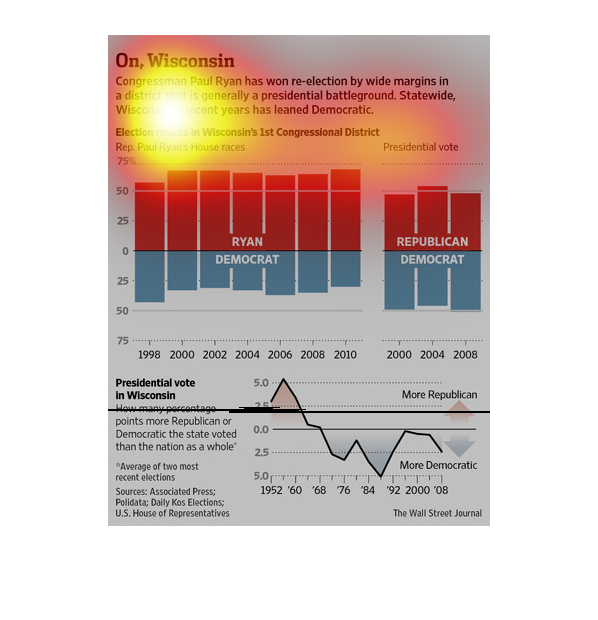
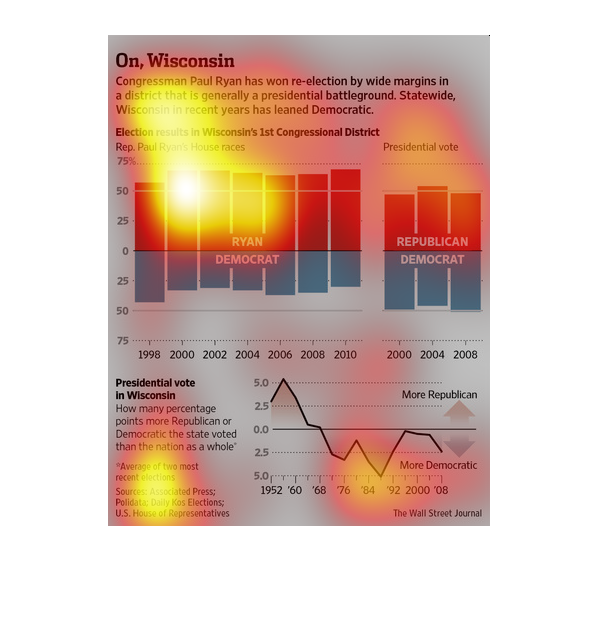
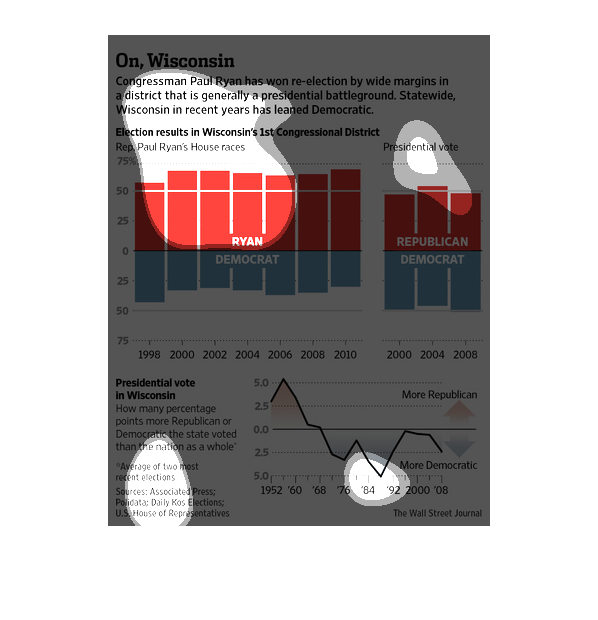
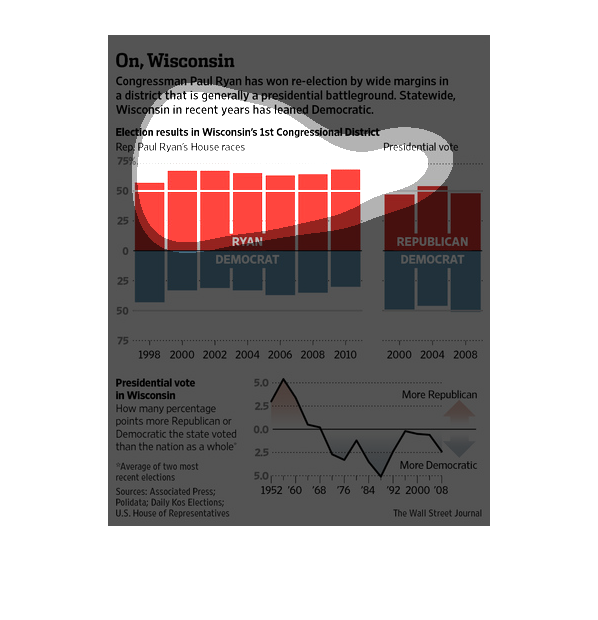
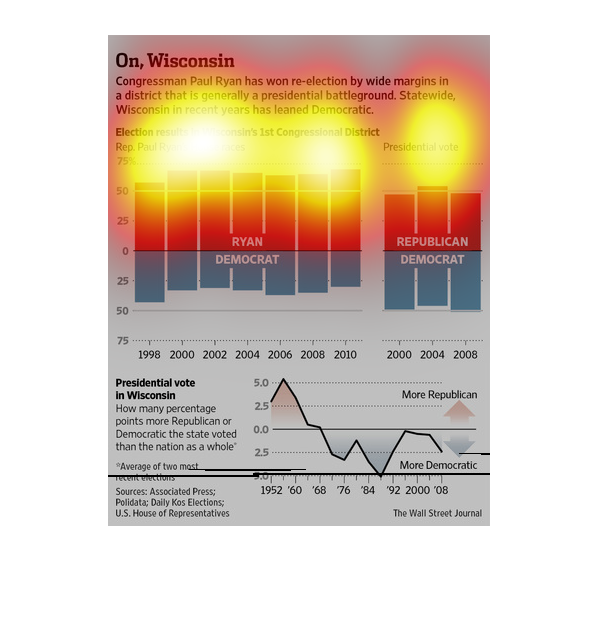
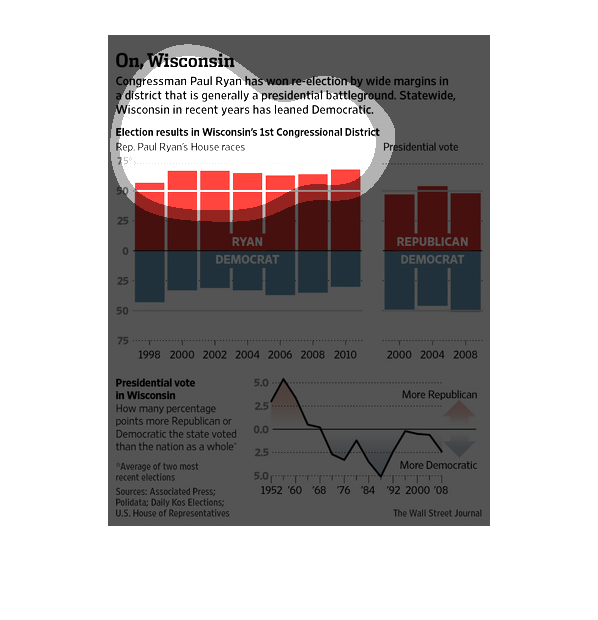
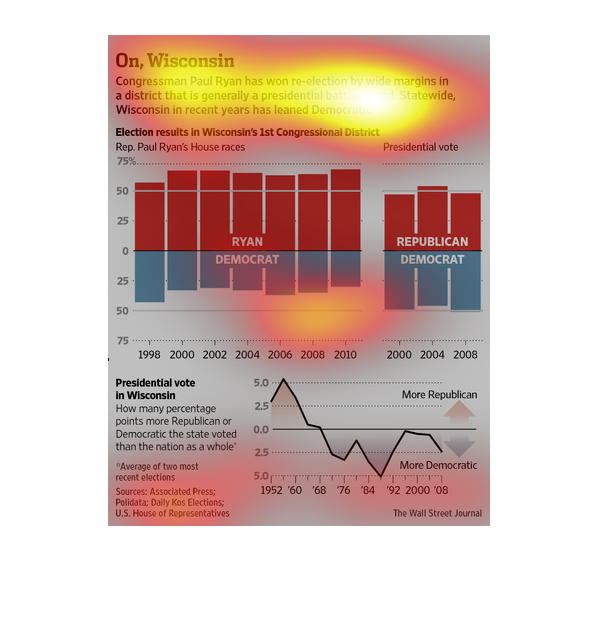
This figure describes the election results of the 1st congressional district of Wisconsin
and compares it to the presidential vote by percentage of voter party affiliation.
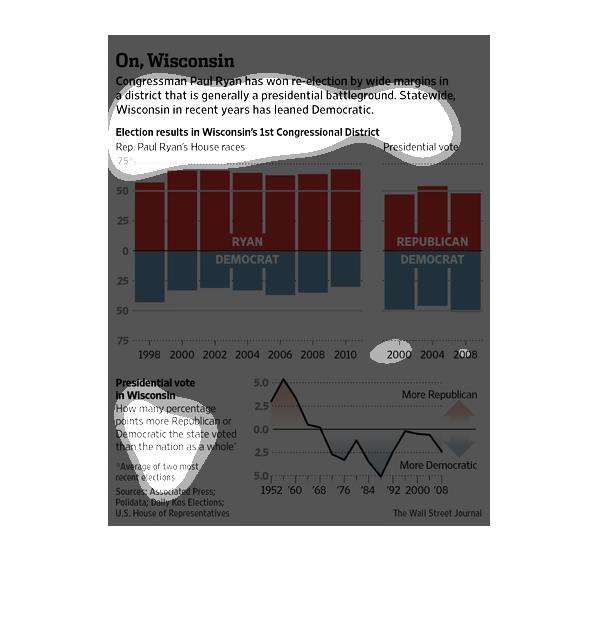
This chart compares Paul Ryan's (R) election to the votes made for presidential candidates
in Wisconsin's first congressional district. More people voted for him than for the republican
presidential candidate. This district is more likely to vote Democrat than the rest of the
country.
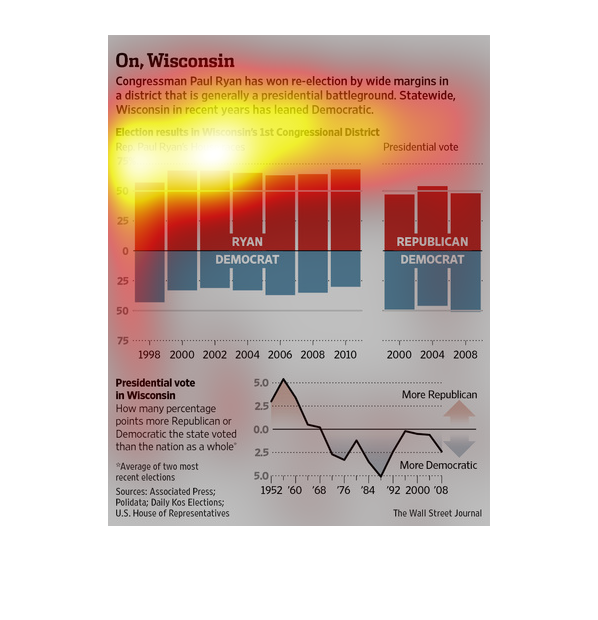
This chart describes on Wisconsin. Specifically, congressman Paul Ryan has won re-election
by wide margins in a district that is generally a presidential battleground.
This is an article, my guess would be from a local newspaper. It talks about a congressman
by the name Ryan and how he won most of the re-elections than all the other candidates. This
picture also provides a diagram with statistics.
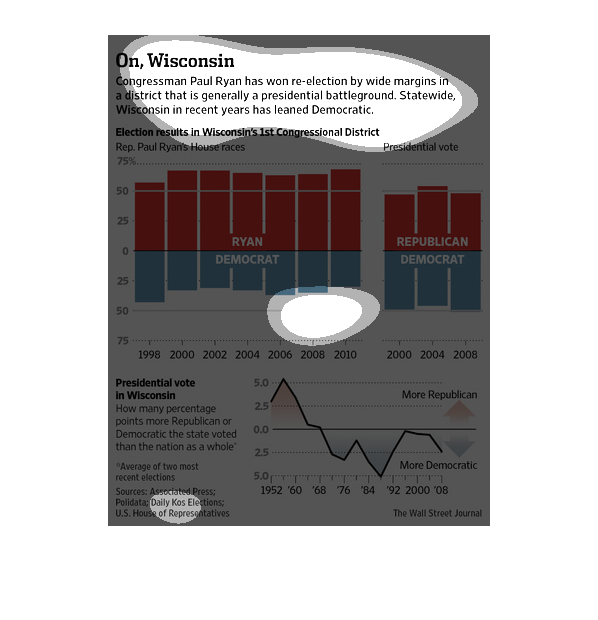
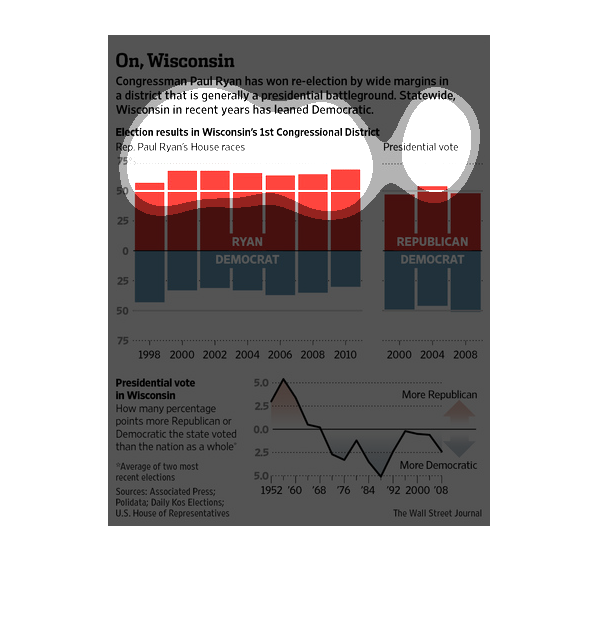
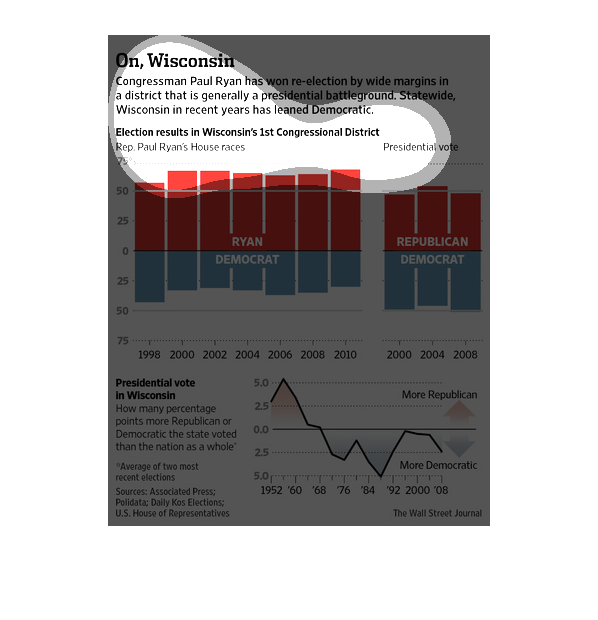
This chart titled "On, Wisconsin" shows that Congressman Paul Ryan has won re election by
wide margins.  The chart shows the percentage of democrats and republicans that voted for
him from 1998 to 2008.
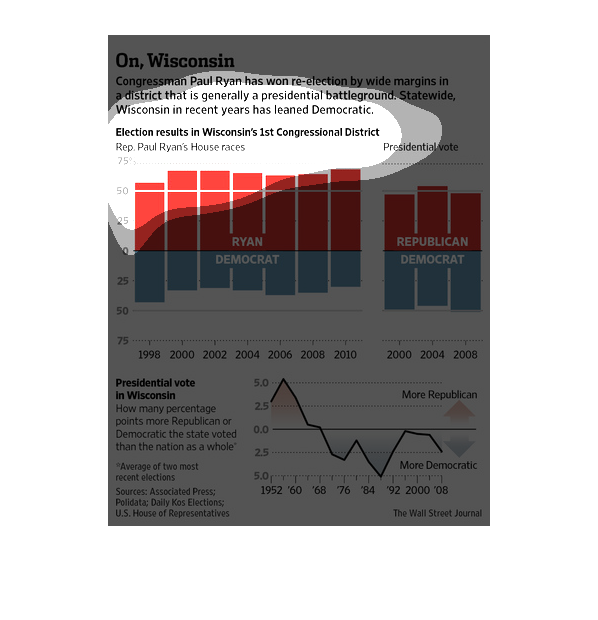
This graph shows election results in wisconsion among the 1st congressional district. A red
a blue graph shows democratic votes versus republican votes for paul ryan, who won. Below
is a trend of faction votes, stretching back over 50 years.
This is a graph of the election for congress in Wisconsin. The data shows the percentage that
Congressman Paul Ryan won reelection by. It shows the vote given to his democratic opponents.
This is a series of charts, graphs and related statistics depicting how Paul Ryan had won
reelection by wide margins that is generally a presidential battleground.
Wisconsin- which is typically Republican- has lately favored Democrats as this study illustrate
so astutely, citing Paul Ryan's victory as a prime example.
The image shows the ruling in Wisconsin in regards to  Paul Ryan winning his re-election and
statistical analysis that shows the overall results of that occurrence.
A bar chart infographic of Wisconsin's from 1998 to 2010 considering the congressional district
Paul Ryan holds and general presidential election. Shows relatively steady conservative support