The following chart shows that the United States Retail Sector gained during July of an Unspecified
year. With every major Category within the sector showing gains.
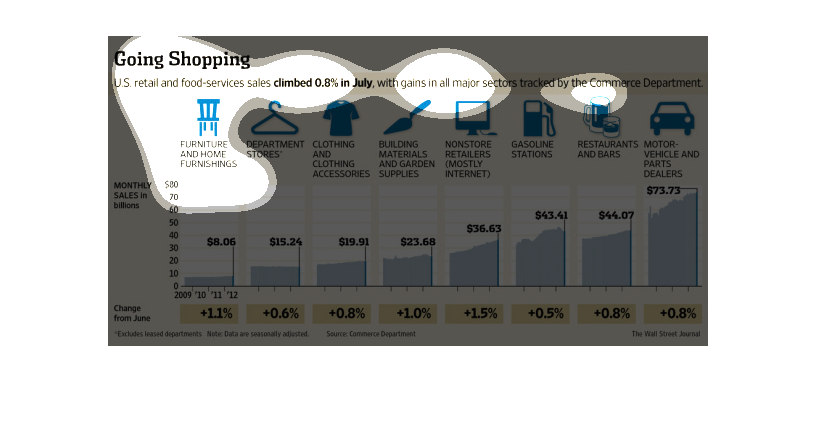
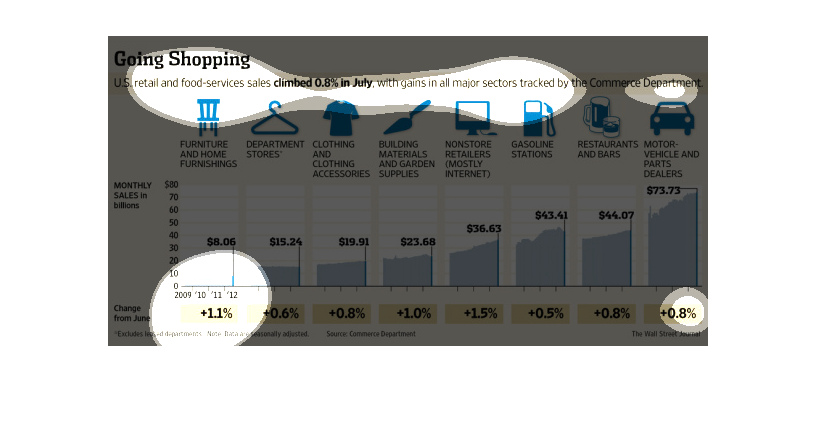
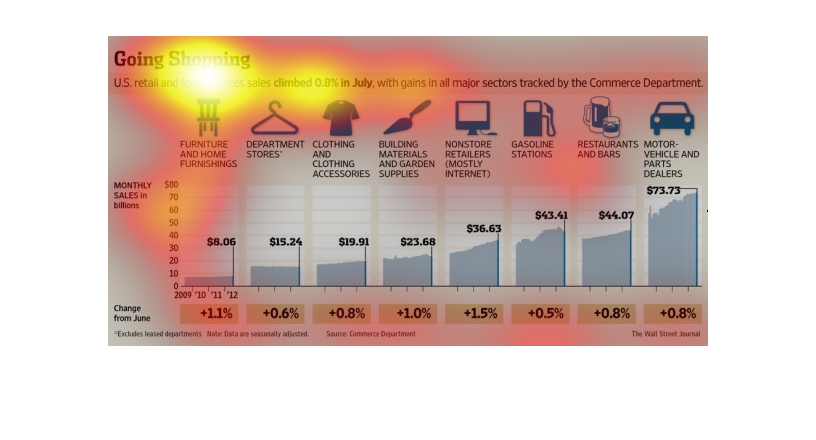
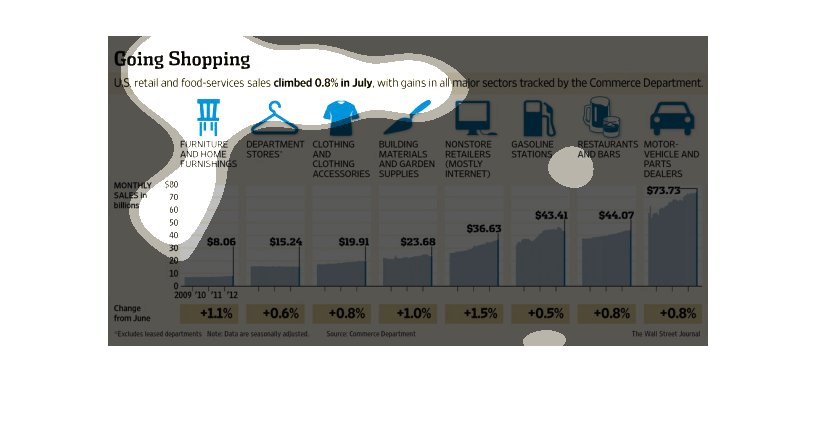
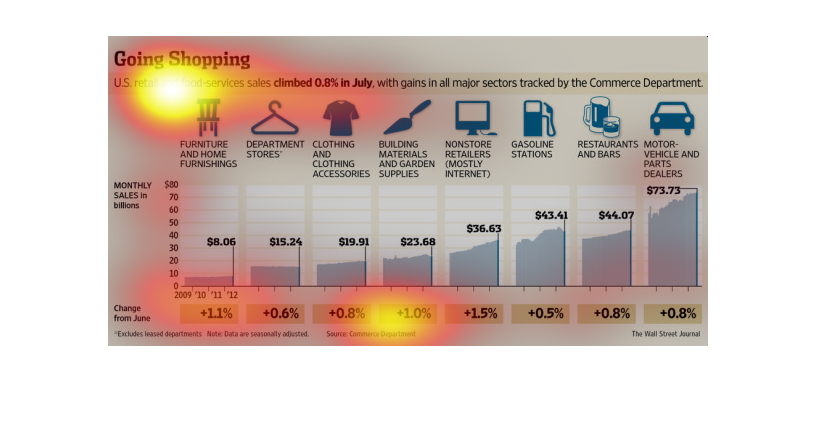
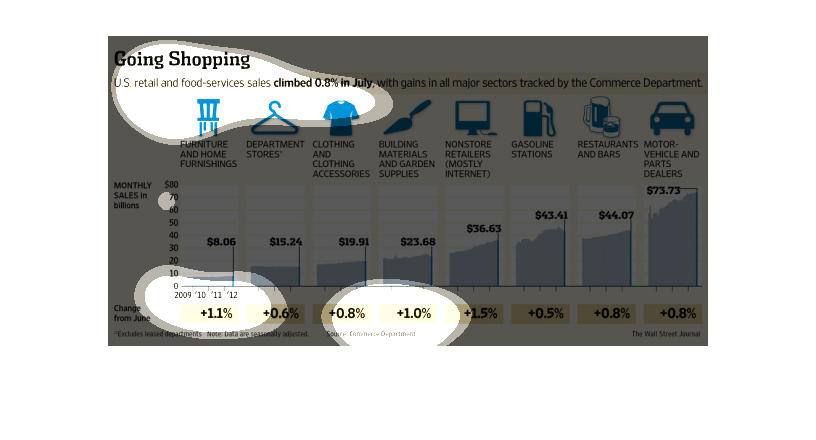
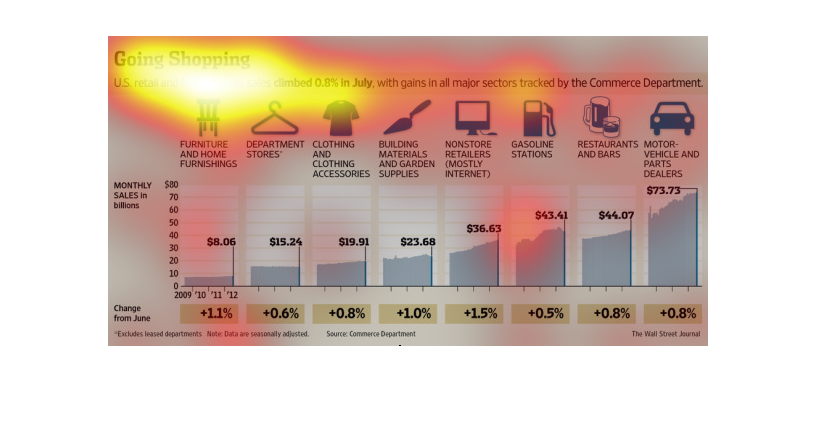
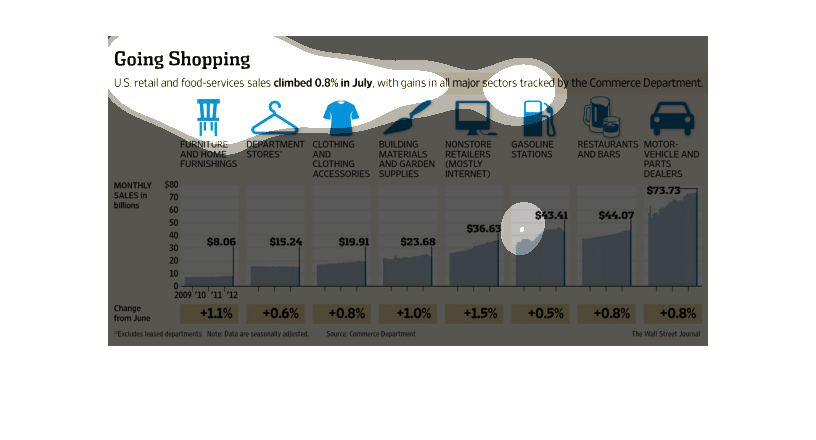
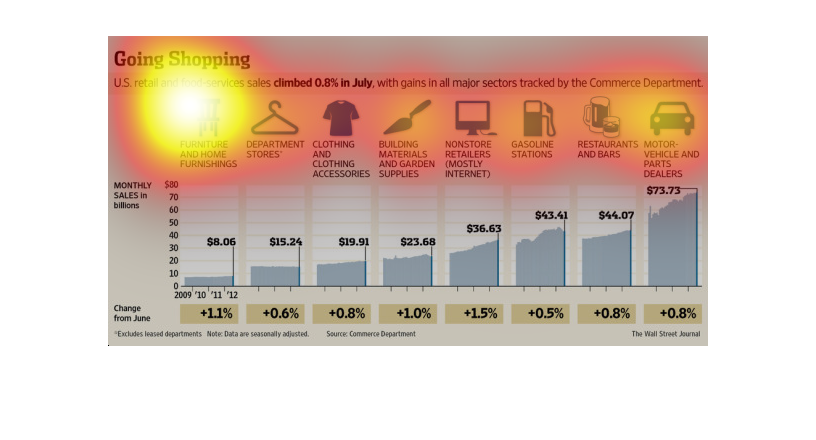
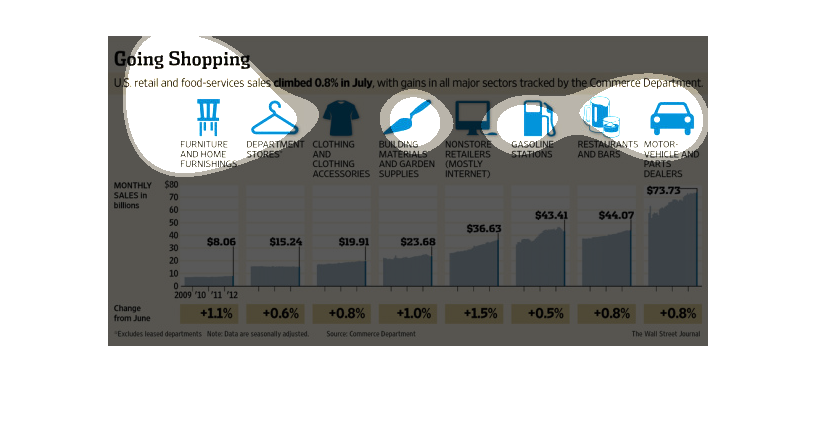
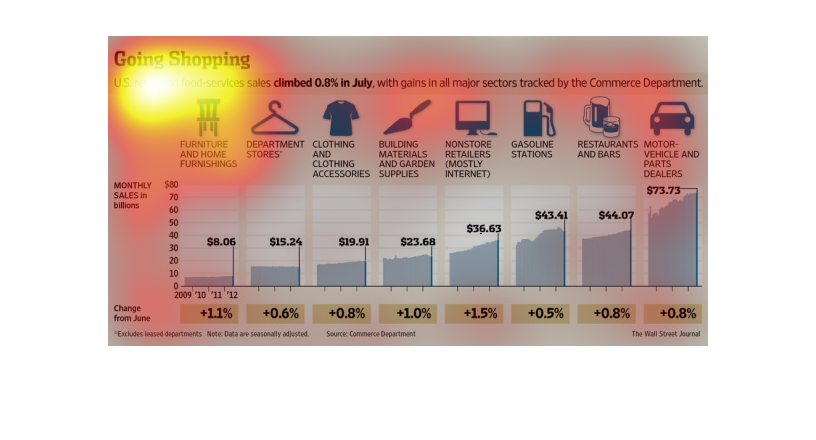
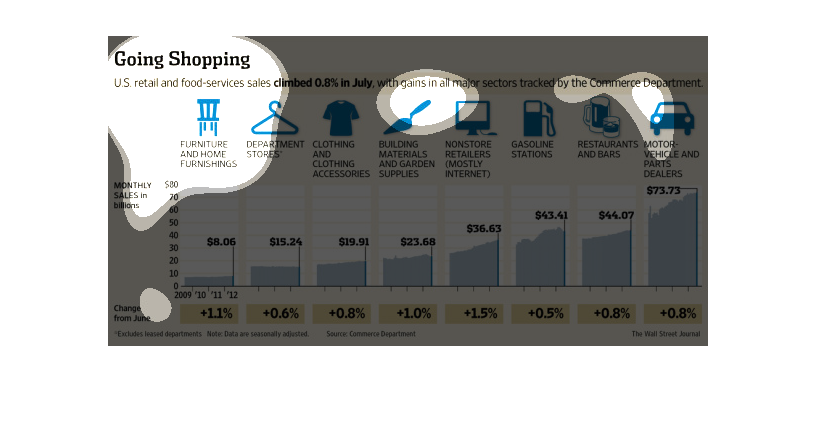
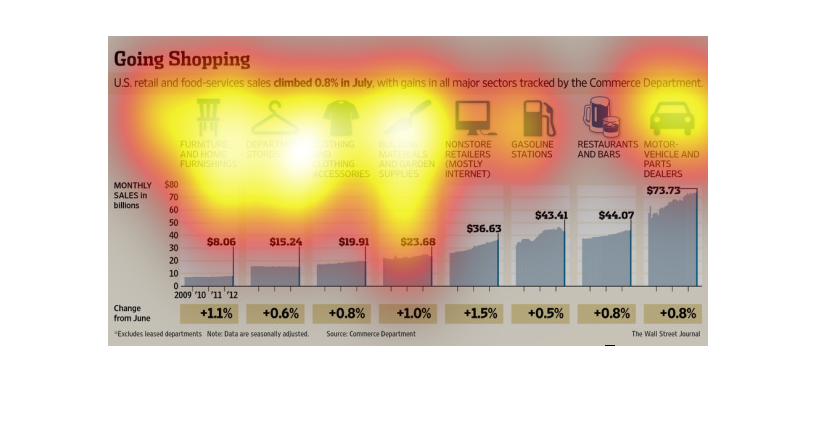
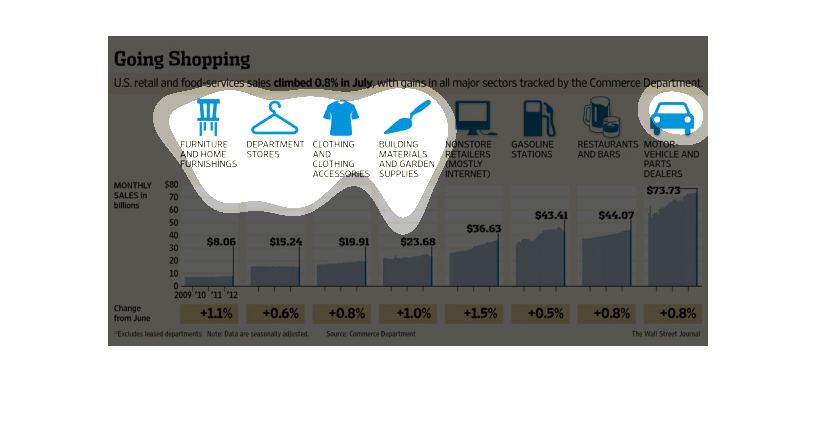
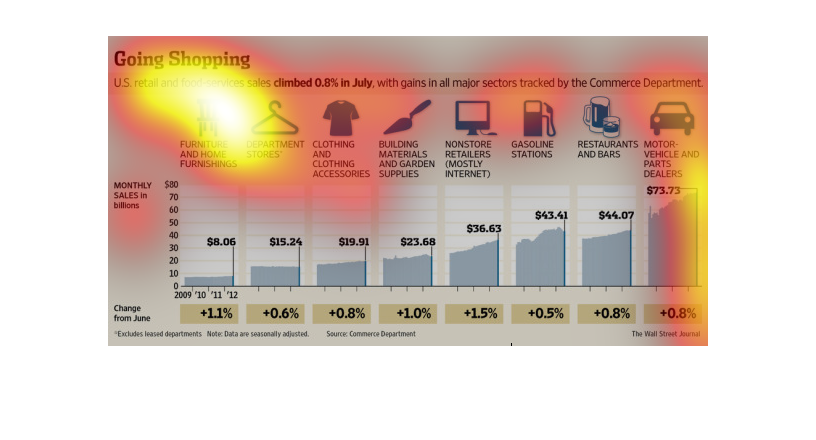
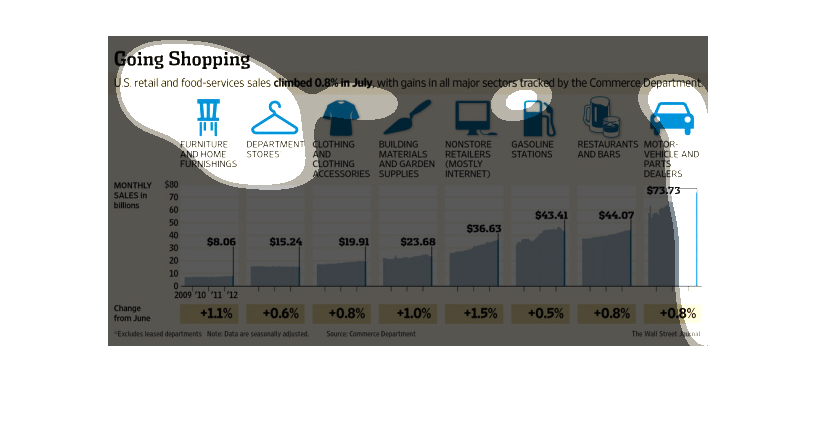
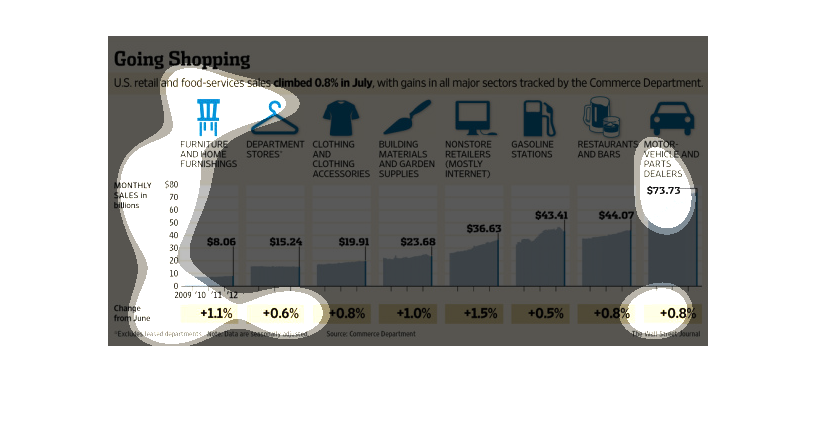
This chart describes going shopping. Specifically, US retail and food services sales climbed
0.8% in July, with gains in all major sectors tracked by the Commerce Department.
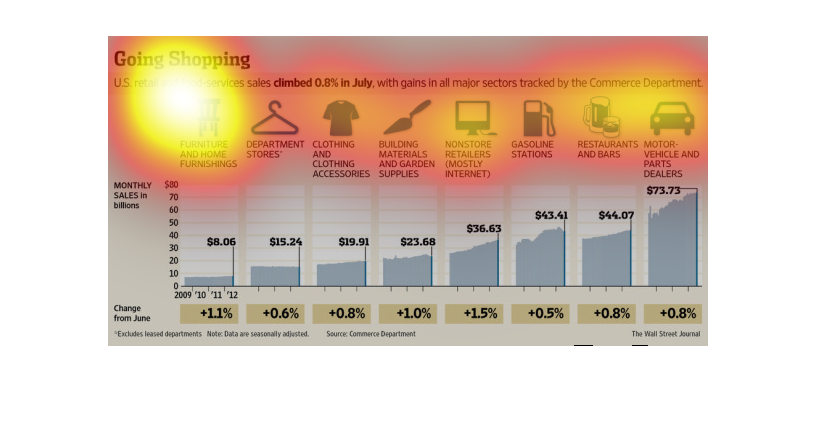
The image depicts US retail and food services sales increasing by 0.8% in July, with gains
in all major sectors. The data indicates increases occurring across the board.
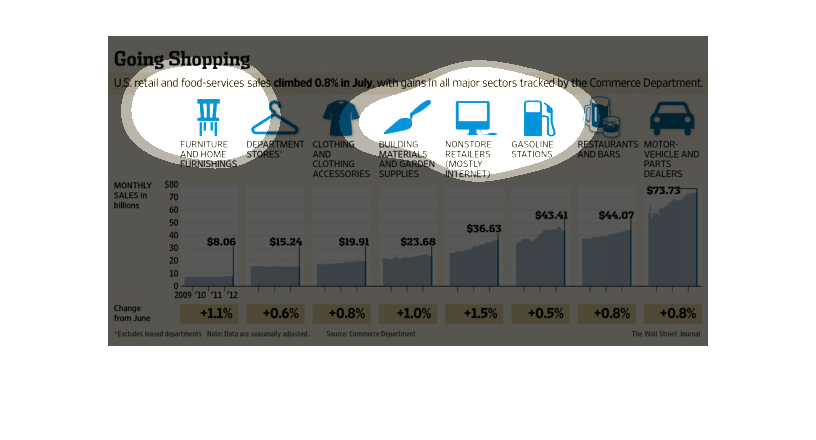
This chart is showing US shopping and food services rising in July. Tracked by the Commerce
Department. Every category from gas stations to garden supplies are seeing a percent increase
in sales.
This study- conducted by the commerce department- states the expenses of the average American
to be quite alarming. In minute detail they show what people choose to spend with their dollar.
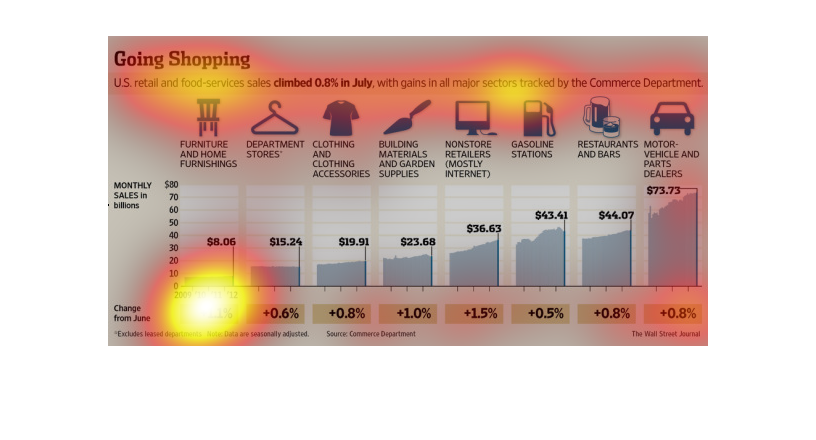
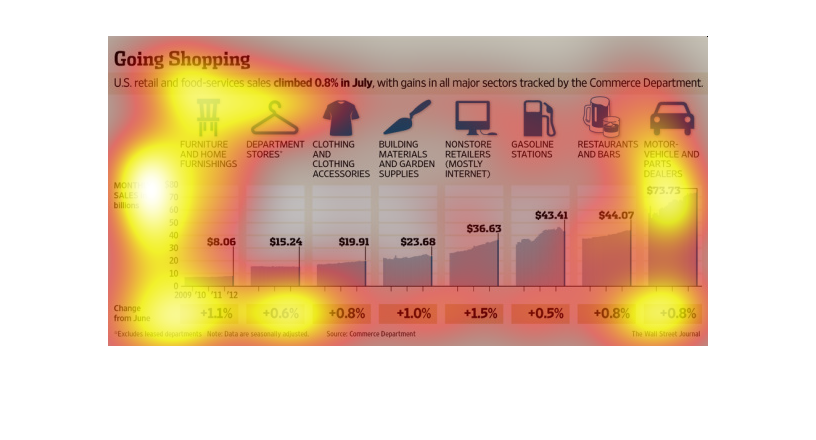
The image describes the sales in the shopping sector in US retail and food services. It shows
the progress of sales from June to July of a variety of sectors for shopping categories.
This chart describes going shopping. Specifically, U.S. retail and food services sales climbed
0.8% in July, with gains in all major sectors tracked by the commerce department.
This is a collection of graphs detailing shopping in the United States. Across the board,
people are recreationally shopping almost a percent more. It's unclear when the graph was
made.
This is a series of statistics and graphics depicting that U.S. retail and food-services sales
climbed 0.8% across all the sectors that the Department of Commerce tracks.
The commerce department has you pegged. They know exactly how you will spend your money and
how much of it. The graph goes into great detail in this endeavor.
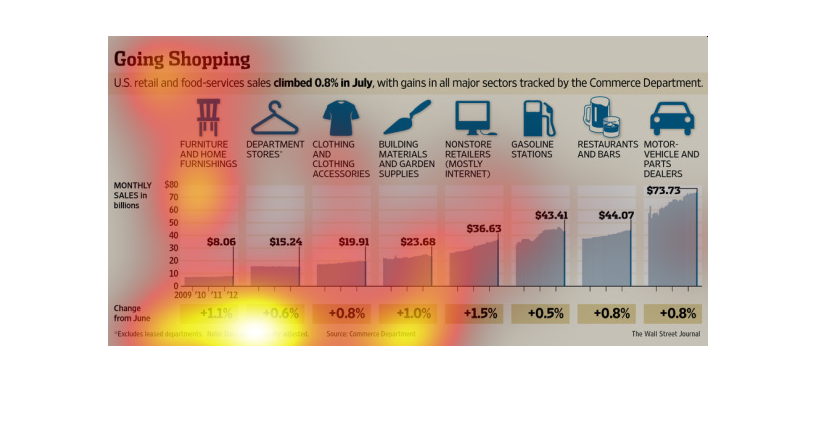
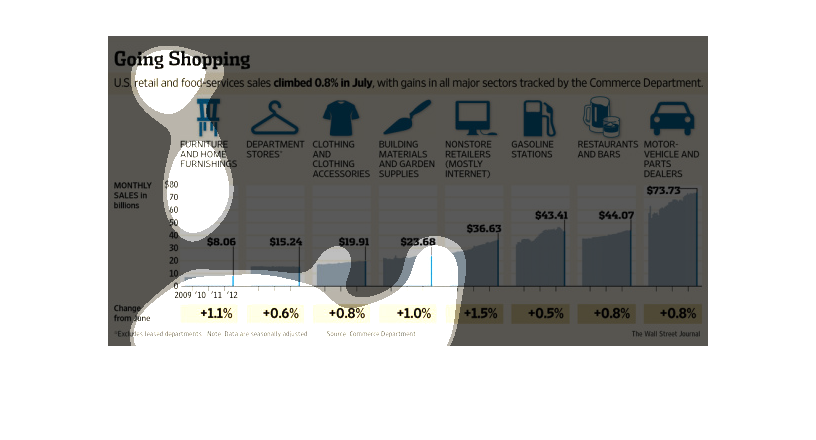
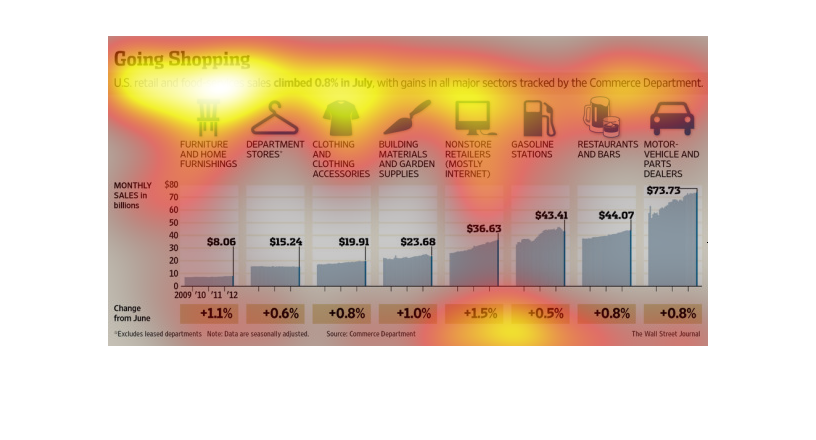
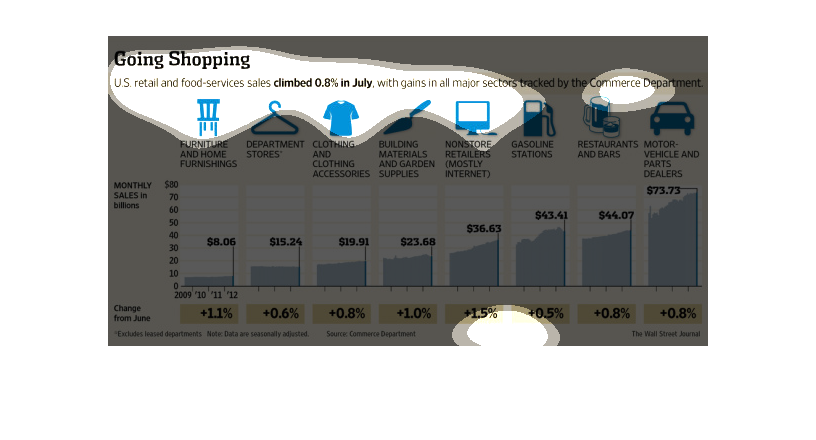
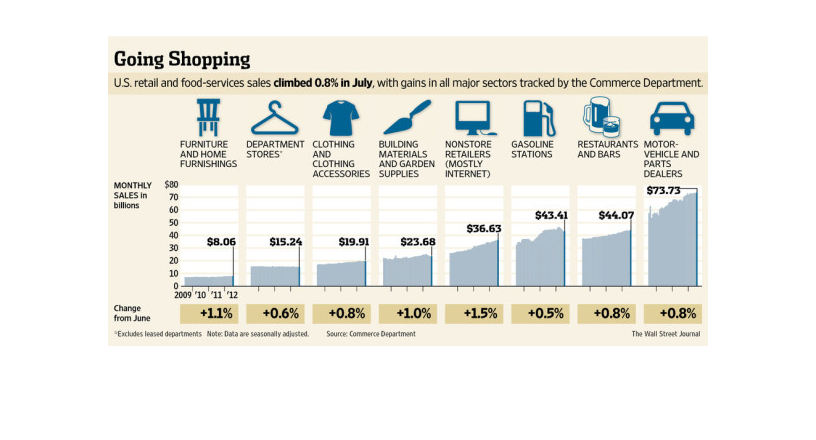
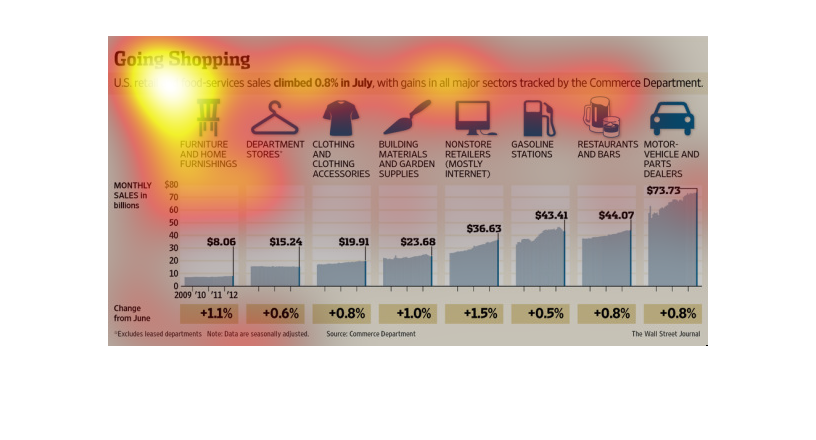
This graph illustrates trends in US retail sales in various categories including furniture,
department and clothing stores.  It shows the greatest increase in motor vehicles and parts
dealers sales.
The image depicts US retail and food services sales increasing to the tune of 0.8% in July,
with increases in all major sectors tracked by the Commerce department. The image indicates
good news in terms of consumer spending.
Bar graph depicting the growth of American expenditures and tracking said expenditures monthly
from June; they found that motor vehicles were the greatest increased expenditure in American
budgets for the month, followed by Restaurants and bars, the gasoline, each industry up .8%,.8%,
and .5% respectively
This is a series of statistics laid out graphically depicting that US retail and food-services
sales had climbed 0.8% as tracked across all metrics followed by the Commerce Department.
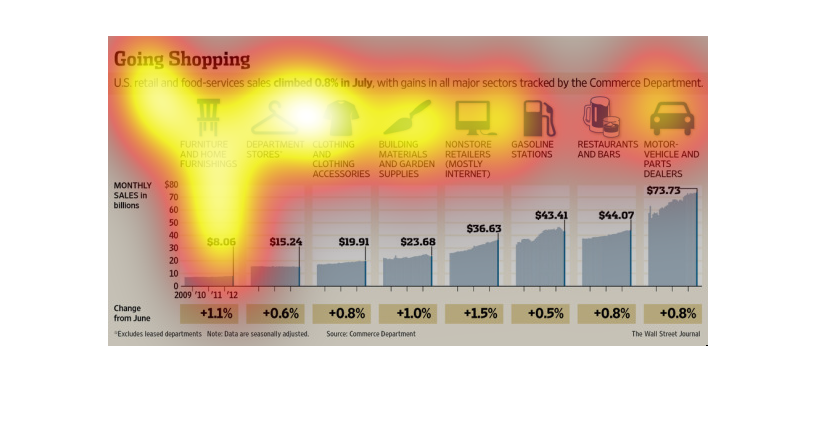
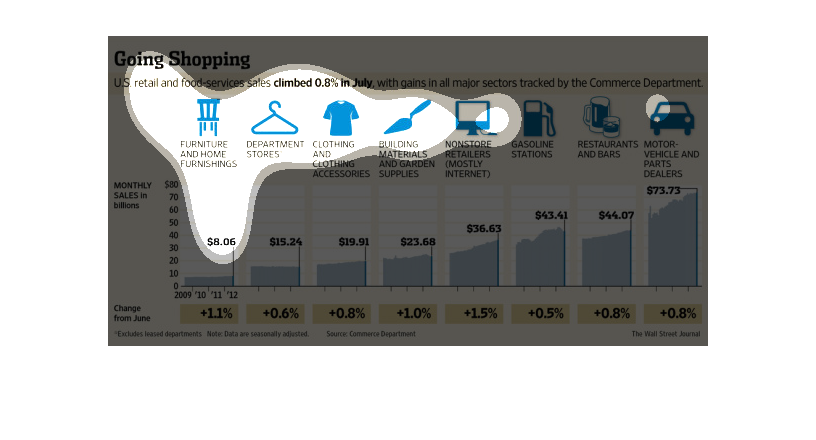
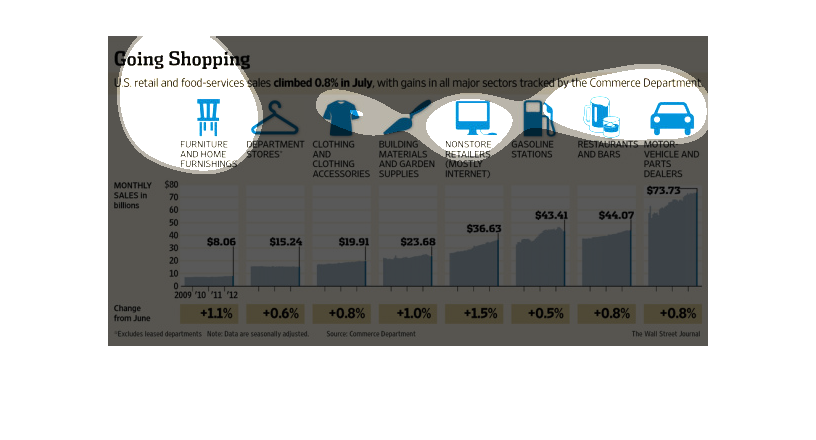
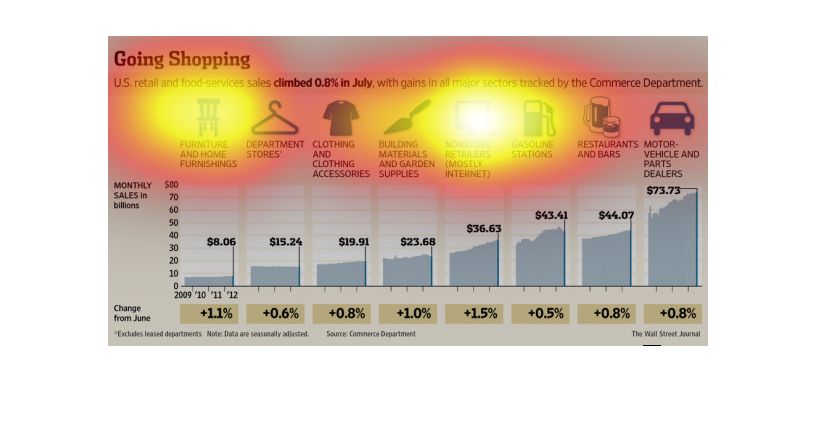
This chart is showing how U.S. retail and food services climbed 0.8% in July-- with gains
in all major sectors tracked by the Commerce Department. The "Non-Store Retailers" grew the
most by 1.5 %