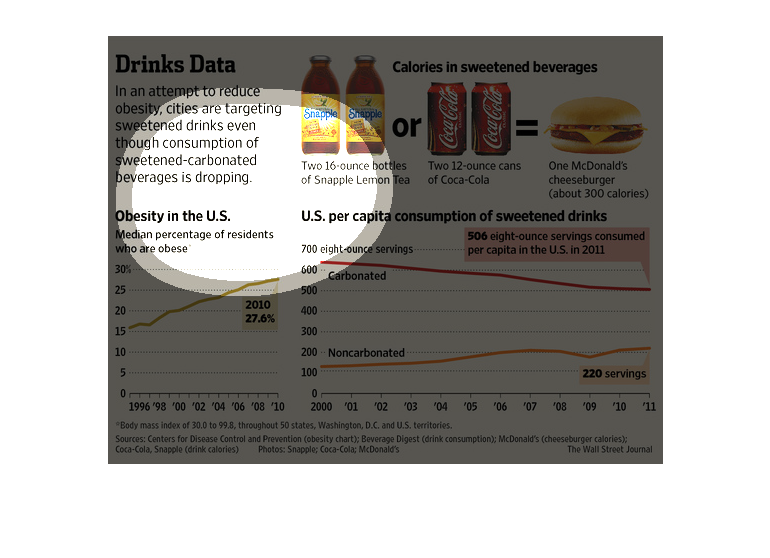
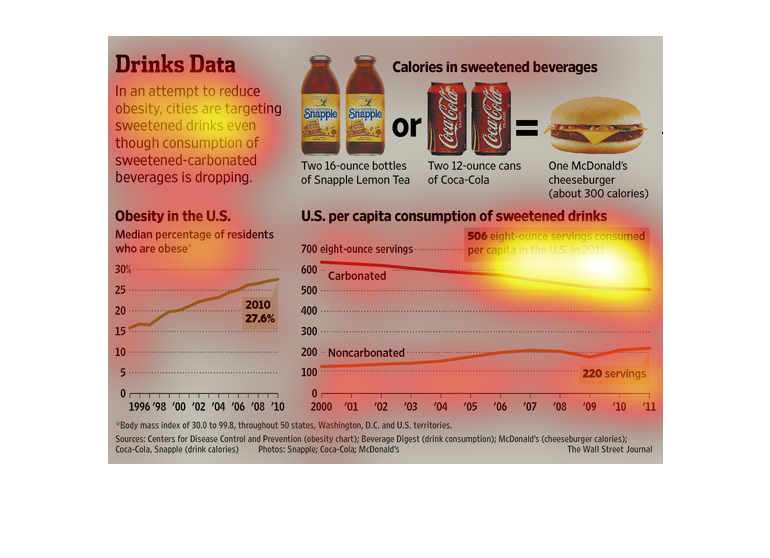
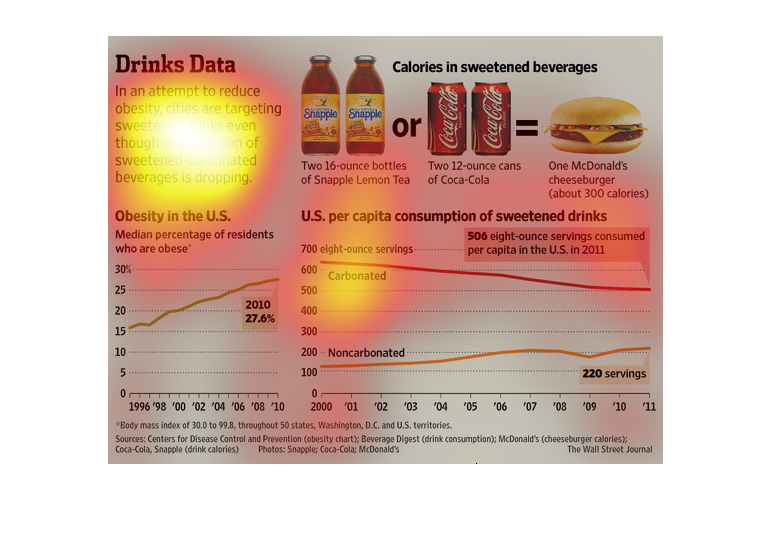
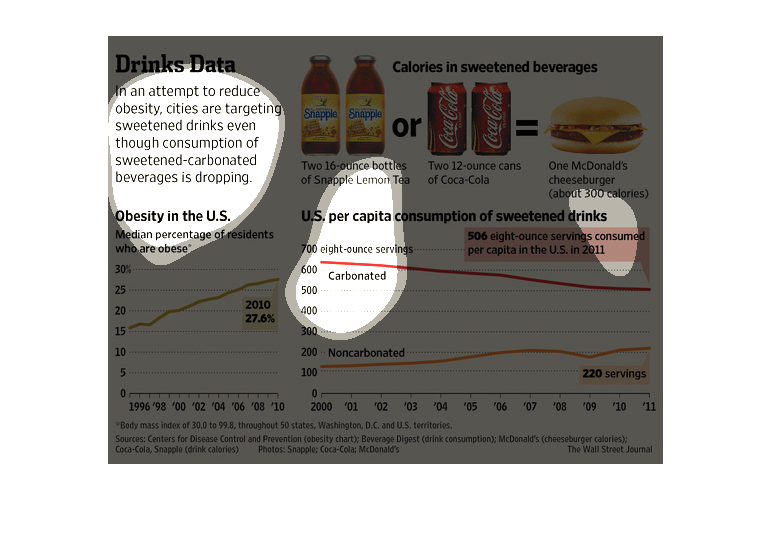
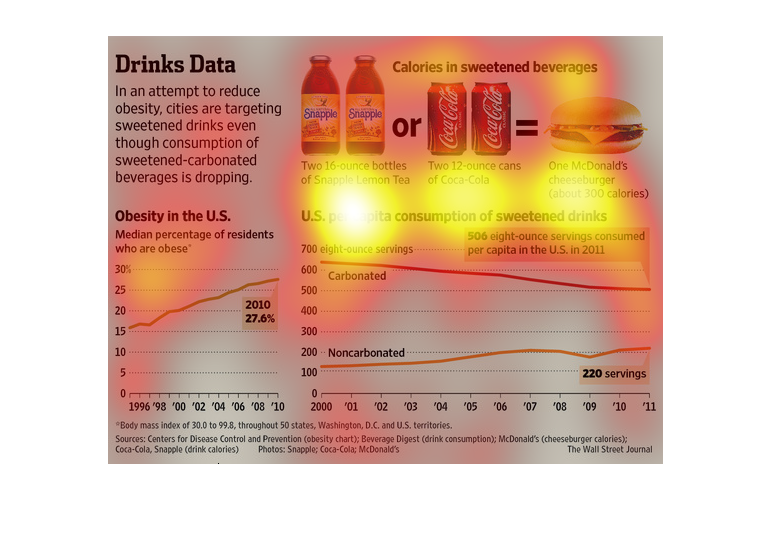
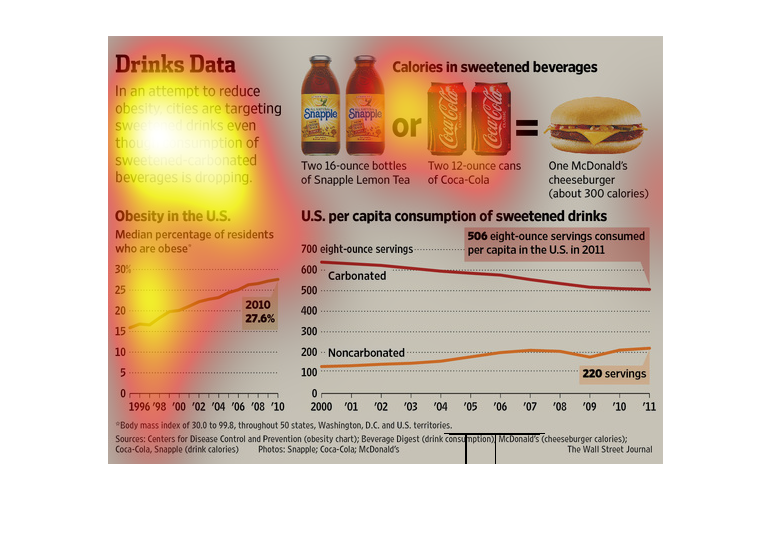
The image depicts how cities are attempting to target obesity by specifically targeting sweet
drinks, even though consumption of sweetened carbonated drinks is decreasing already.
This is a graph showing how they are starting to attack sweetened drinks because they are
causing health problems. This also shows about obesity in the US and that it could be from
the drinks.
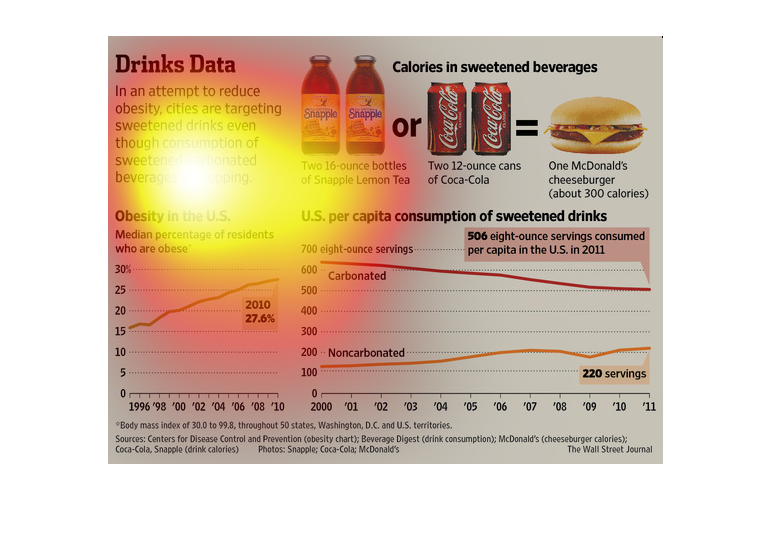
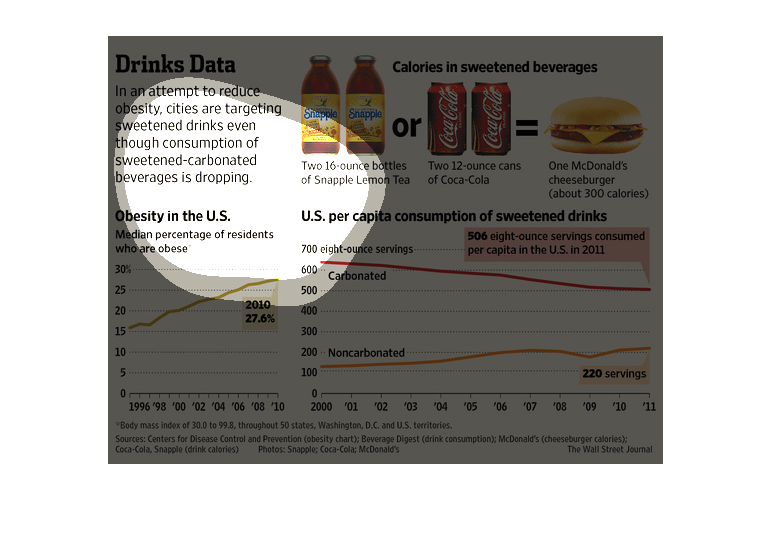
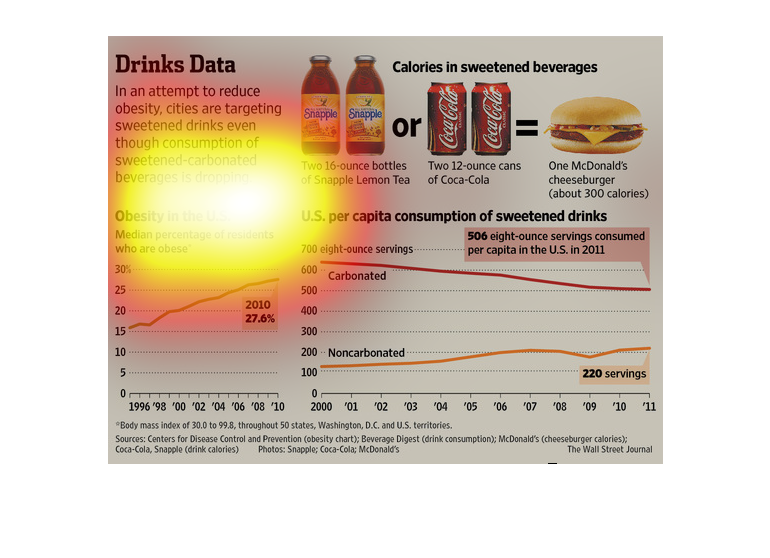
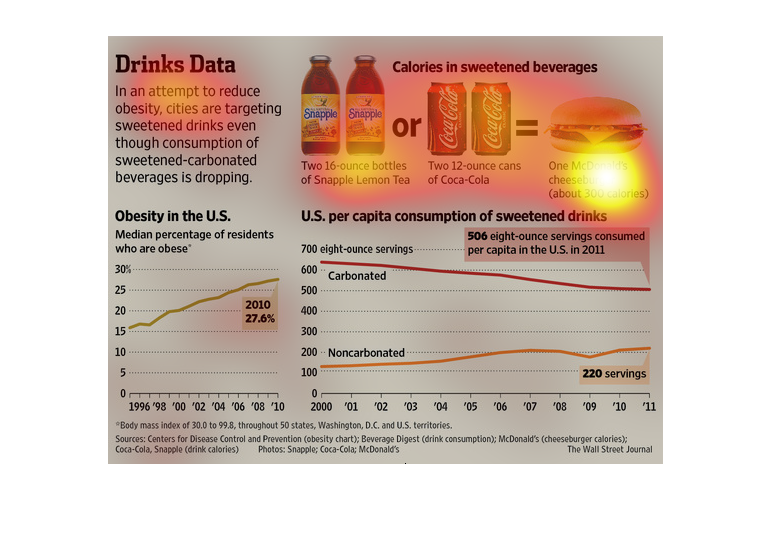
This is set of data about the sweetened drinks, their consumption, their caloric values, and
the obesity rate in the U.S. In 2010, the obesity rate in the U.S. had risen to 27.6 %.
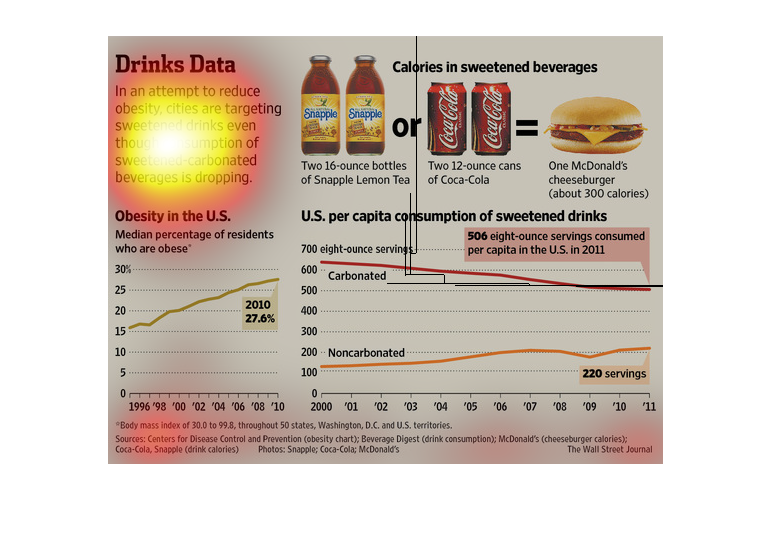
The number of carbonated beverages has fallen from 2000 to 2011, while the number of non-carbonated
beverages consumed as risen only slightly.

This chart links obesity to sweetened beverages and tells the amount of sugar and calories
present in different popular beverages and the per capita consumption of sweetened drinks.
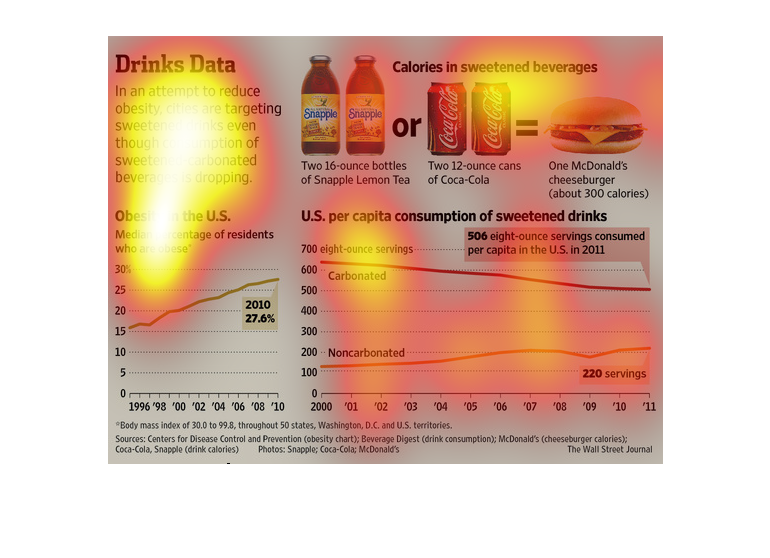
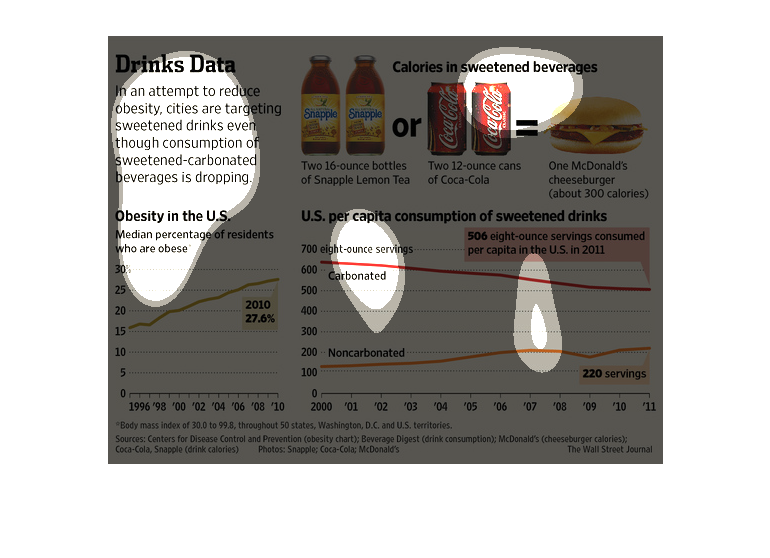
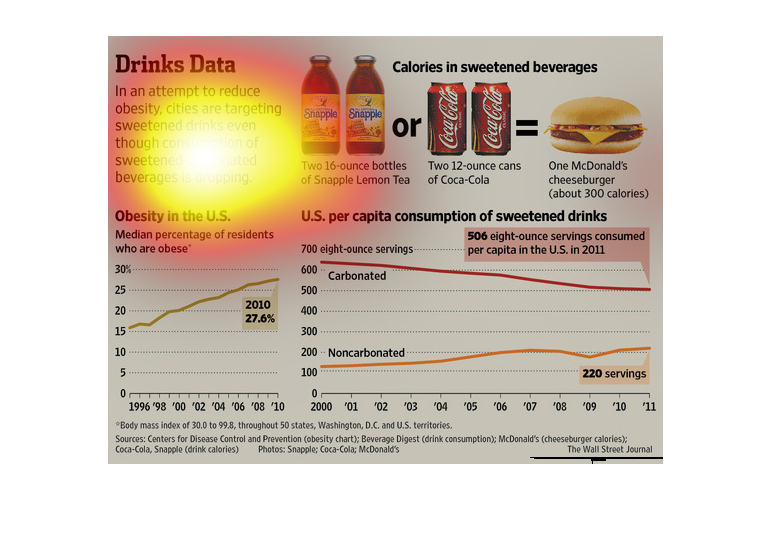
It an attempt to reduce obesity, cities are targeting the sells of sugary carbonated drinks
even though the sells have been dropping.    Two 16 ounce bottles of Snapple Lemon Tea or
two 12 ounce cans of Coca-Cola equal one McDonald's cheeseburger (300 calories).  Obesity
in America , 15% in 1996 has risen to 27.6% in 2010.  US per capital consumption of sweetened
carbonate drinks, in 2000 we consumed about 650 eight ounce carbonated drinks and about 110
eight ounce non-carbonated drinks.  In 2011, we consumed 506 eight ounce carbonated drink
and 220 eight ounce servings of non carbonated drinks.
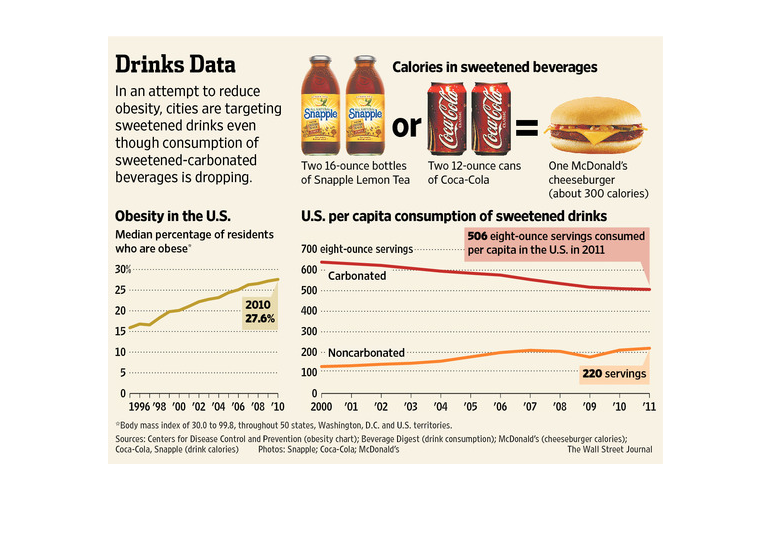
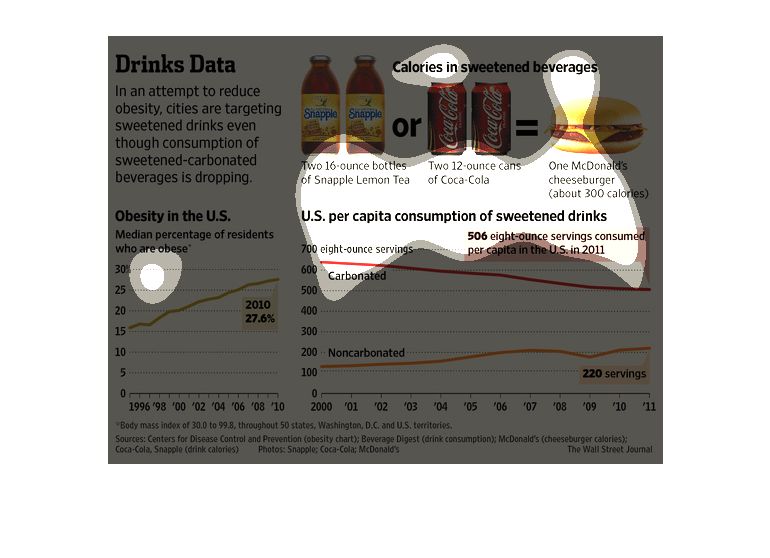
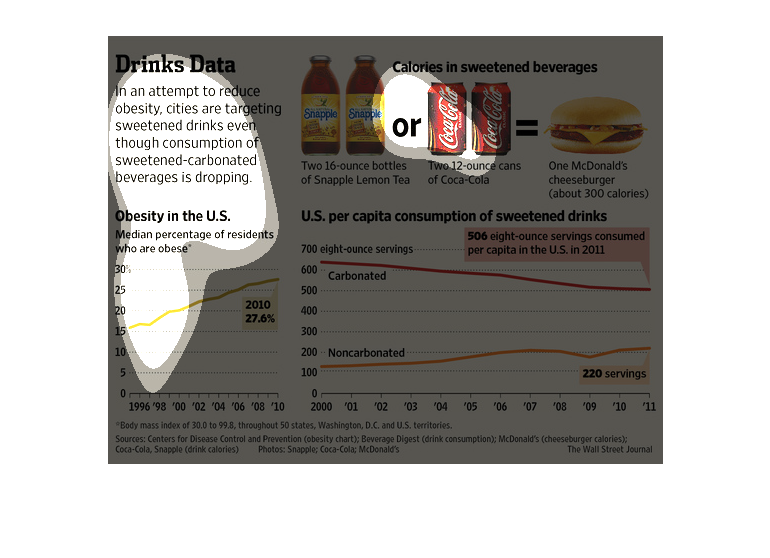
This chart shows the calories in sweetened beverages, obesity in the US,and consumption of
sugary drinks. Almost 30% of the population is obese. Two cans of coke has the same number
of calories as a McDonald's cheeseburger (300). Consumption of carbonated drinks has decreased,
but consumption of non carbonated drinks has increased since 2000.
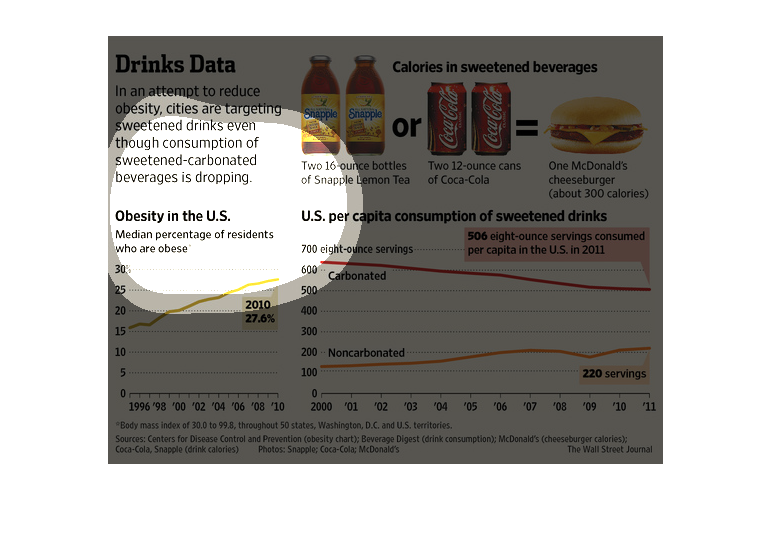
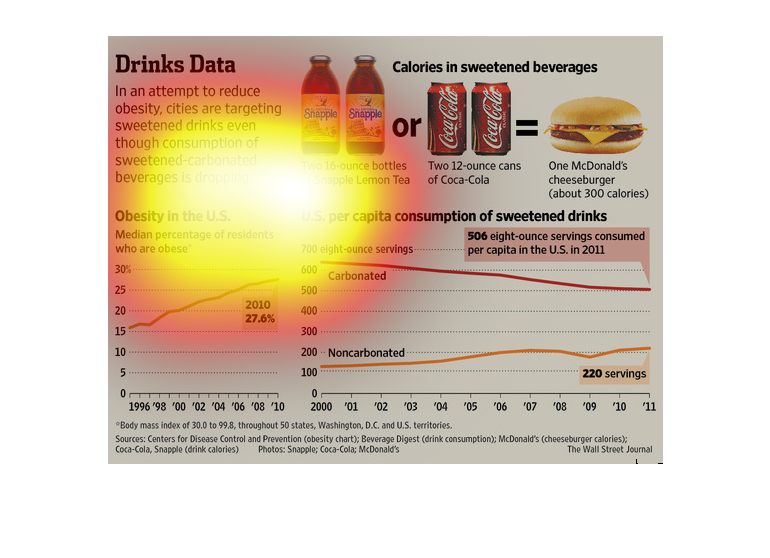
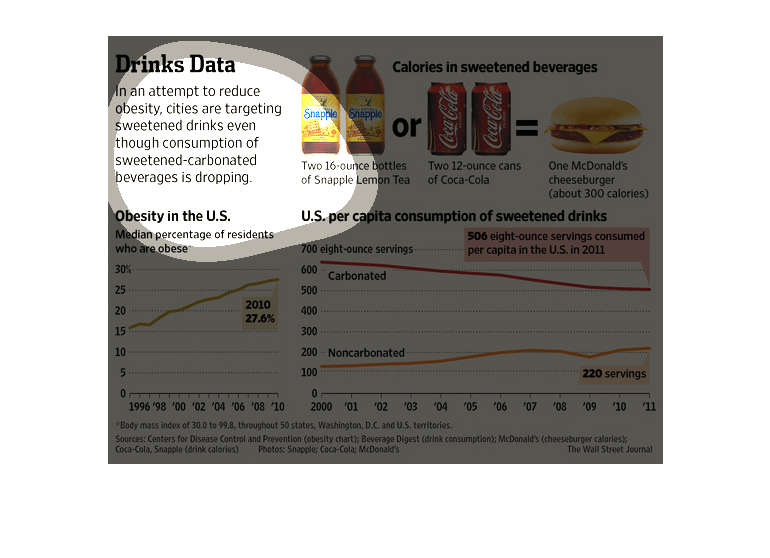
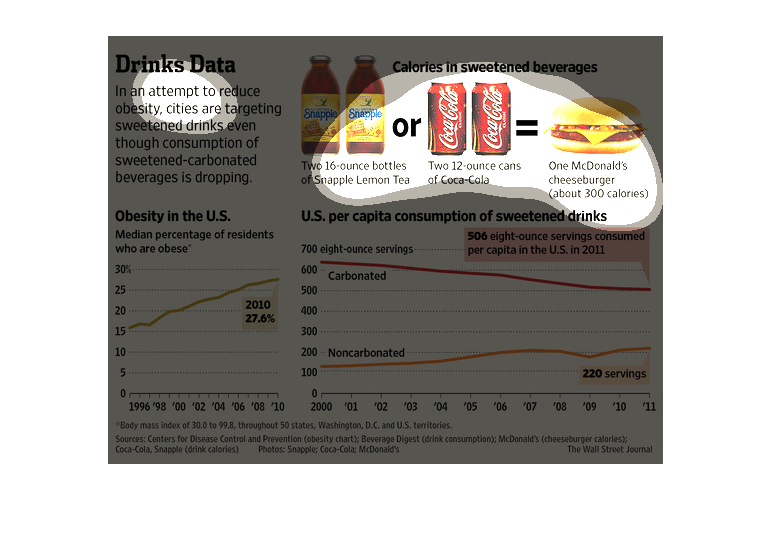
This chart describes drinks data. Specifically, in an attempt to reduce obesity, cities are
targeting sweetened drinks even though consumption of sweetened carbonated  is dropping.
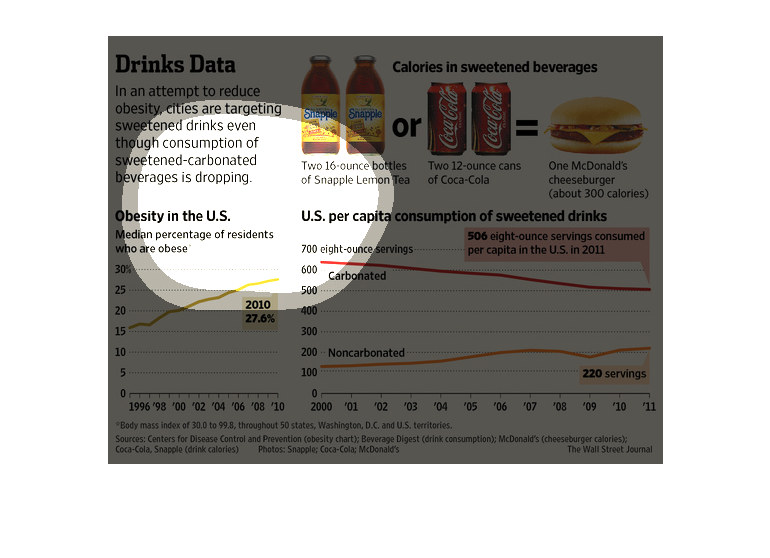
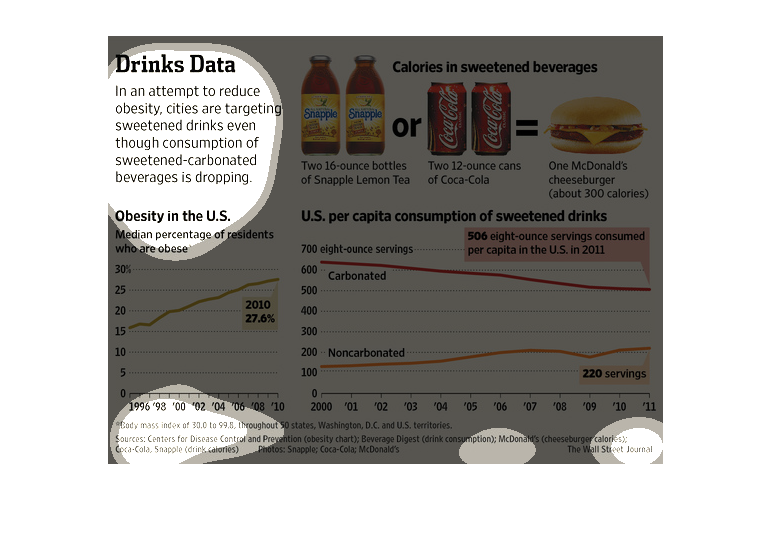
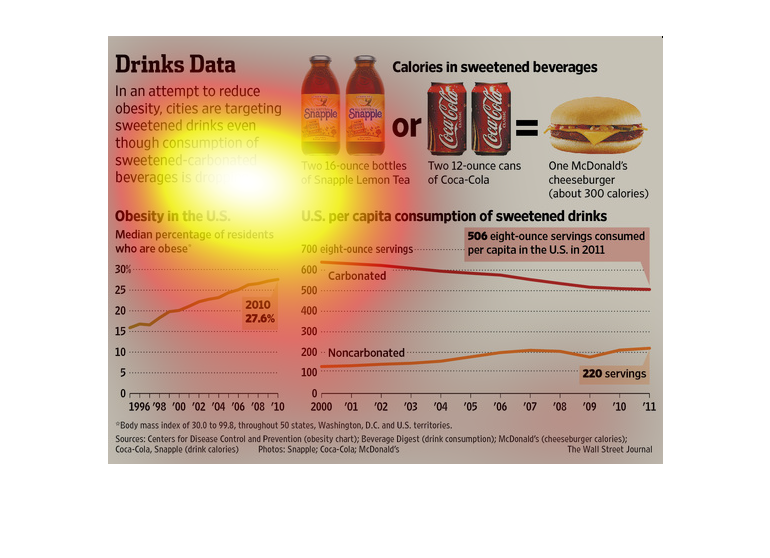
This chart describes drinks data. Specifically, in an attempt to reduce obesity, cities are
targeting sweetened drinks. The chart contains photographs to enhance the information presented.
In this study conducted by the Wall Street Journal from a variation of sources tries to pinpoint
what is exactly the reason for this Obesity epidemic, even though soft drinks are on the decline.
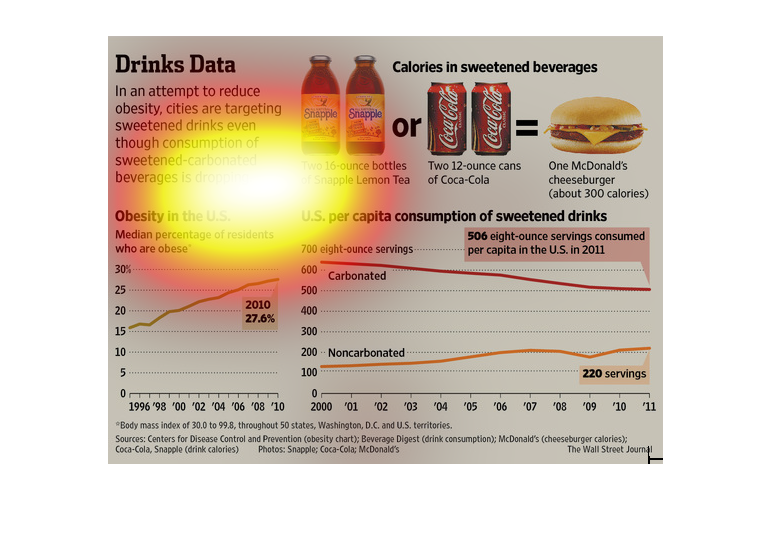
This chart from the Wall Street Journal shows how to target obesity certain cities are targeting
unhealthy and sugary drinks. It shows decreases in consumption
This chart/graph shows an attempt at reducing obesity by using less sugar drinks, but the
numbers show that the rate of drinking sugary drinks are dropping. They have a percent graph
of obesity in the USA.
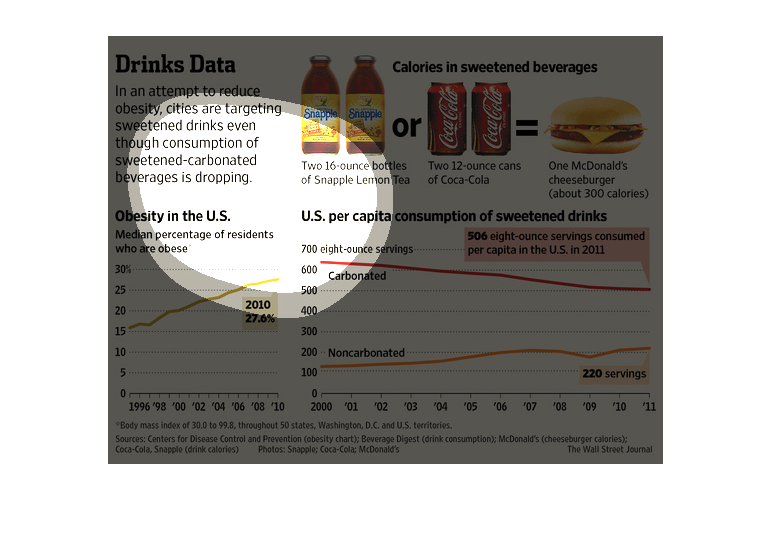
Sugared drinks are a mayor contribute to the obesity epidemic sweeping the United States of
America. In this study we see the measures that people are tying to implement to stop this.
This is a series of diagrams, charts and related statistics depicting that even though consumption
of sweetened beverages was down, cities were targeting these drinks in an attempt to battle
obesity.