This is a series of color coded charts and related statistics depicting the average temperature
for all observation sites in the contiguous 48 states for the month of July since 1895.
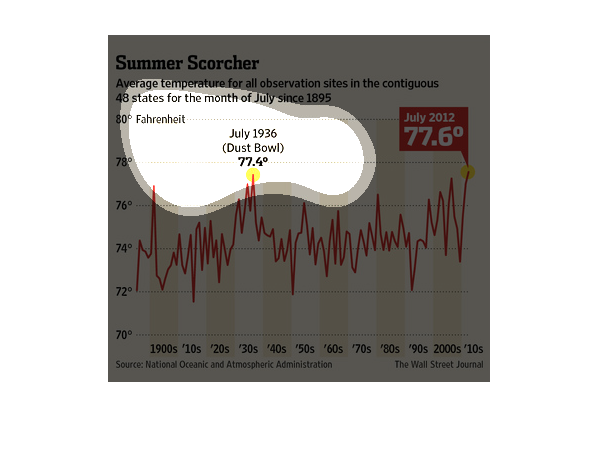
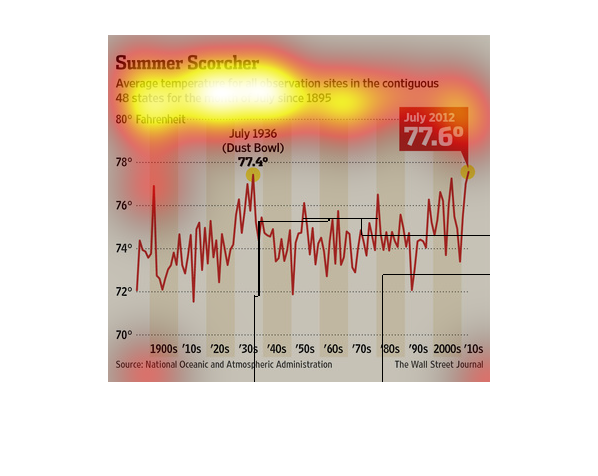
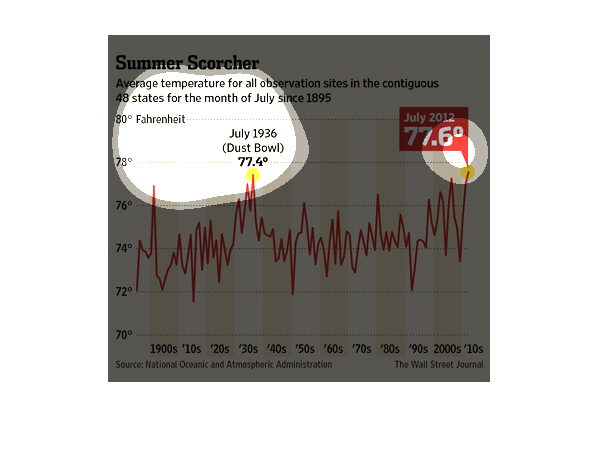
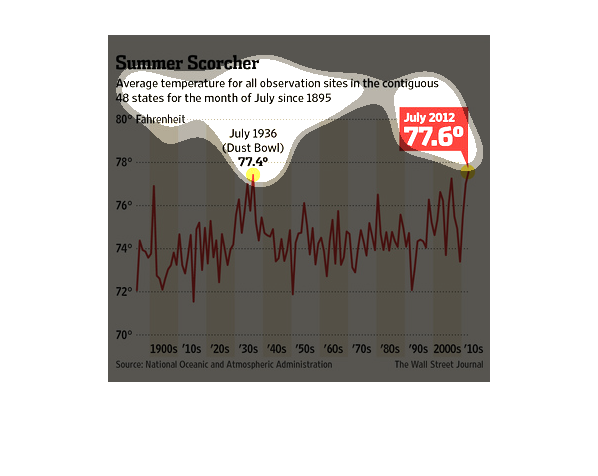
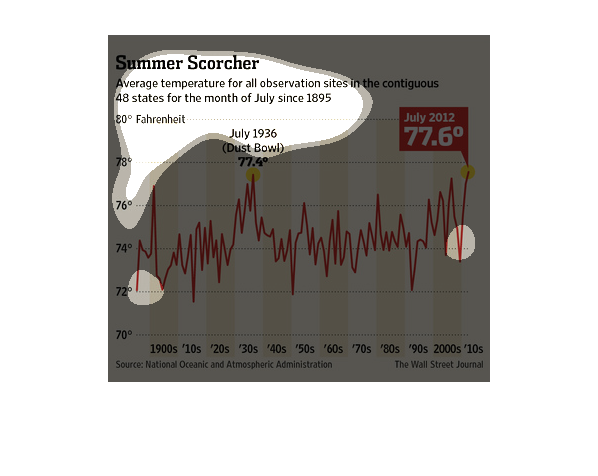
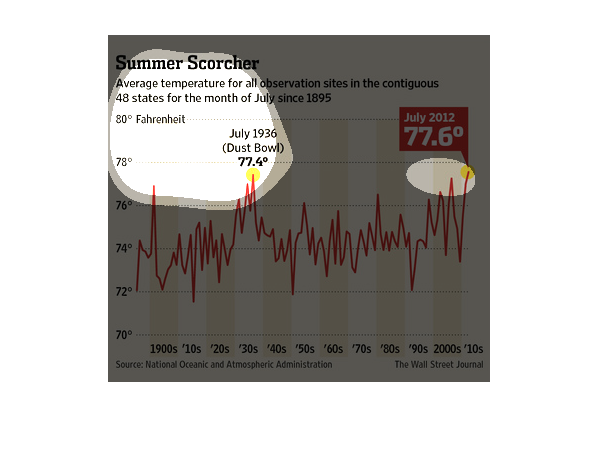
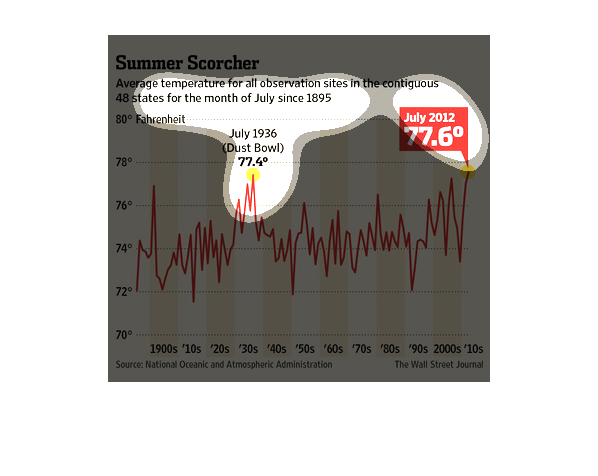
This chart shows the average temperature in the contiguous United States during the month
of July for each year from 1895 through the 2012. The data is averaged from all observation
point in the 48 contiguous states for the entire month of July during each of these years
and shows that average temperatures during recent years have approached and eventually exceeded
the highest point from the previous years since 1895.
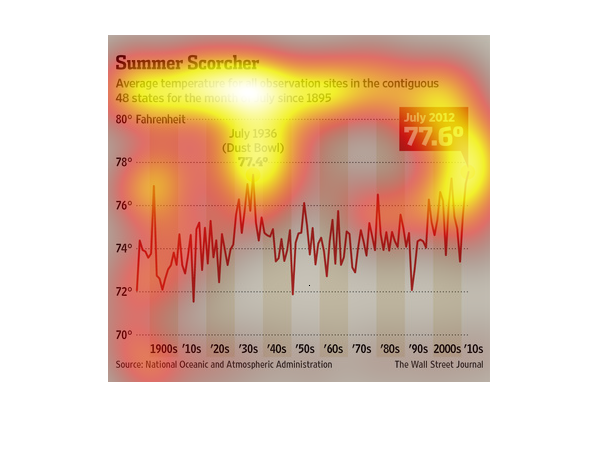
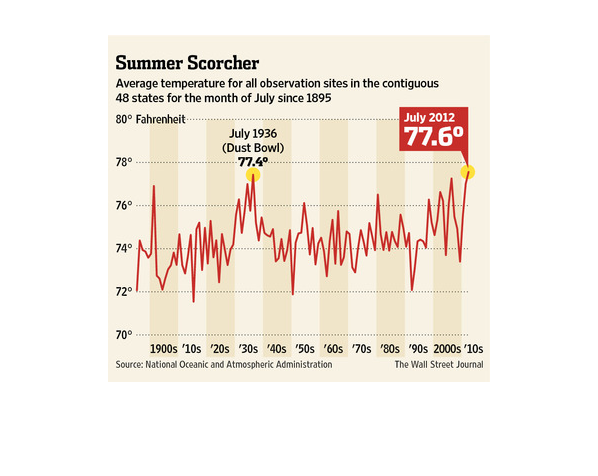
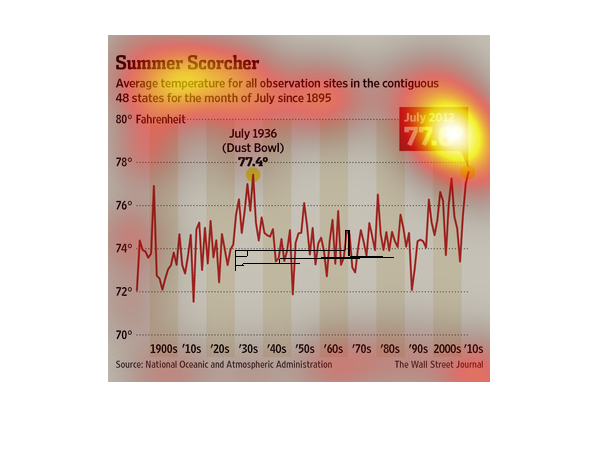
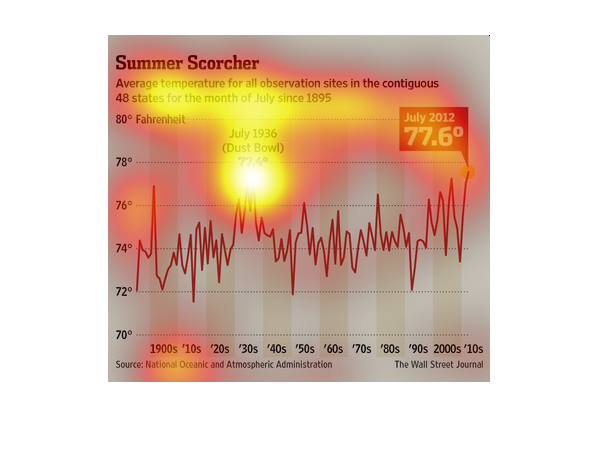
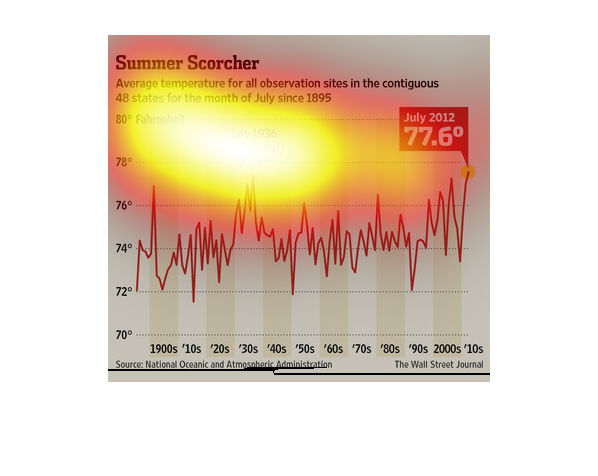
This chart from the Wall Street Journal shows how temperatures in the united states are at
an all time high and may be due to global warming.
The graph shows the temperature of the summer days along with the years. The temperature kept
increasing over the years as well as reaching 77.6 degrees Fahrenheit during July 2012
This chart shows the average July temperature for all contiguous states since 1895. The average
temperature in 2012 was 77.6 degrees, the average temperature during the dustbowl was 77.4
degrees.
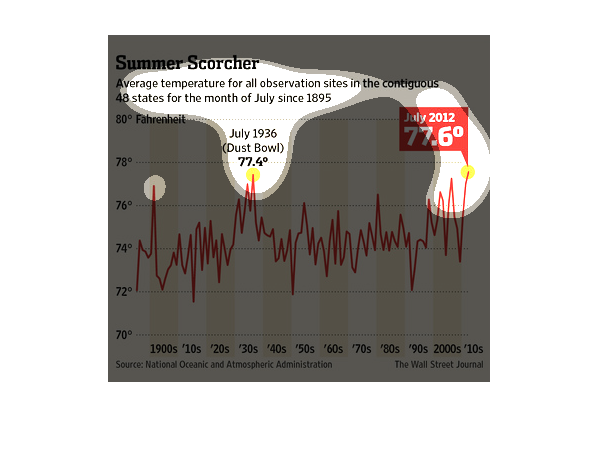
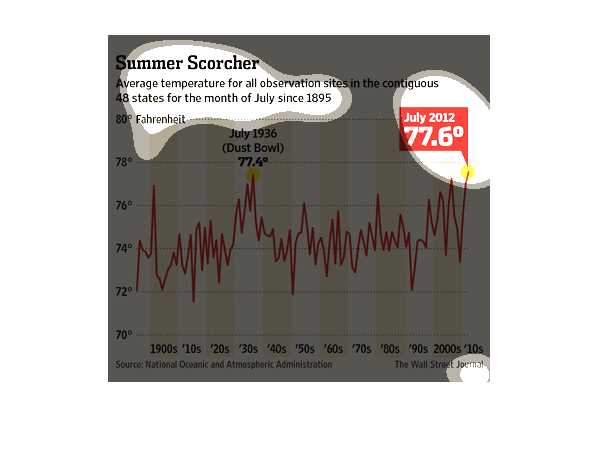
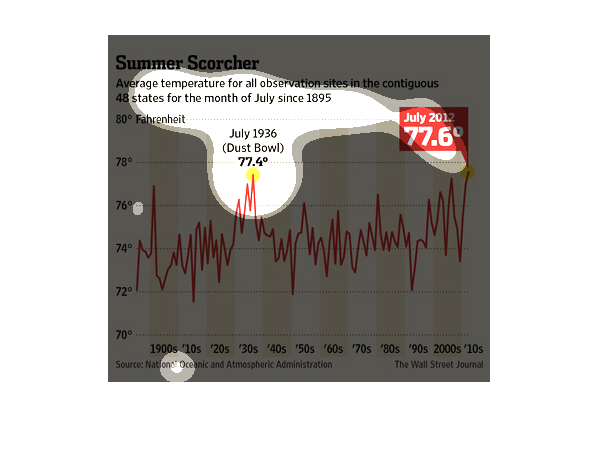
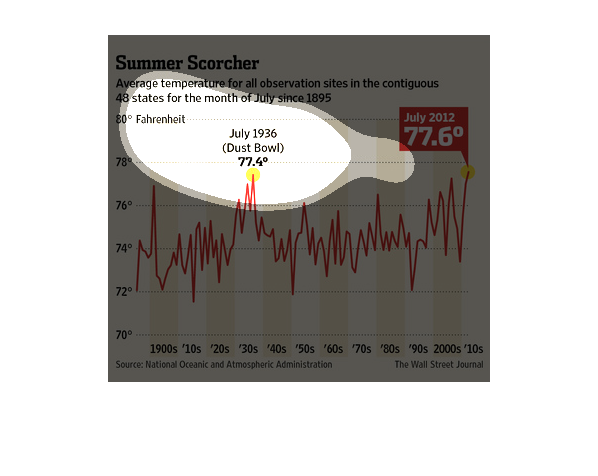
This chart show the average temperature for the 48 contiguous states in the month of July
since 1895 on conservation sites. The graph is set up to show each ten years. This chart was
made by the National Oceanic and Atmospheric Administration for the Wall Street Journal.
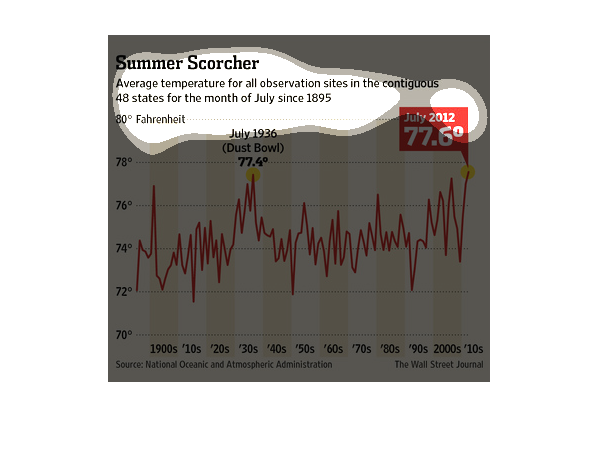
Summer Scorcher | average temperature for all observation sites in the contiguous United States
since 1895. Temperature according to line graph shows a massive fluctuation in temperature
with the variations getting wider over time with a predictable low cycle and an increasingly
higher highs.
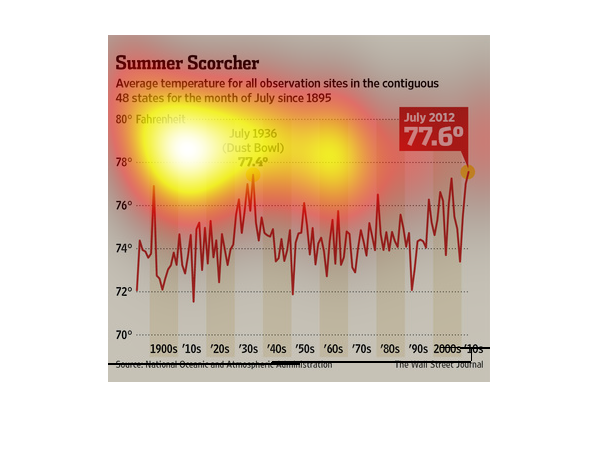
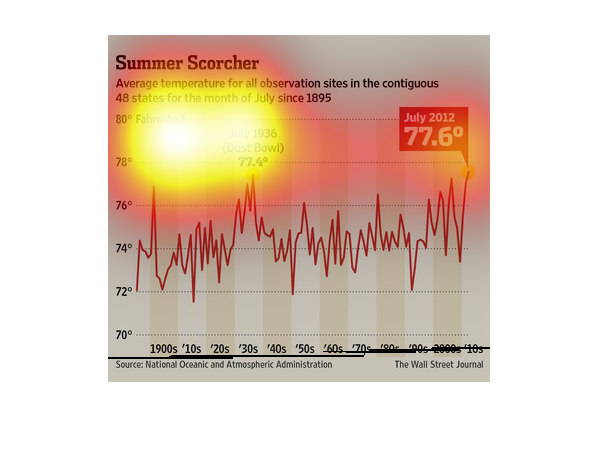
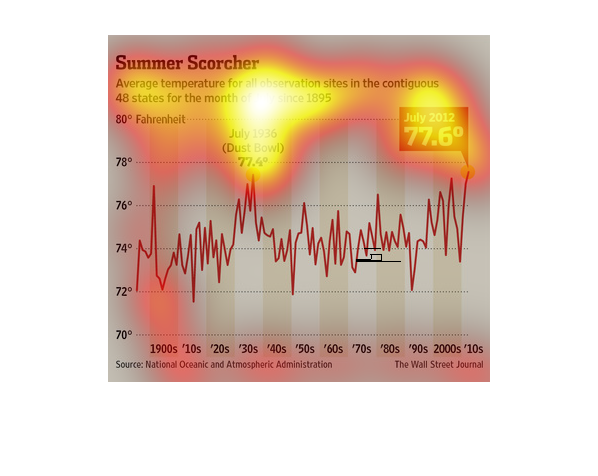
This graphic shows how average temperatures in the summer have risen in the contiguous United
States. Data was taken from the 1900's to the 2010's. A high of 77.6 has been recorded.
This chart from the Wall Street Journal shows how summer temperatures are at record highs
due to the global warming phenomena the world is experiencing.
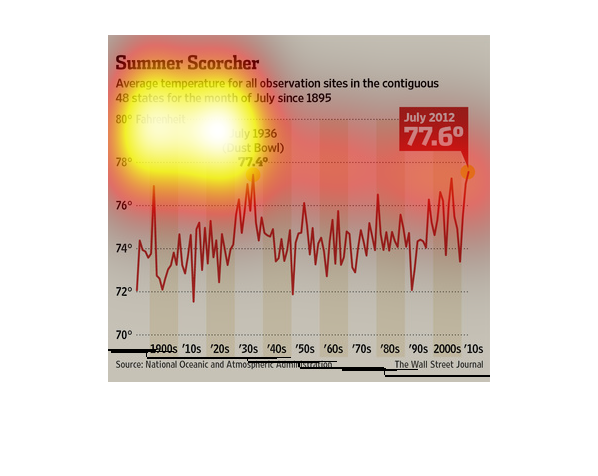
This chart describes summer scorcher. Specifically, average temperature for all observation
sites in the contiguous 48 states for the month of July since 1895.
This graph displays the recorded temperatures for all observation sites in the contiguous
48 states of the US since the year 1895 and shows a spike in the 1930s as well as a slow increase
over time.
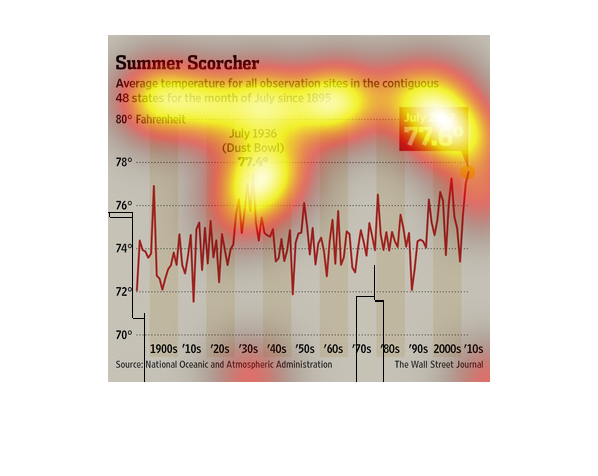
Summer Scorcher is the title of this single graph:   Average temperature for all observation
sites in the continguous 48 states for the month of July since 1895.  In the 1900s, not even
78 degrees. In the 2010s, 77.6 degrees (July 2012)