This chart from the Wall Street Journal shows the change in gold imports for India and how
it has declined over time. Other than that it is hard to read

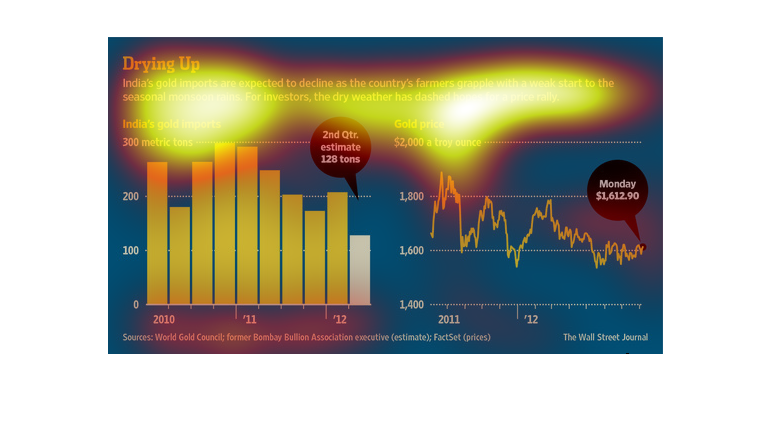
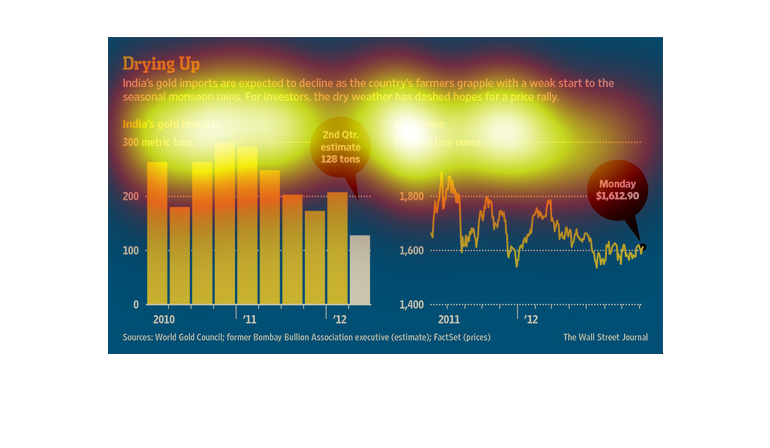
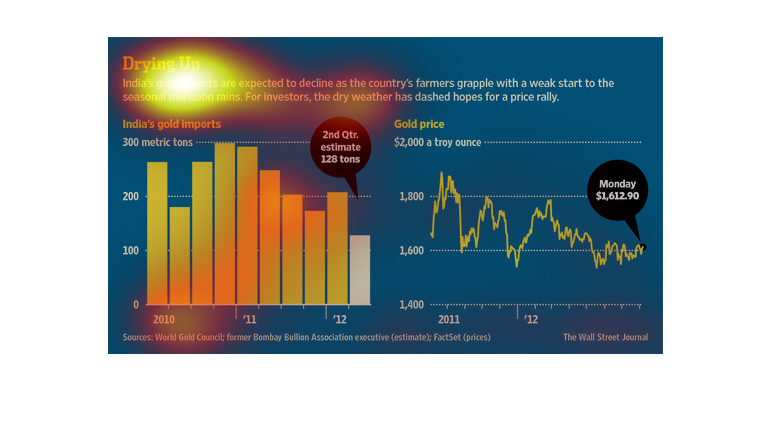
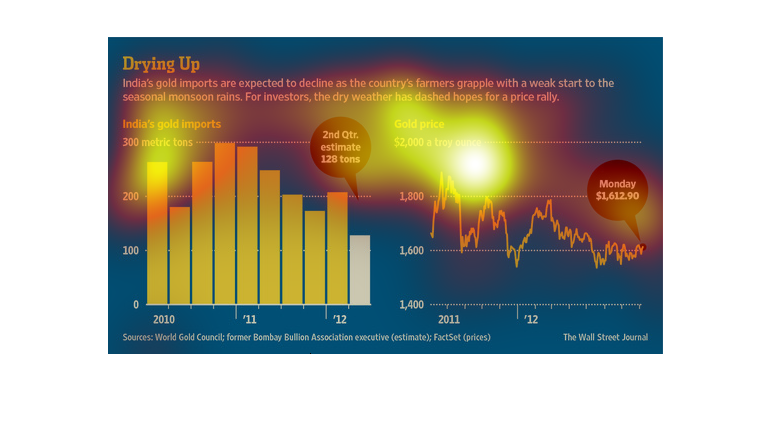
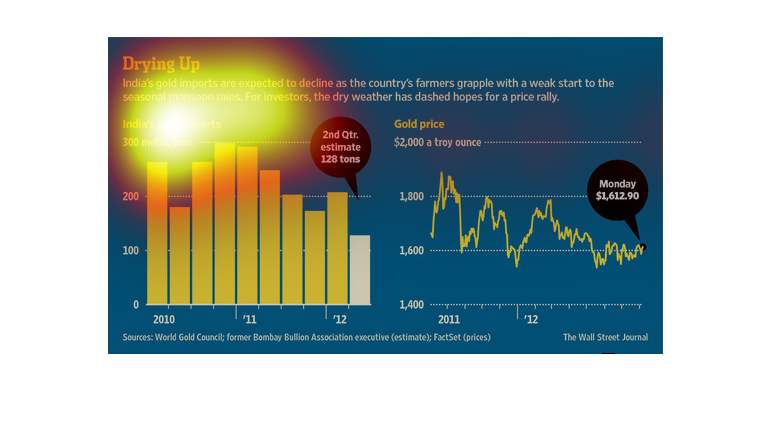
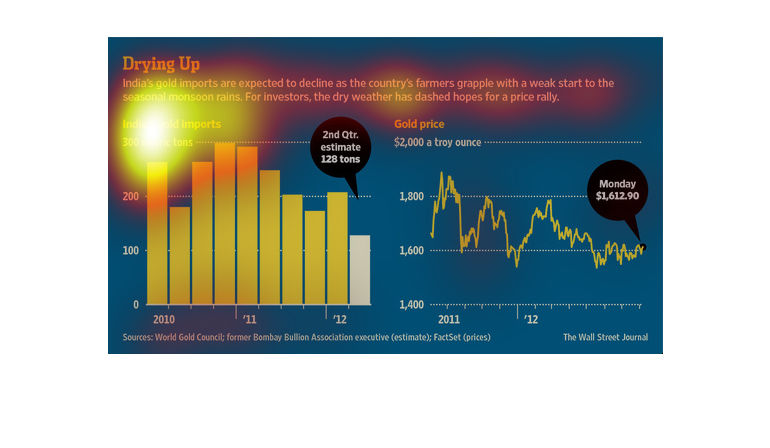
This chart shows how India's gold imports are expected to decline as the country's farmers
deal with a weak start to seasonal monsoon rains.  The left side shows gold imports and the
right side shows gold sales.
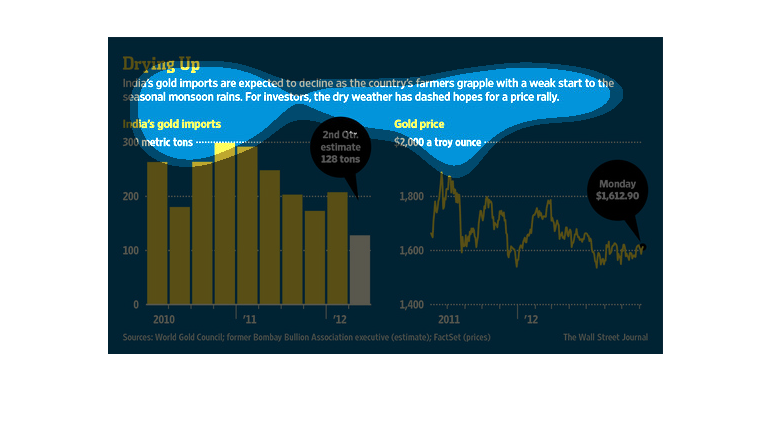
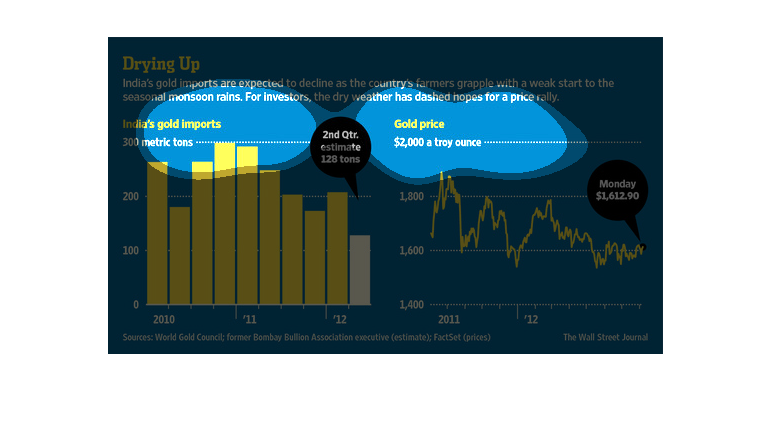
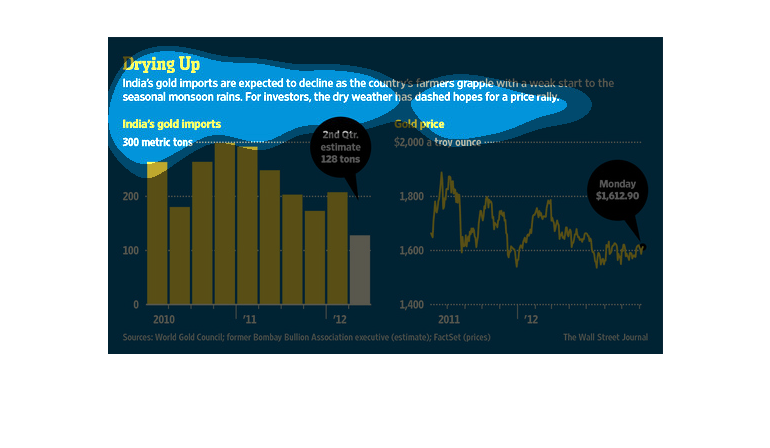
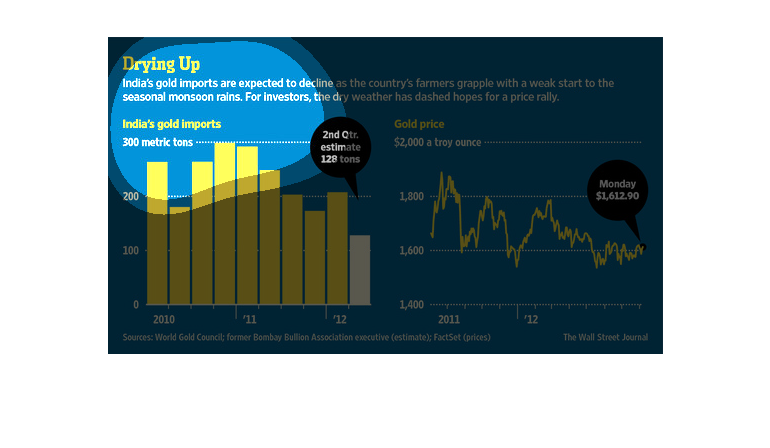
This chart describes drying up. Specifically, India's gold imports are expected to decline
as the country's farmers grapple with a weak start to the seasonal monsoon.
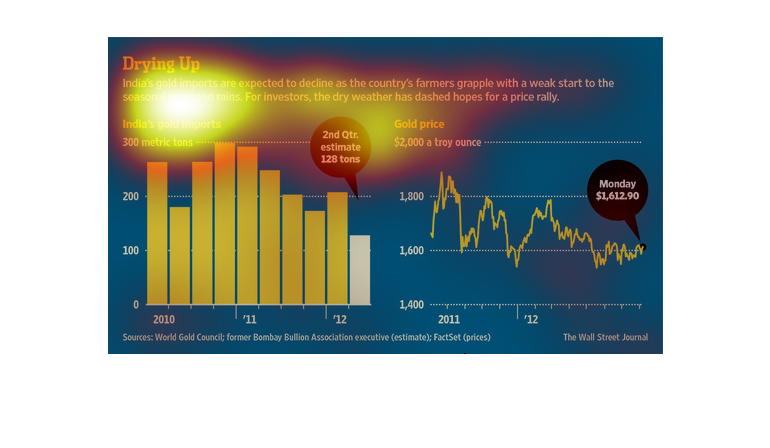
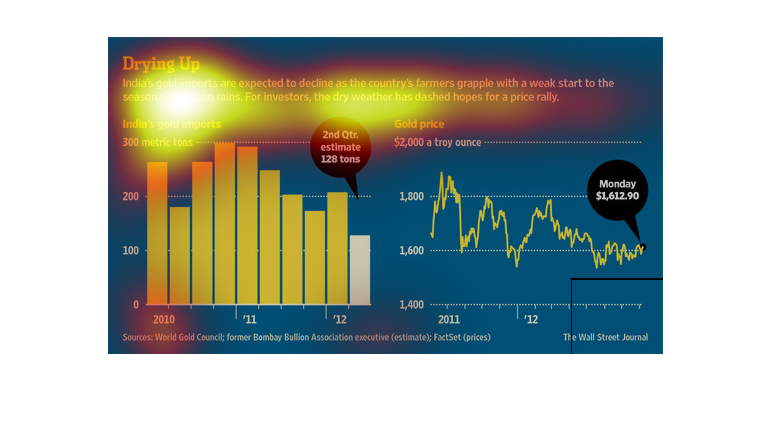
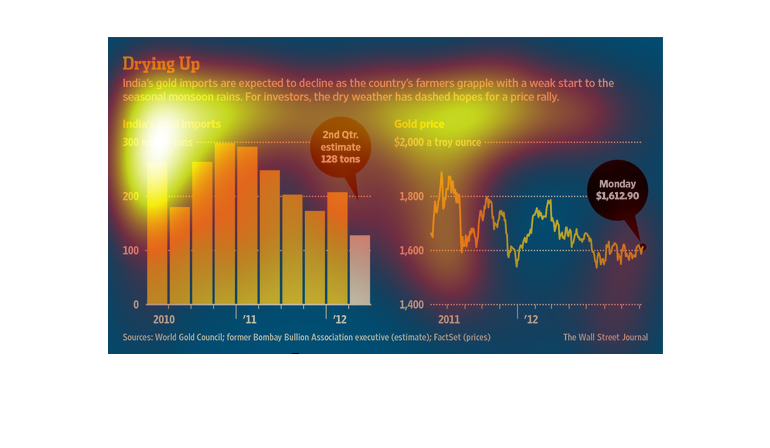
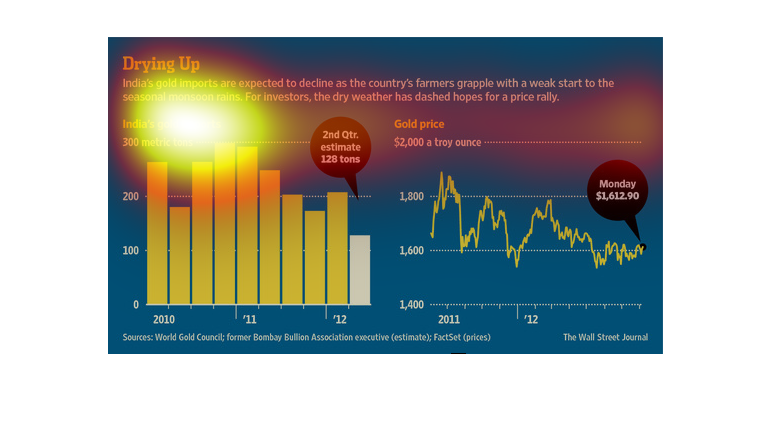
This bar graft depicts the suspected decline of India's gold imports as the country's farmers
continue to grapple with a weak start to the seasonal monsoon rains. Due to the dry season
the investors are not holding out much hope for a rally in price.
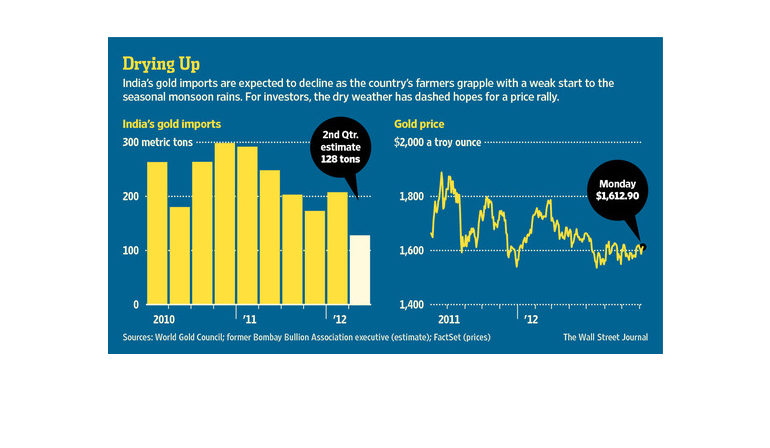
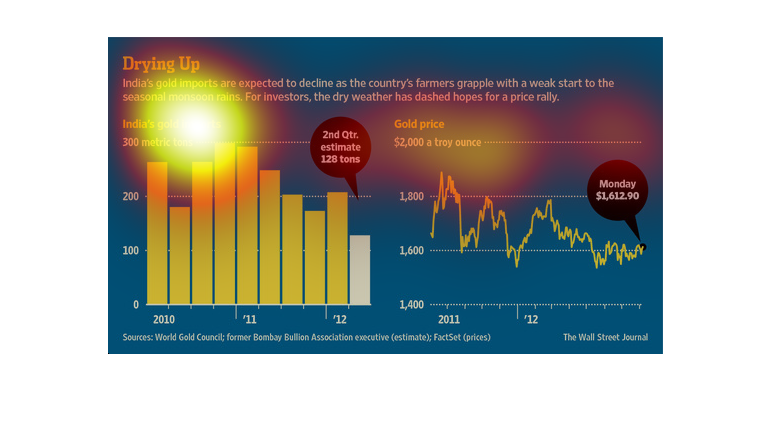
This graph is entitled "Drying Up."  This graph depicts India's expected gold import decline
due to heavy monsoon rains.  The chart shows India's gold imports and the corresponding gold
prices.  The chart shows progress from 2010-2012.  Information was obtained from The Wall
Street Journal.
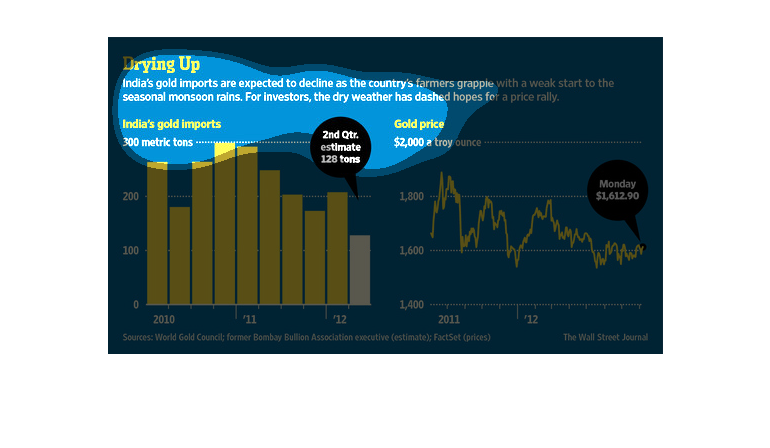
According to a study conducted by the Wall Street Journal- its sources coming from the World
Gold Council- India's gold imports are rapidly declining.
This chart shows that India's import of gold has declined along with the price of gold. The
graphic states that this is due to farmers struggling with seasonal monsoon rains.
It is talking about drying up in India due to mansoon rains. Indias gold imports are declining
due to the weather making farmers have a slow start. The bar graph shows the point of the
reason in decline
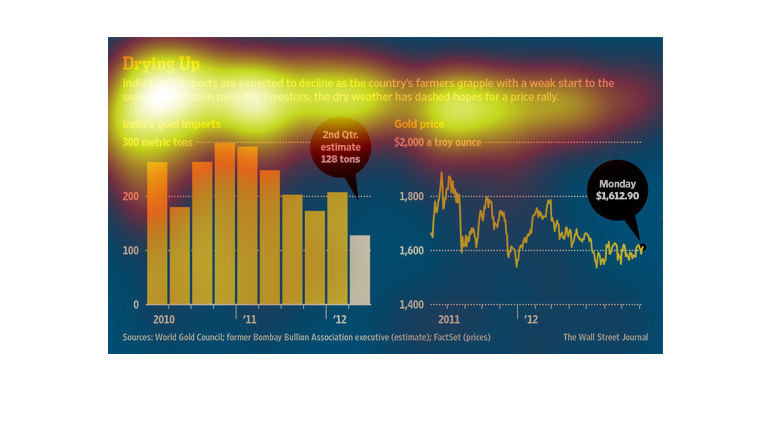
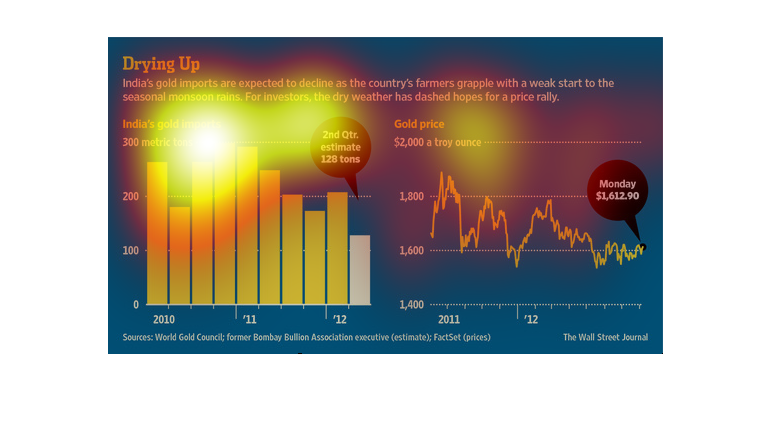
Drying Up. India's gold imports expected to decline as the country's farmers grapple with
a weak start to the seasonal monsoon rains, for investors, the dry weather has dashed hopes
for a price rally. Y axis in metric tonnes 300 max, Y axis is year 2010-2012. We see the amount
steadily dropping after a small peak in 2011
India's Gold exports are expected to decline, and the monsoon season has had an effect on
this.  In 2010 its exports where are 300 tons and a 2nd quarter estimate for this year is
only 128 tons. This is also effecting the price per ounce.
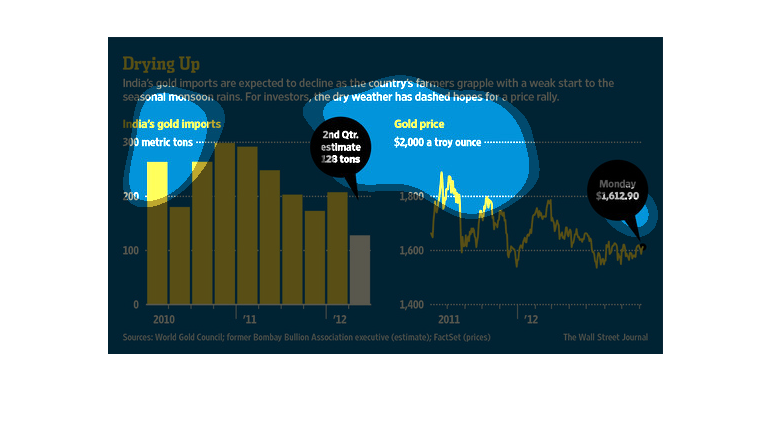
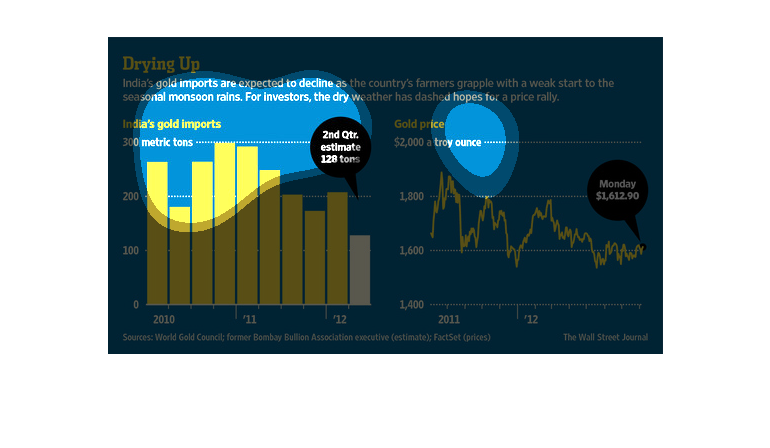
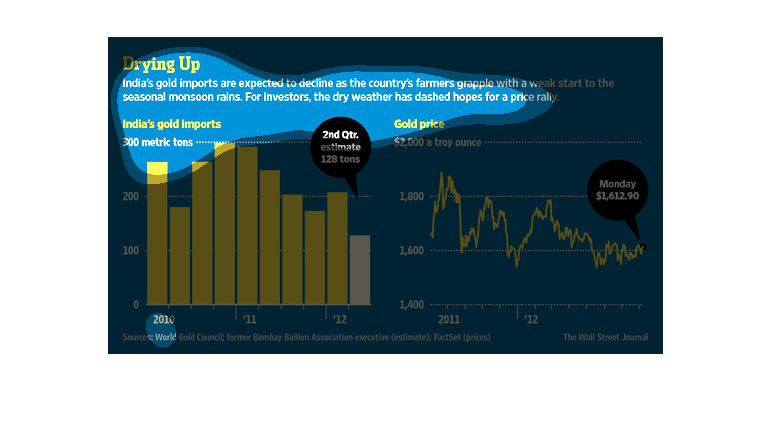
The image shows graphs that plot India's gold import measurements as well as the current and
projected price ranges for which the gold is expected to import. The charts show the comparison
of gold imports in relation to the rainy season in India.
This chart from the Wall Street Journal shows how imports of gold to india have started to
decrease, which may be due to import controls and other customs
This chart describes drying up. Specifically, India's gold imports are expected to decline
as the country's farmers grapple with a weak start to the seasonal monsoon.
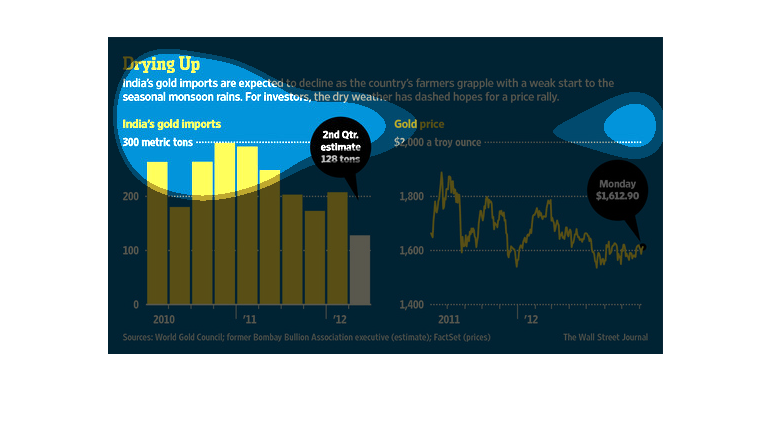
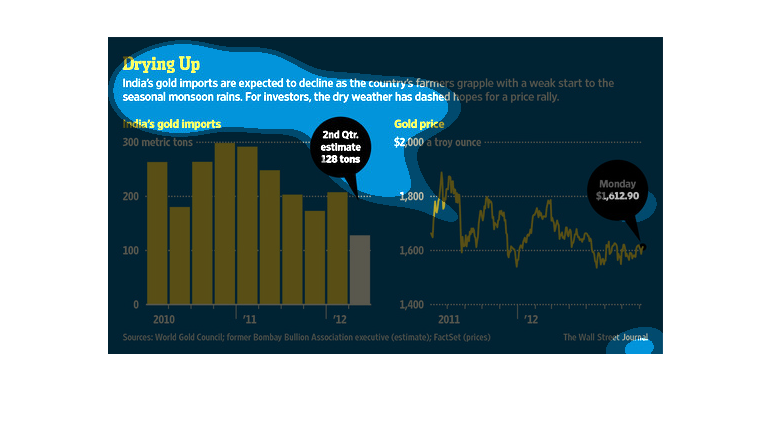
Drying Up India's gold imports expected to decline as the countries farmers grapples with
a weak start to the seasonal monsoon rains. For, investors the dry weather has dashed hopes
for a price rally.  India's gold imports 300 metric tons  2010 over 200 metric tons dropped
2011 300 metric tons dropping 2012 lowest tonage
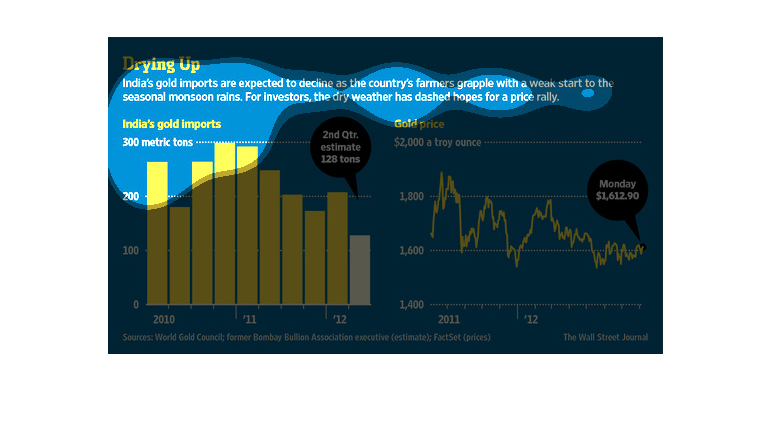
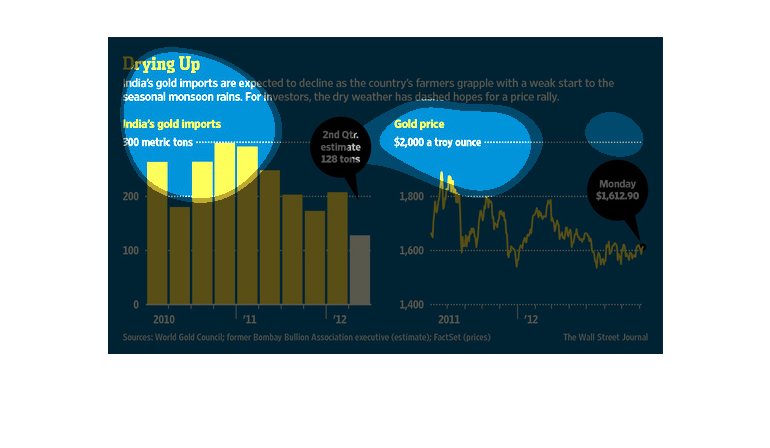
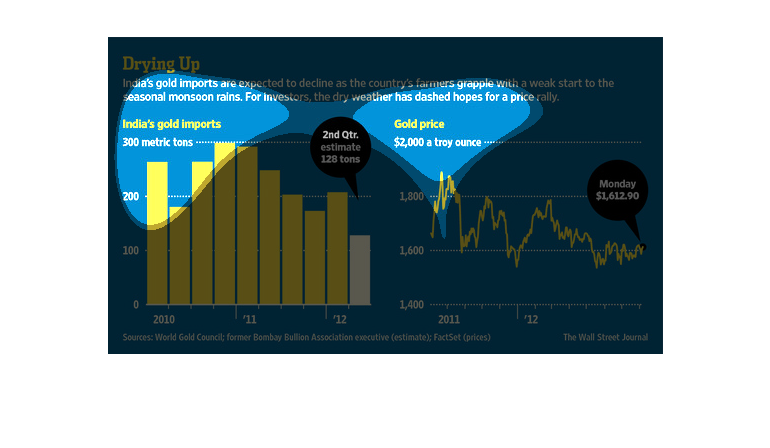
The image describes the expectation that India's gold imports will decline due to lack of
seasonal monsoon rains. The yellow chart on the left shows gold numbers year over year. The
chart on the left shows shows the price of gold year over year.