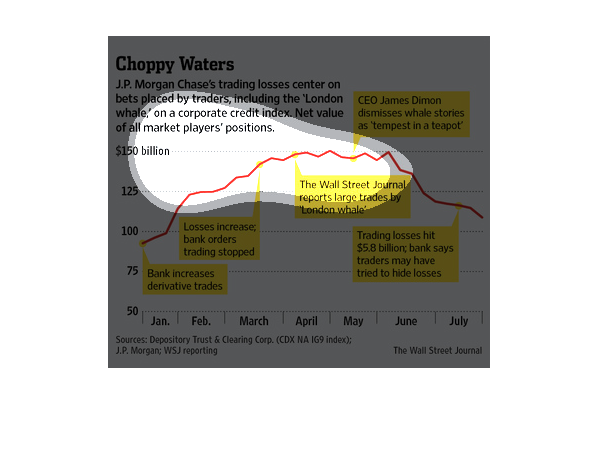
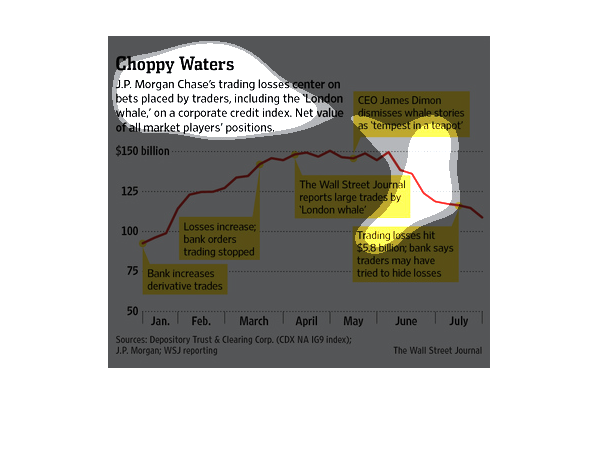
This infographic seems to be about the "London Whale," which seems to be a supposed insider
trading deal between banks. It is denied, but this infographic shows the relationship between
trading losses over time and also time stamps certain events that happened along the plotline.
You win some, you lose some; that is the way things go. In this study conducted by the Wall
Street Journal, from information obtained by the Depository Trust and Clearing Corp, J,P Morgan
has a big of a back luck run recently.
This chart from the Wall Street Journal shows how the trading income at JP Morgan have decreased
significantly in recent times due to the fixed income divisions
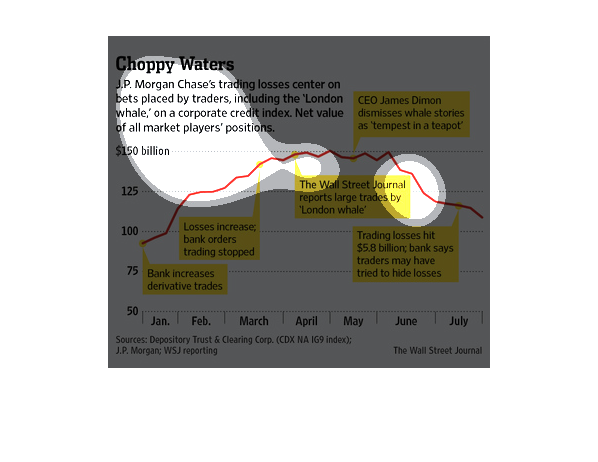
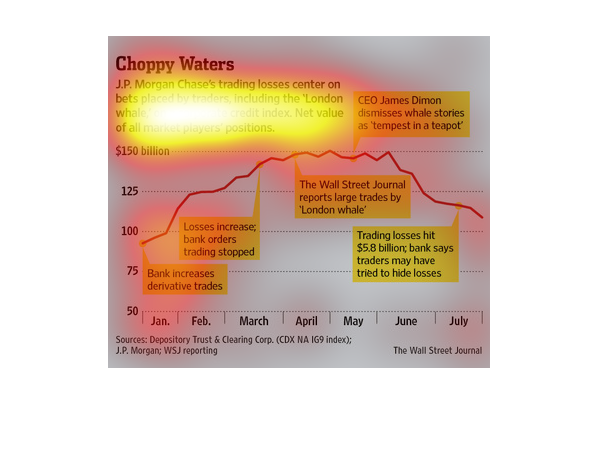
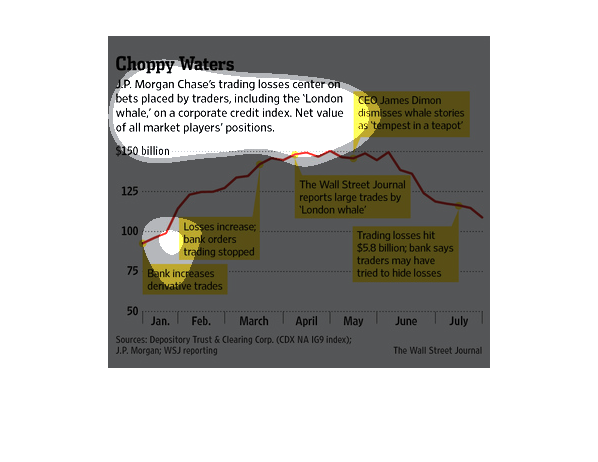
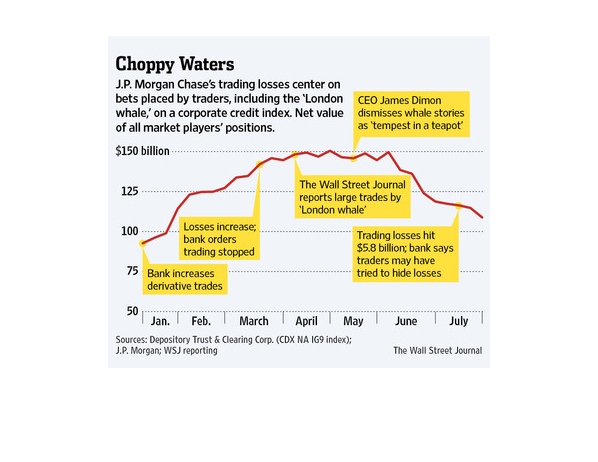
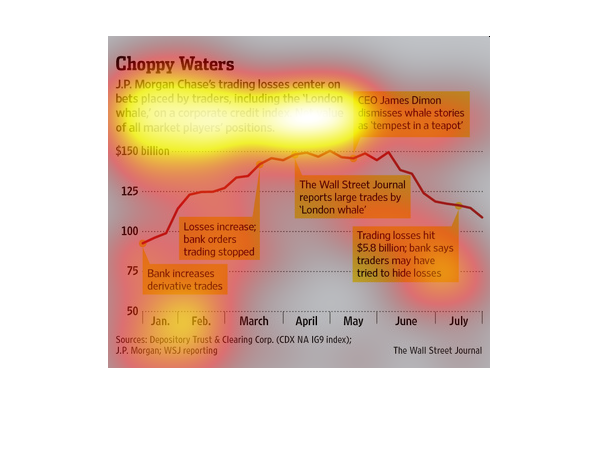
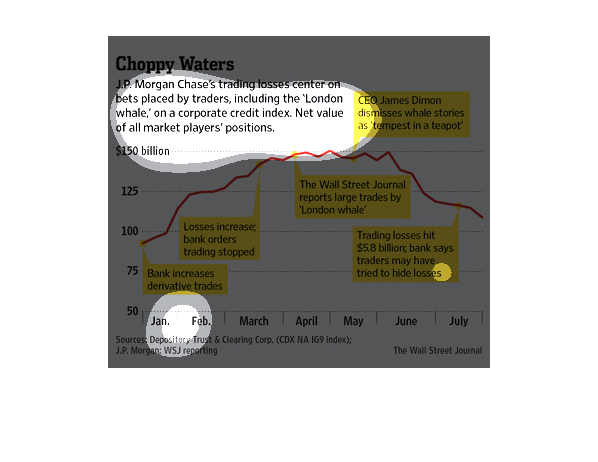
The image depicts J.P Morgan's trading losses center on the bets made by traders, specifically
pertaining to a massive loss in London referred to as the 'London Whale'.
This chart shows how JP Morgan Chases' trading losses center on bets placed in trading dollars
including the 'London whale' on a corporate credit index.
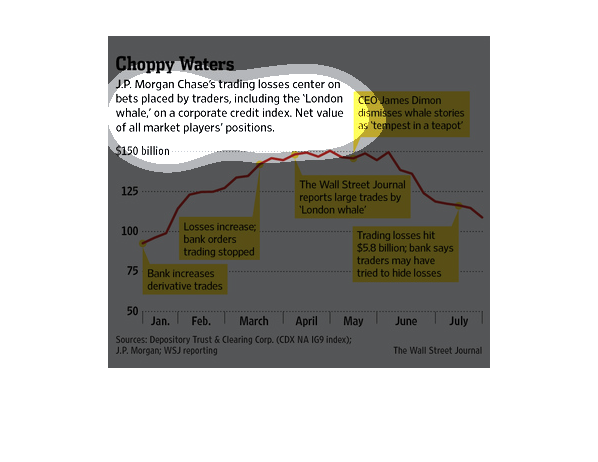
JPMC's trading losses center on bets placed by traders, including 'London whale' on a corporate
credit index.  Net value of all market players positions.
This chart describes choppy waters. Specifically, J.P. Morgan Chase's trading loses center
on bets placed by traders, including the London Whale, on a corporate credit index.
This chart details how India's trading losses centered around bets placed by traders including
what is referred to as the 'London Whale' on a  credit corporate index.
This chart from the Wall Street Journal shows how JP MOrgan's trading income over time has
dipped and how this is putting a strain on JP morgan's profits.
This chart shows the amount of losses and gains on stocks that are related to banks. It also
shows other events in the news and how that effected the outcome
Choppy Waters: J. P. Morgan Chase's trading losses center on bets placed by traders, including
the 'London whale,' on a corporate credit index.  Amounts indicate net value of all market
player's positions.  In January, the value is approx $80 Billion. By May, it is $150 Billion.
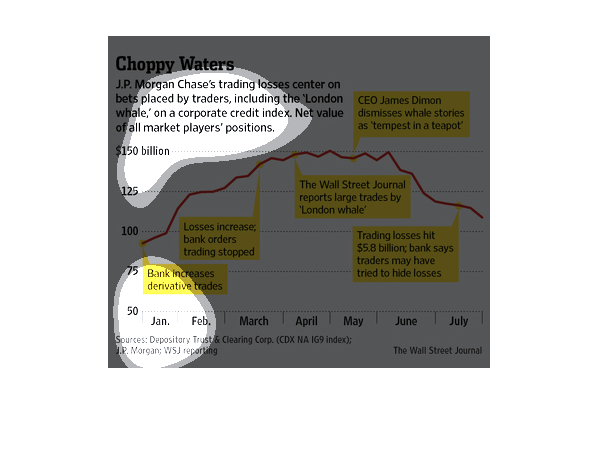
The following Chart Highlights the events around JP Morgan Chase Bank and the losses that
occurred over the London Whale mishap. It displays to the total index of all market players
positions.
Chase's trading loses center on bets placed by traders, including the "London Whale" on a
corporate credit index. The graph shows an increase in the debt loses and topping at 150 billion
in May when the CEO of Chase ignored the large trades by "London Whale". Chase then acknowledged
in June that it traders had hid their losses.
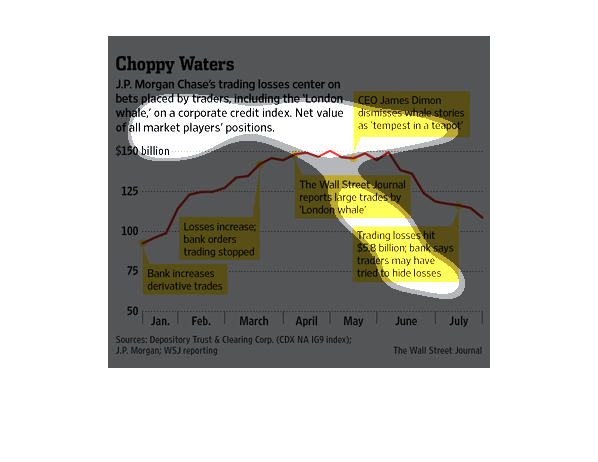
This chart shows the net value of all market players in a corporate credit index from January
to July. In January the value was below $100 billion, it rose to $150 billion in April and
dropped to  just above $100 billion in July.