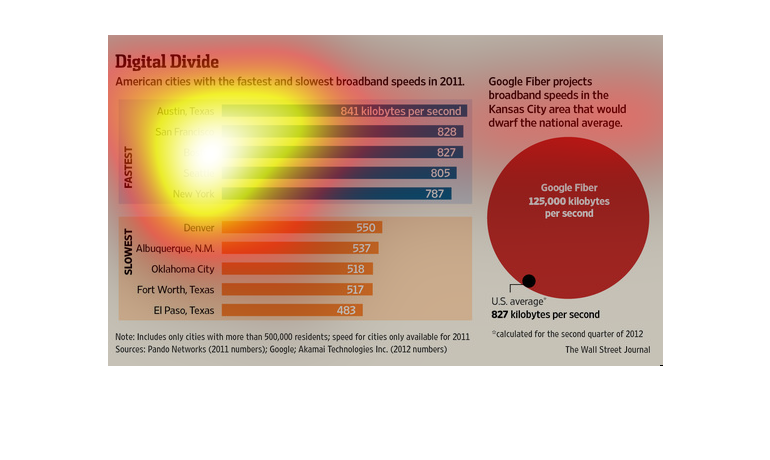
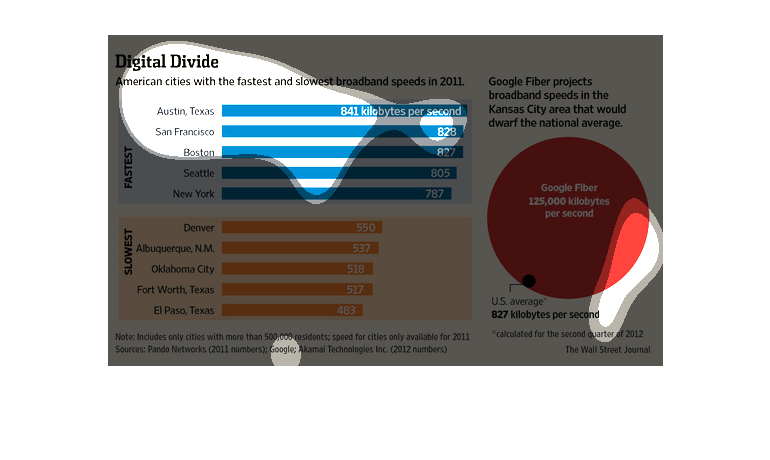
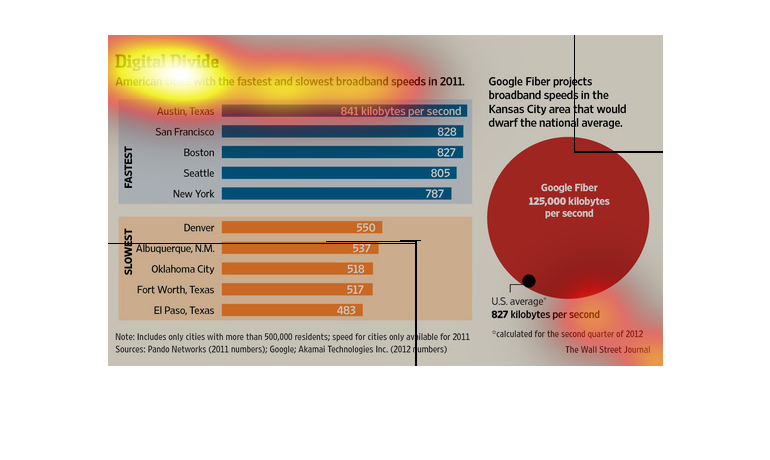
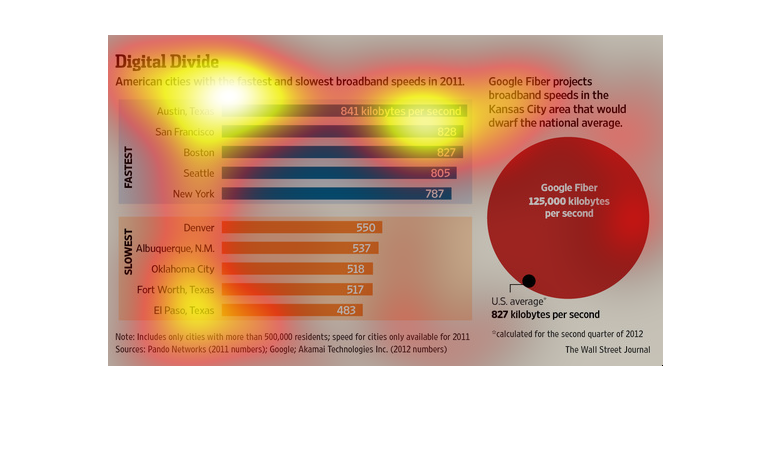
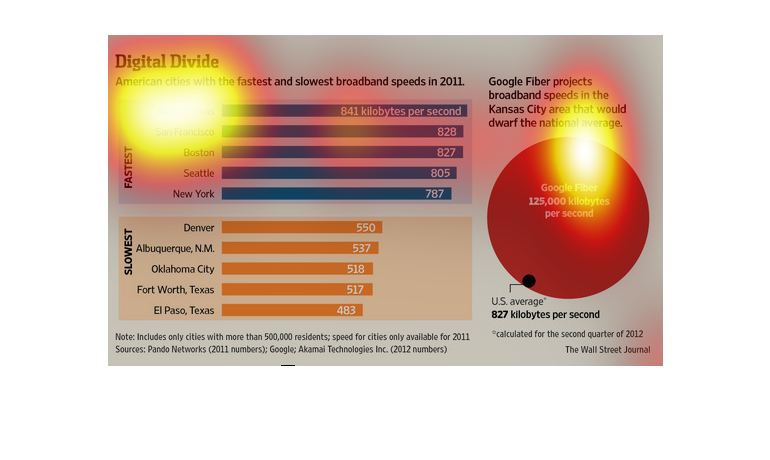
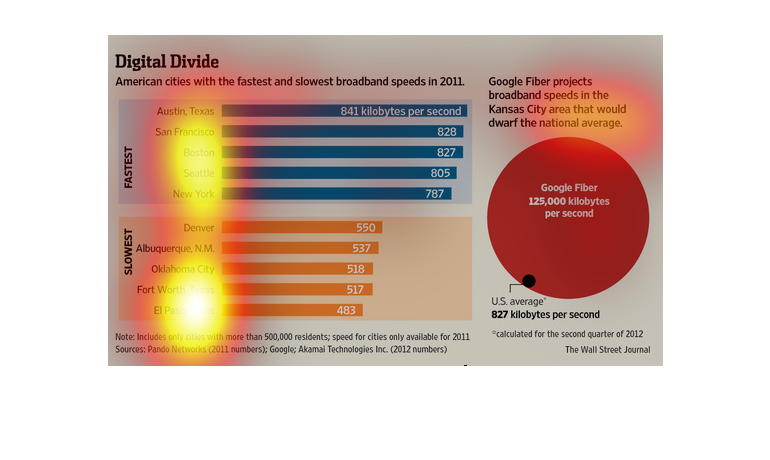
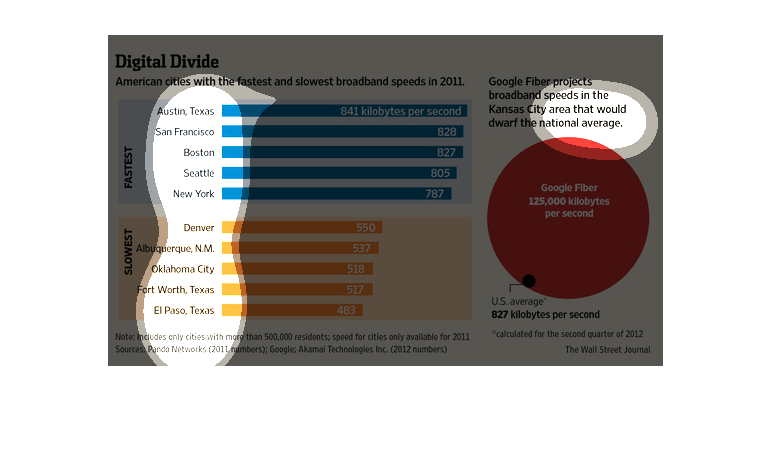
This chart details the American cities with the fastest and slowest broadband speeds in 2011.
 Austin is among the fastest and Albequerque is among the slowest.

The chart shows the Google Fiber projects broadband speeds in the Kansas City area that would
dwarf the national average. The google fiber 125,000 kilobytes per second. From slowest is
from the El Paso, Texas is the most slowest broadband speed. And the fastest is from the Austin,
Texas is the most fastest broadband usage.


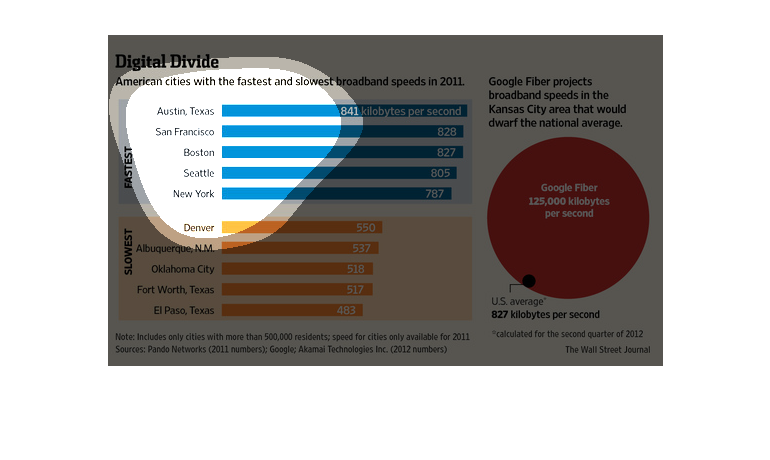
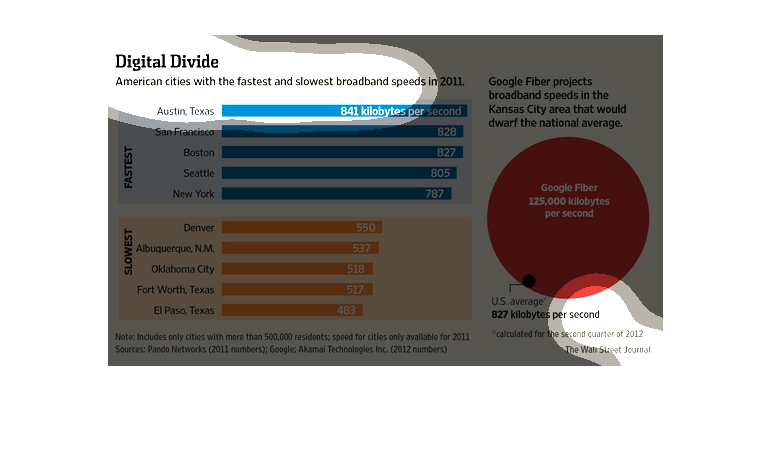
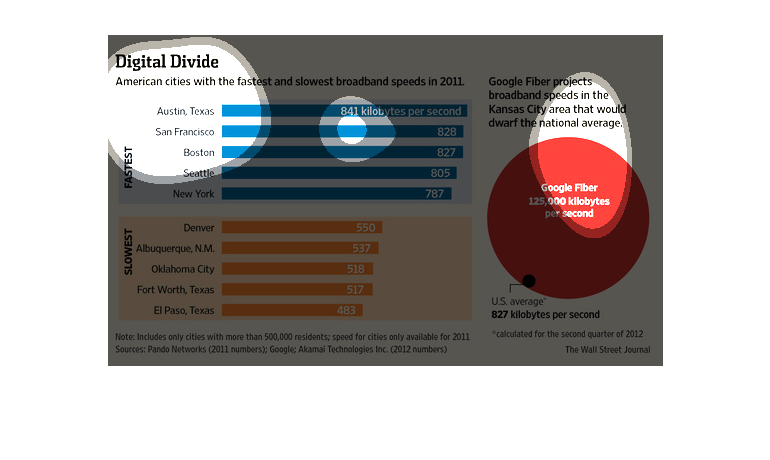
This image shows the fastest and slowest broadband connections of cities in the United States.
Austin, Texas has the quickest, while El Paso, Texas has the slowest.


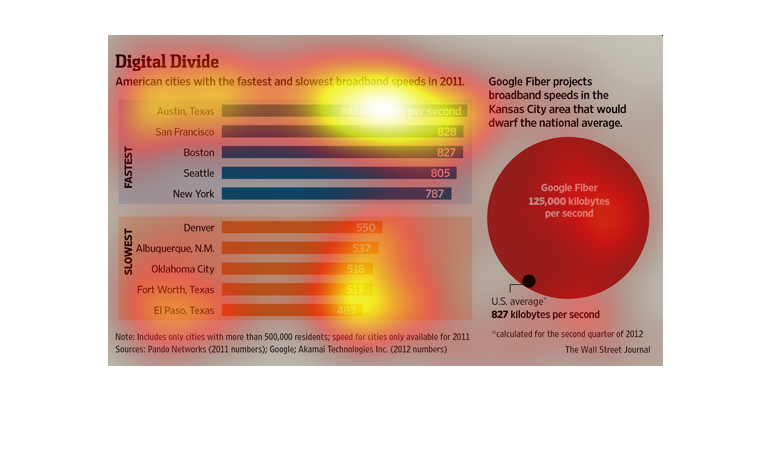
This image shows or depicts in bar graph and bubble statistical format data concerning the
digital divide. American cities that have the fastest and slowest broadband speeds in 2011.

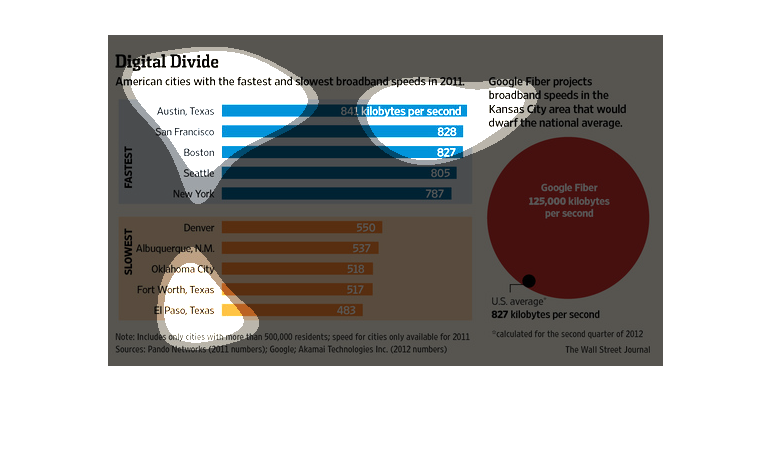
The graph shows the U.S. Cities with the fastest and slowest internet speeds in 2011. Austin,
Texas was the fastest with a speed of 841 kbps and El Paso, Texas is the slowest with a speed
of 483. According to the graph.
The internet has become a major concern for most people in the world; everyone wants to have
the fastest, cheapest internet available. In this study we see how each individual state is
faring in that department.

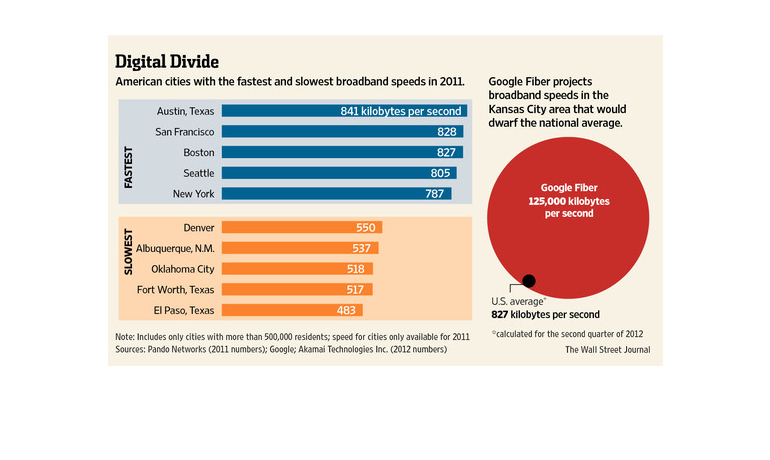
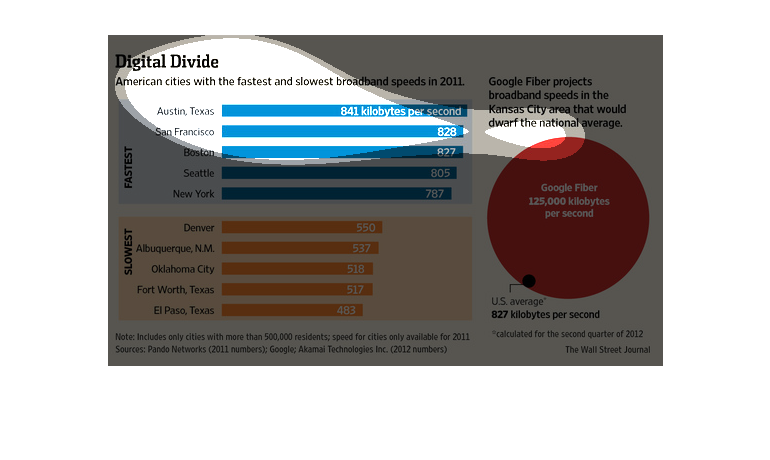
This chart from the Wall Street Journal shows how the digital divide is pronounced in the
United States relative to high speed broadband versus regular speed
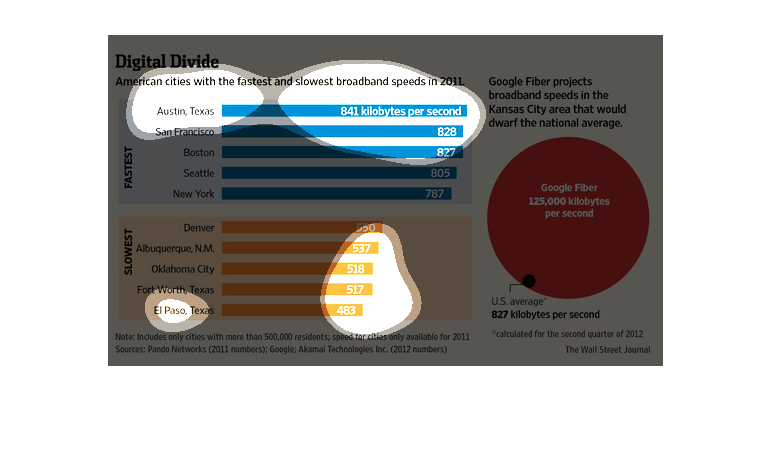
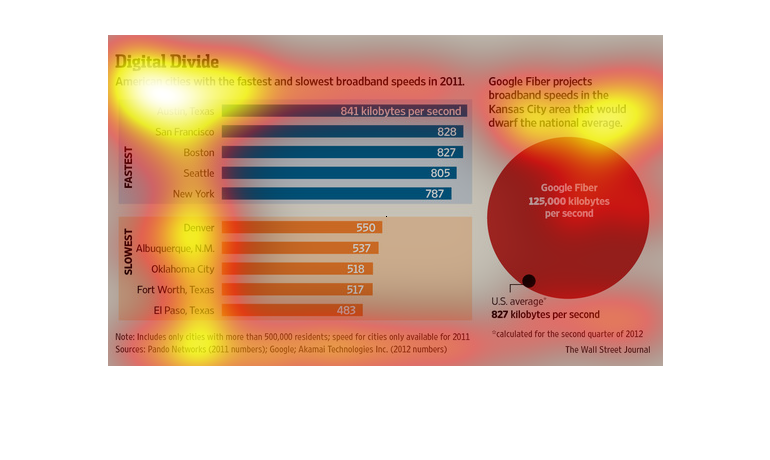
This graph is about the fastest and slowest broadband speed in 2011. The fastest broadband
took place in Austin, Texas, San Francisco, Boston, Seattle and New York. The slowest broadband
took place in Denver, Albuquerque, N,M., Oklahoma City, Fort Worth, Texas and El Paso, Texas.
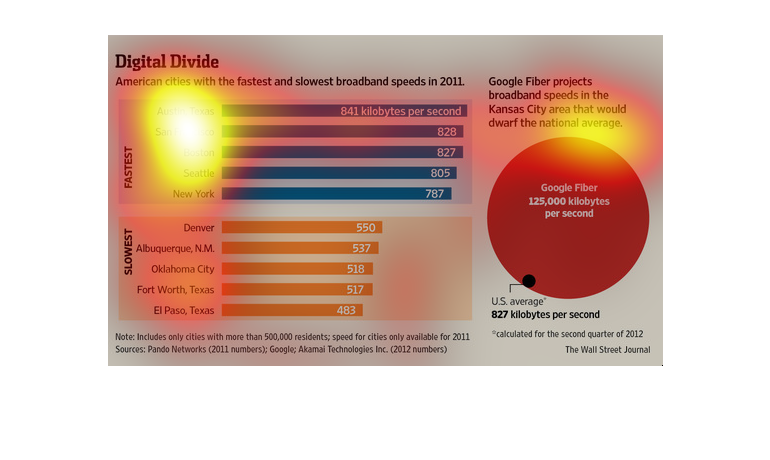
The graph shows which cities have the fastest and slowest broadband speed in America in 2011.
The fastest seems to be Austin, TX and the slowest is at El Paso, TX.
It is interesting.  It does give five cities for the fastest and slowest each.  It excludes
small cities which makes sense since they probably don't get much in broadband speeds.  Colorful
chart makes it more appealing.
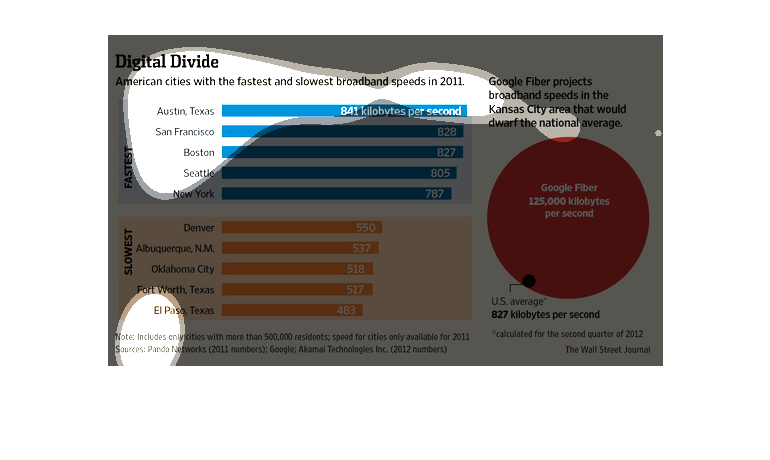
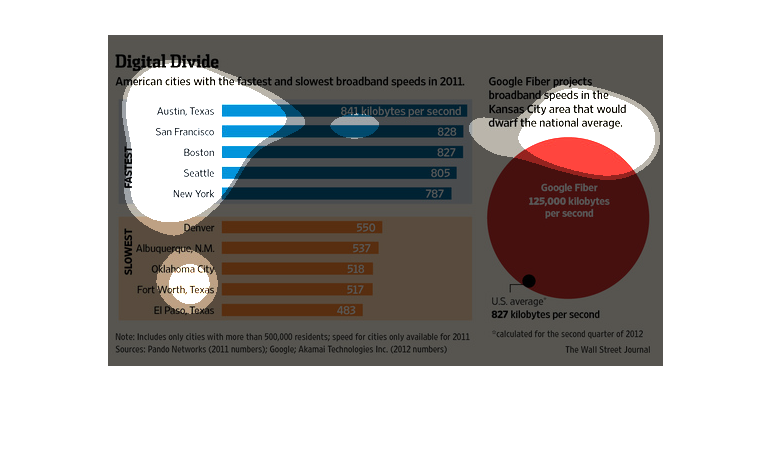
This chart from the Wall Street Journal shows how the country is split between those with
access to super high speed internet and those with access to only dial up
This chart describes the digital divide. Specifically, American cities with the fastest and
slowest broadband. Different categories are represented by different colors.

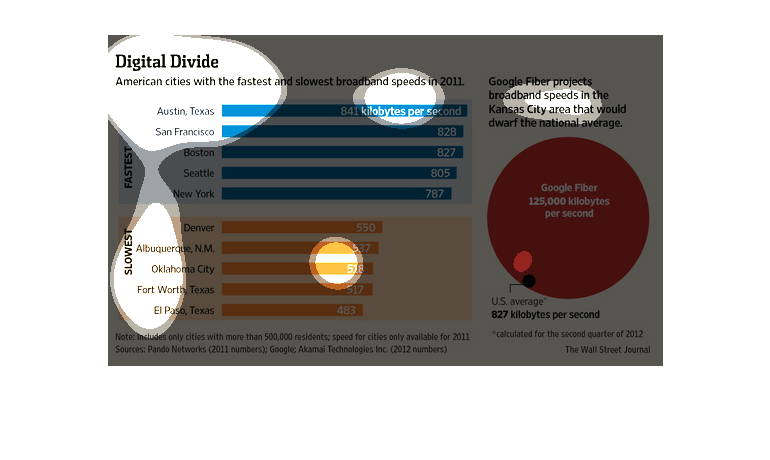
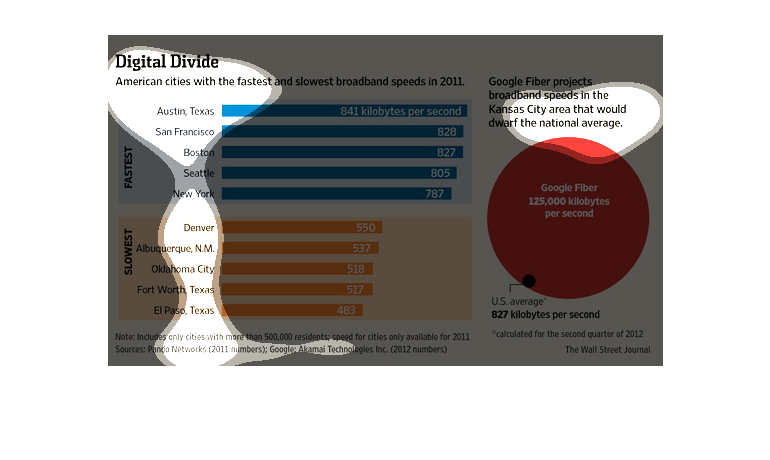
The graphs shows the American cities with the fastest and slowest broadband internet.  Austin,
Seattle, and San Francisco appear to be the fastest.  Denver, Oklahoma City and Fort Worth
appear to have the slowest.  The study appears to have been completed by Google Fiber projects.

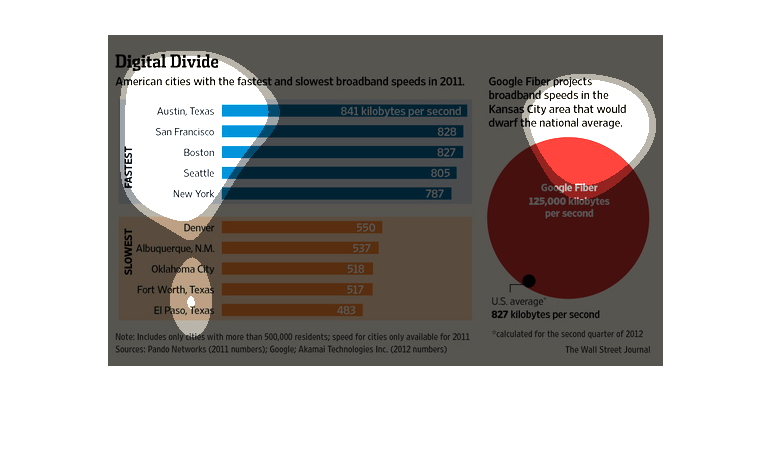
The image depicts American cities with fastest and slowest broadband speeds in 2011. Google
Fiber is touting the fastest speeds, able to crush the competition. Liberal states appear
to have the fastest broad band, with more right-wing states having somewhat slower speeds.
This chart describes digital divide. Specifically, American cities with the fastest and slowest
broadband speeds in 2011. Regions on the chart include Austin, Texas.