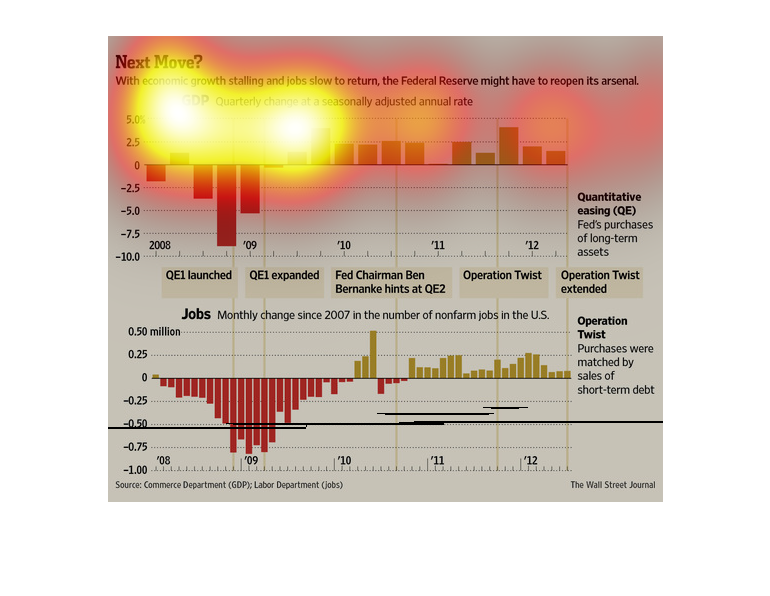
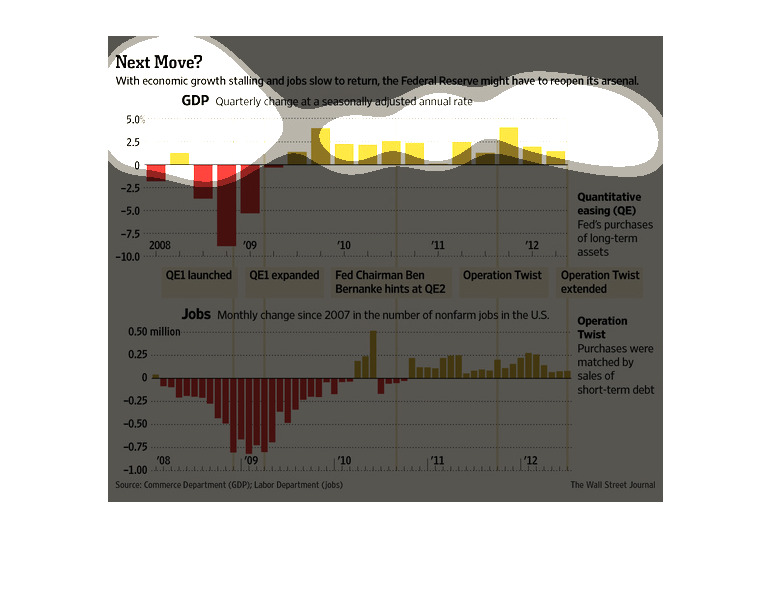
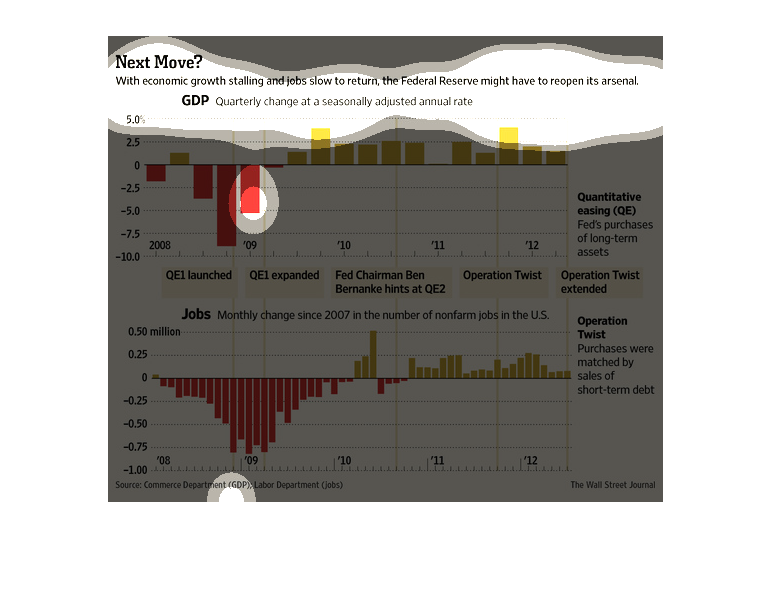
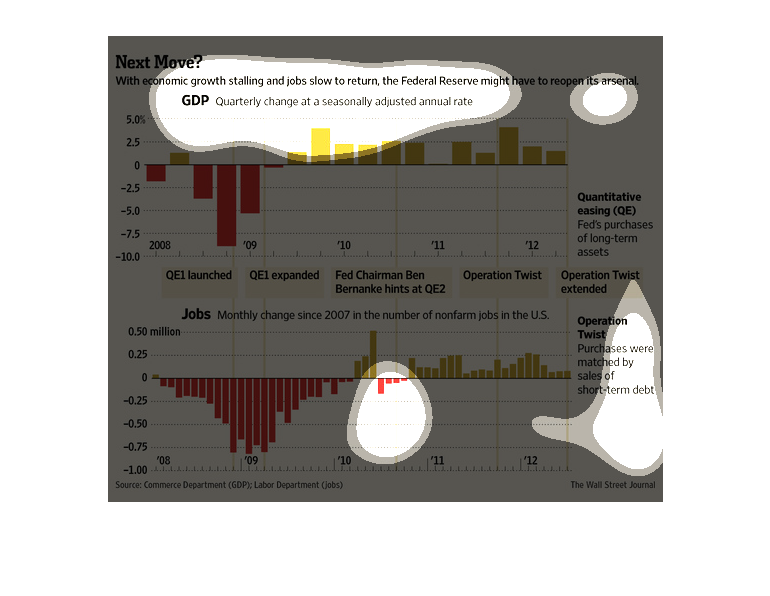
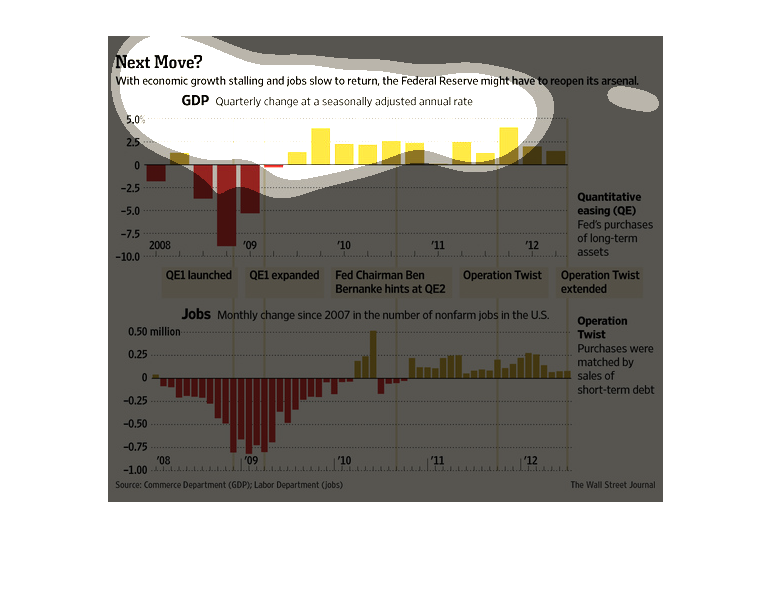
This chart depicts the growth (or loss) in both the U.S. GDP and the non-farm jobs.   The
intention of this chart is to examine the data as a potential predictor of Fed policy.
This chart details how the Federal Reserve may have to make some changes.  It illustrates
GDP at a seasonally adjusted annual rate and monthly change in jobs.
This chart describes next move. Specifically, with economic growth stalling and jobs slow
to return, the federal reserve might have to reopen its arsenal.
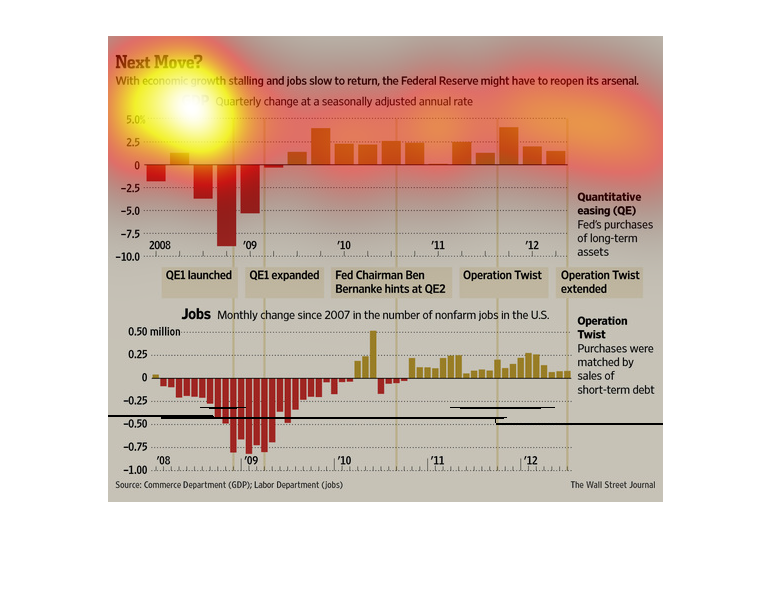
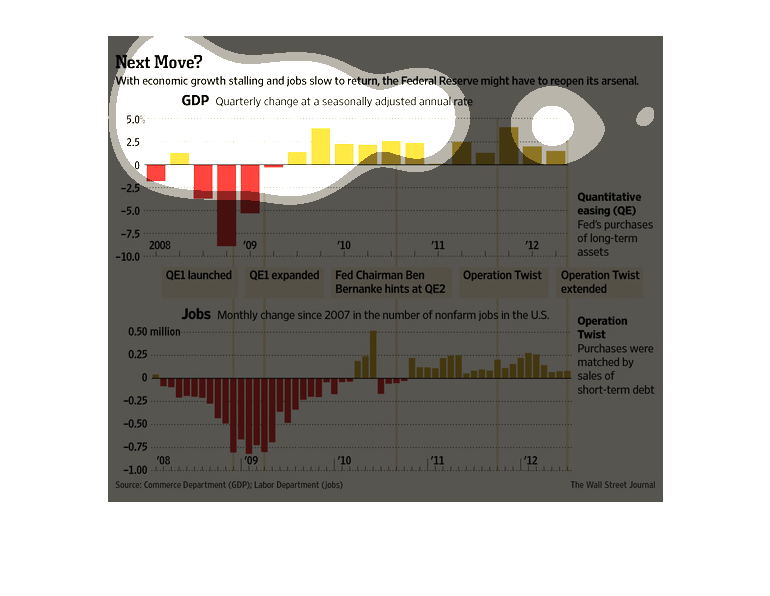
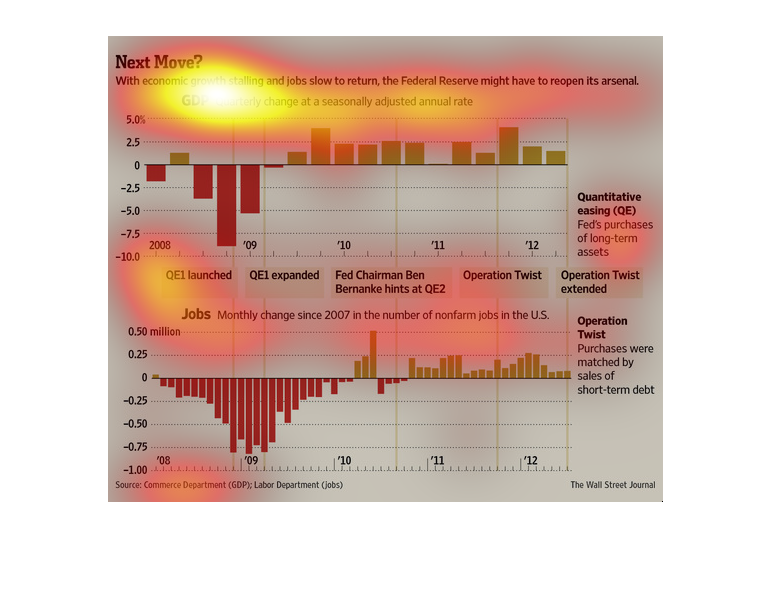
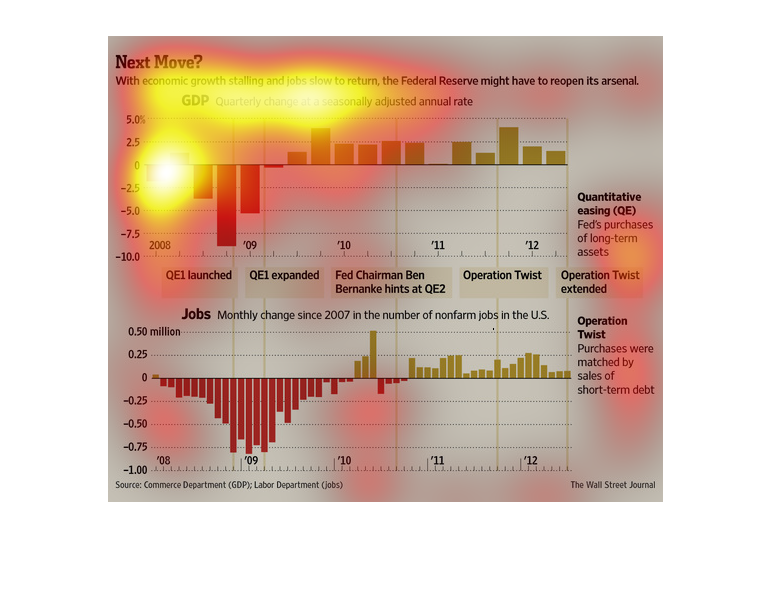
This chart from the Wall Street Journal shows how the economic growth in the United States
has slowed as of this chart and the Federal Reserve may need to expand bond purchases
This is a series of color coded bar graphs and related statistics depicting that with economic
growth stalling and jobs slow to return, the Federal Reserve might have to open it's arsenal.
In this 2008-2012 study conducted by the Wall Street Journal, we see that the are massive
effects because of the recession, one of them being the economy stalling. In order to combat
this the bank reserves is thinking about releasing a few more assets into circulation, hoping
to stimulate growth.
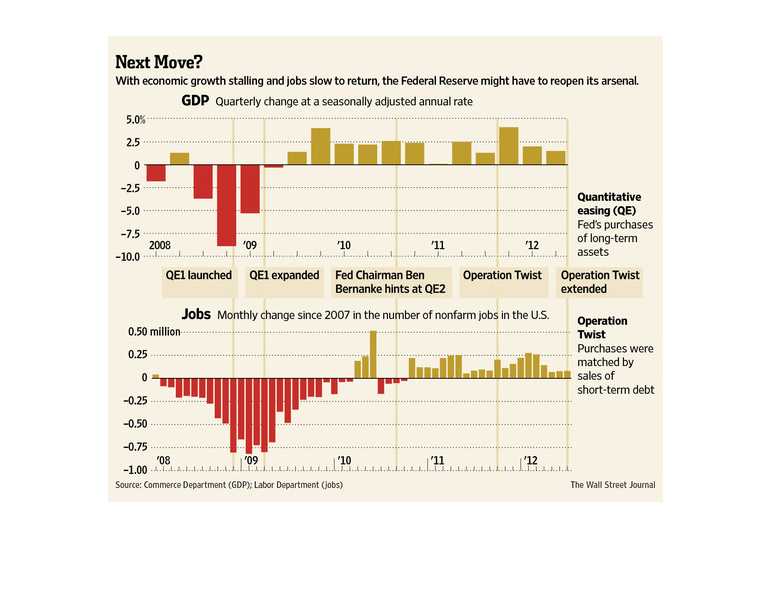
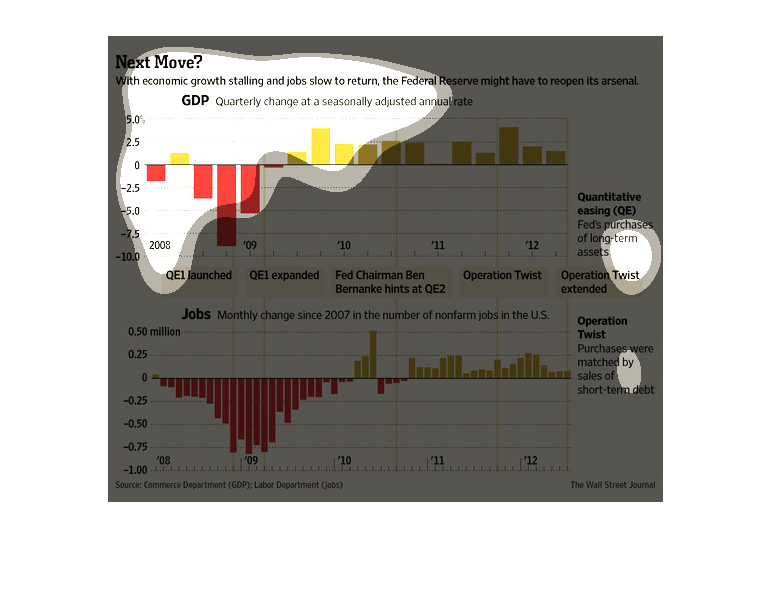
This chart shows a slowing of economic growth and the creation of new jobs in the United States.
The image also states that the Federal Reserve may need to take more actions to help the economy.
This chart from the Wall Street Journal shows how economic growth in the United States is
slowing down, resulting in policy decisions the Federal Reserve has to take
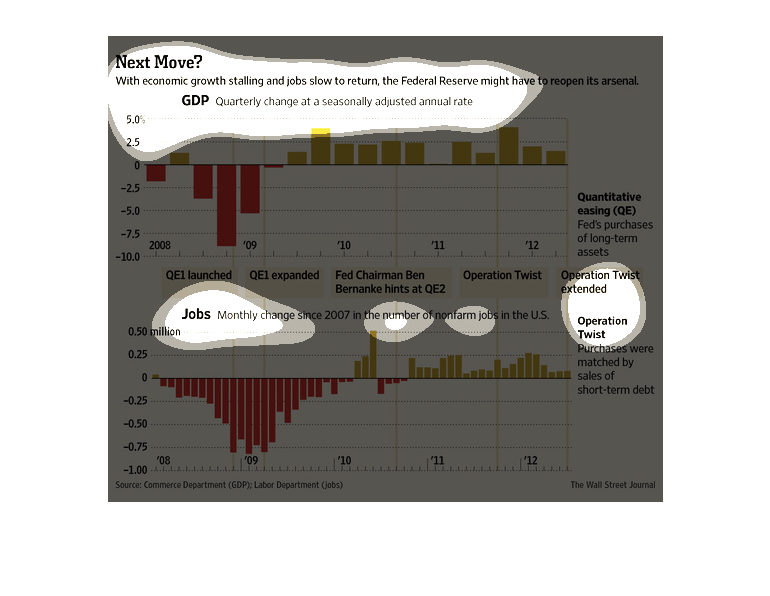
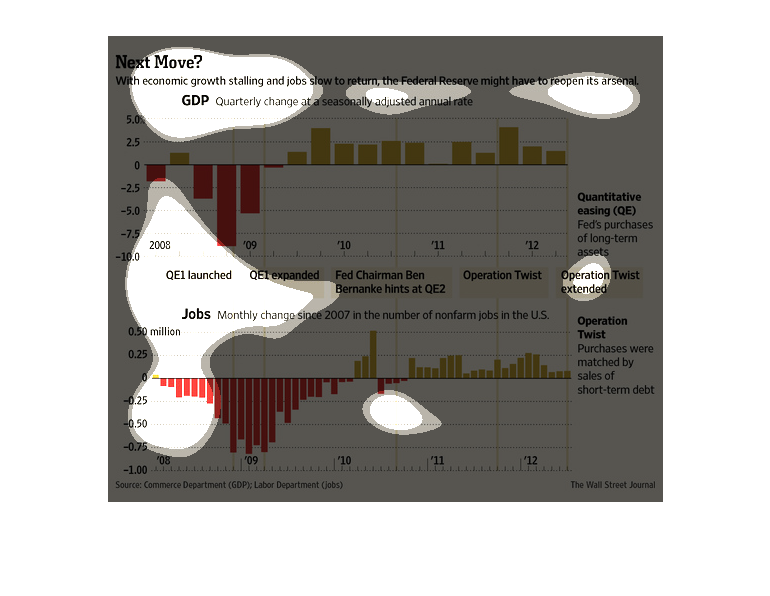
Economic growth and job availability are shown to be rising, but very slowly. Since 2007,
non-farm jobs have dropped, then wavered, then evened out to about 100,000. The Quarterly
GDP has followed a similar change, dropping as low as -8%, raising, then evening out at about
2%.
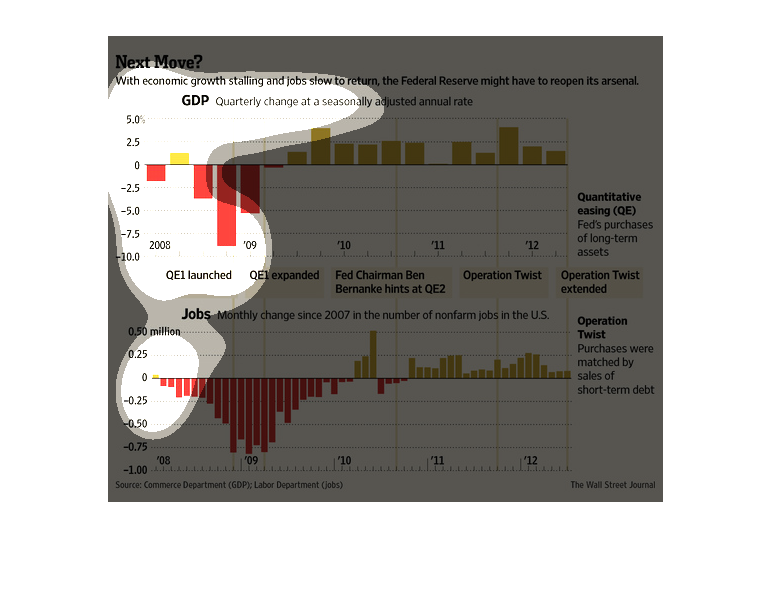
This graph is showing us that the economic growth is stalling and jobs slow to return, the
Federal Reserve might have to reopen its arsenal. The top graph is showing us the quarterly
change at a seasonal adjusted annual rate. As the bottom graph is showing us monthly change
since 2007 in the number of nonfarm jobs in the U.S.
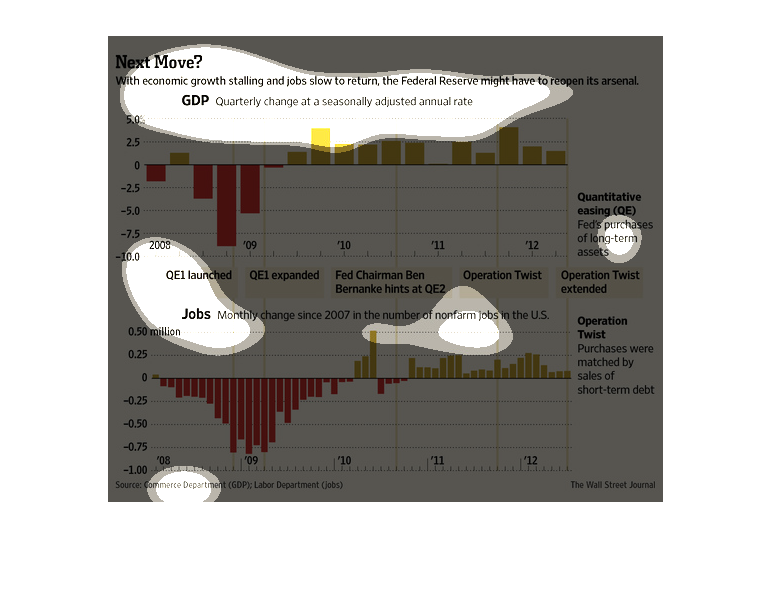
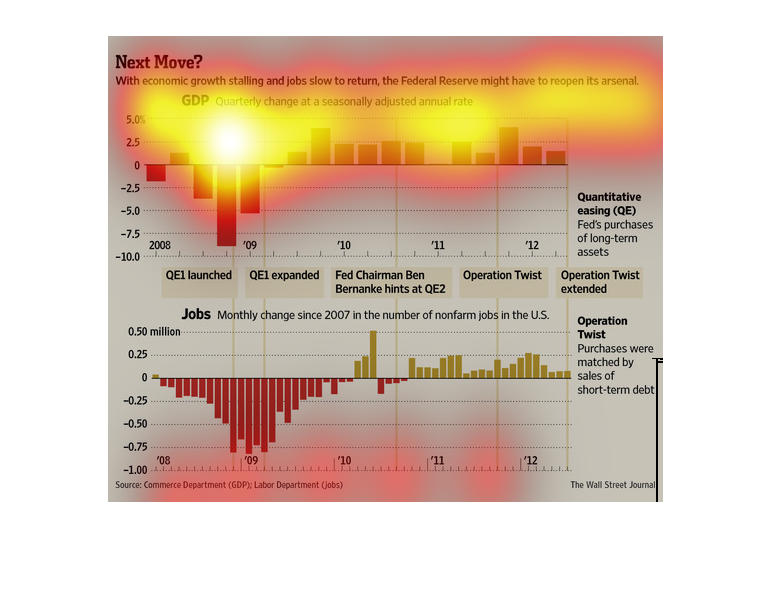
This image shows or depicts in statistical bar graph format information concerning the next
move or economic strategy dealing with the sluggish US economy and how the Federal Reserve
should be used to help it.
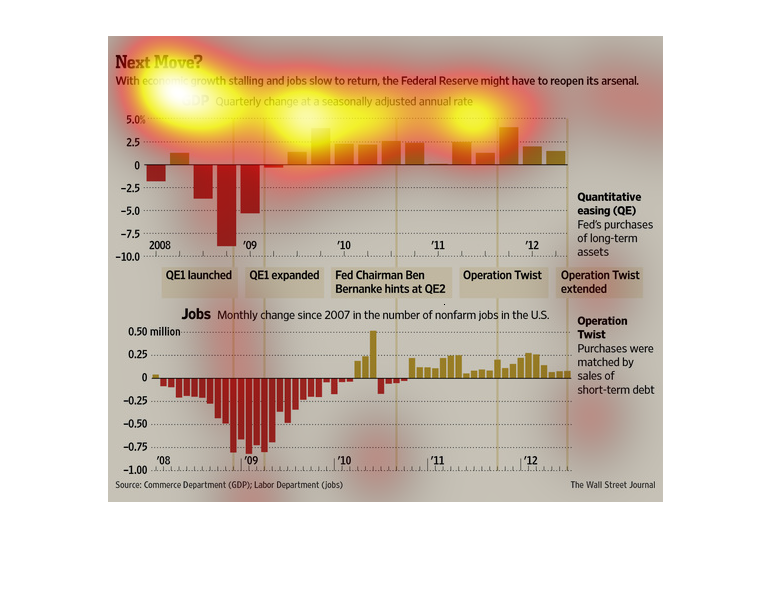
The graph shows the economic growth in the United States based on purchases made.  It appears
in 2010 that there was more of an economic growth in the country.
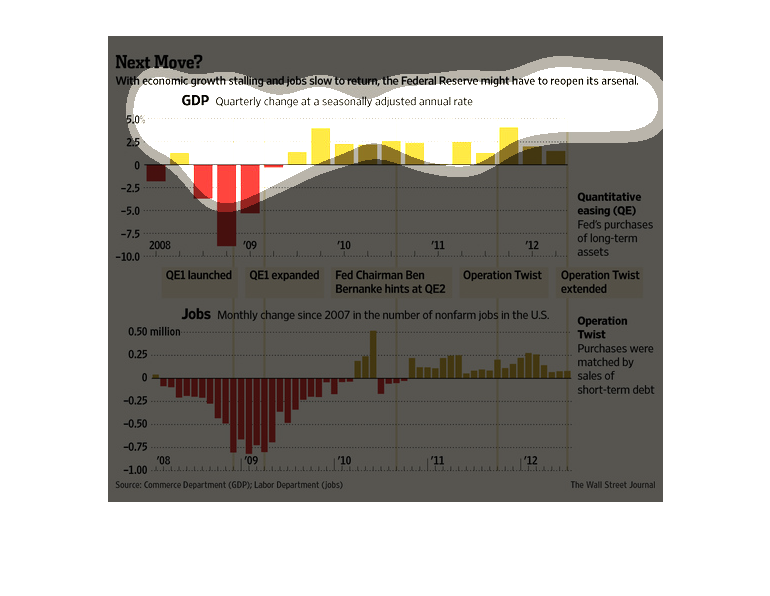
The following chart shows the overall Gross Domestic Product in the USA from 2008 to 2012
shows an improving job hiring course during those years but a downtrend in the last quarter
shown and suggest the FED made need to open up its arsenal again.
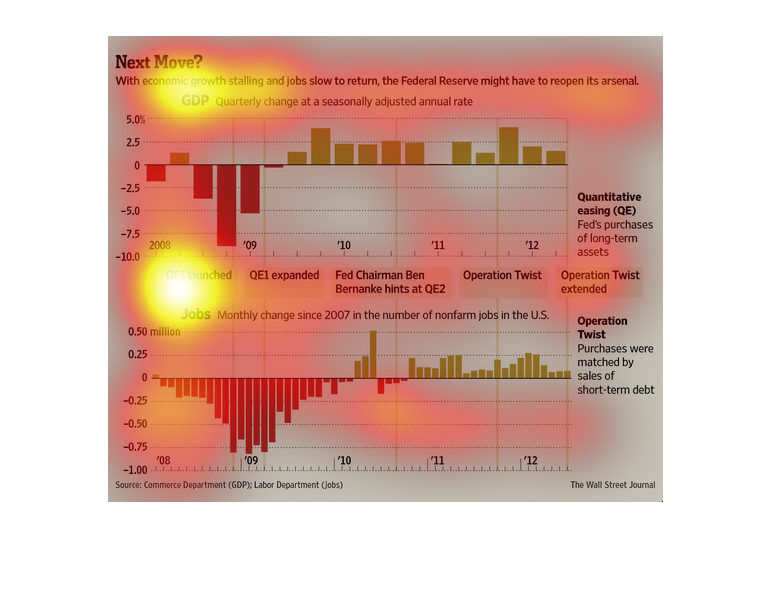
The title of the graph is next move. It says with economic growth stalling and jobs slow to
return, the federal reserve may have to reopen its arsenal.