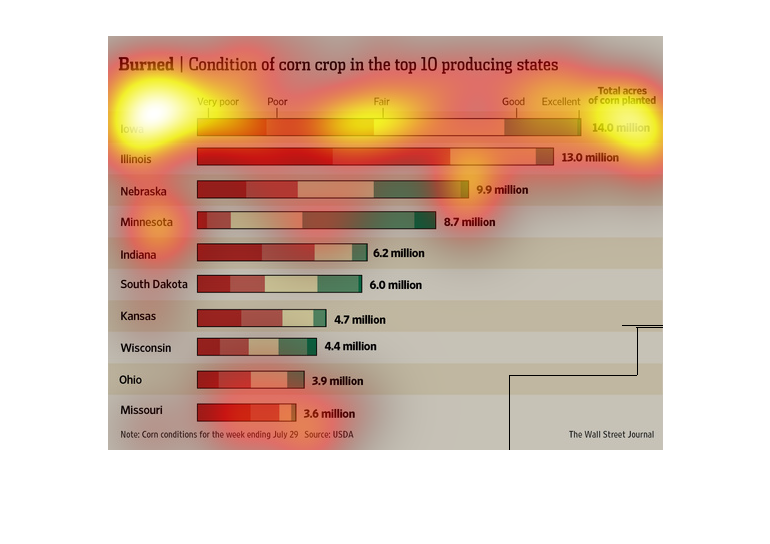
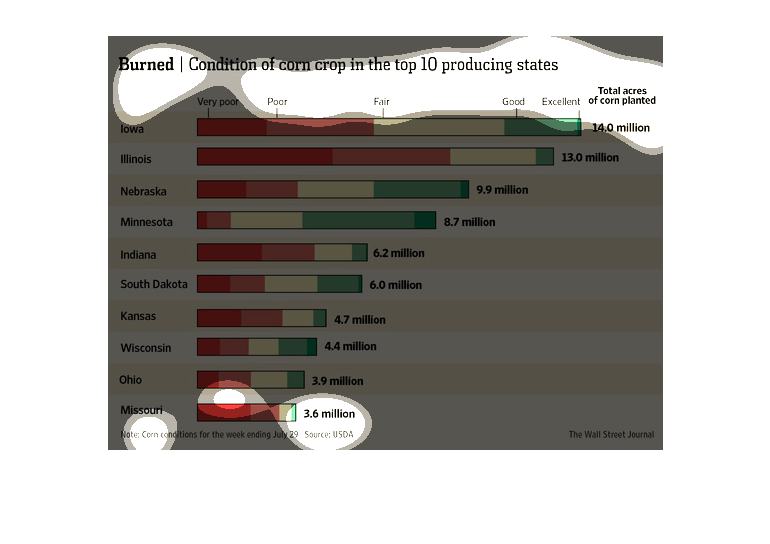
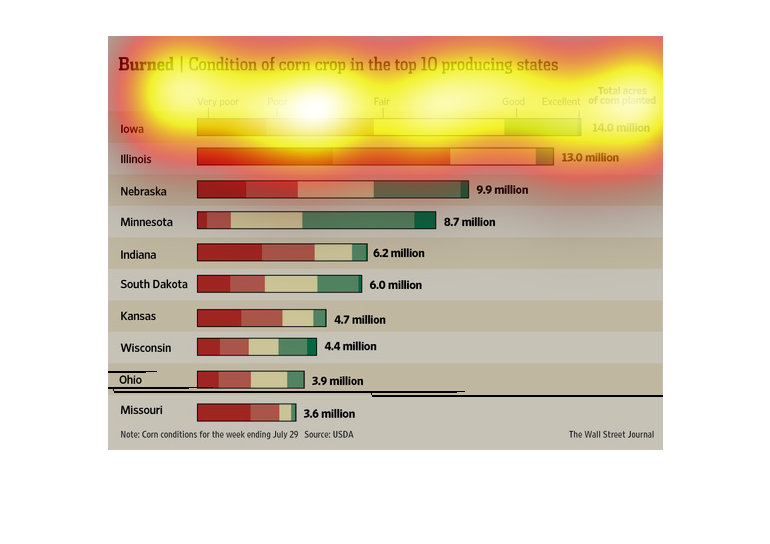
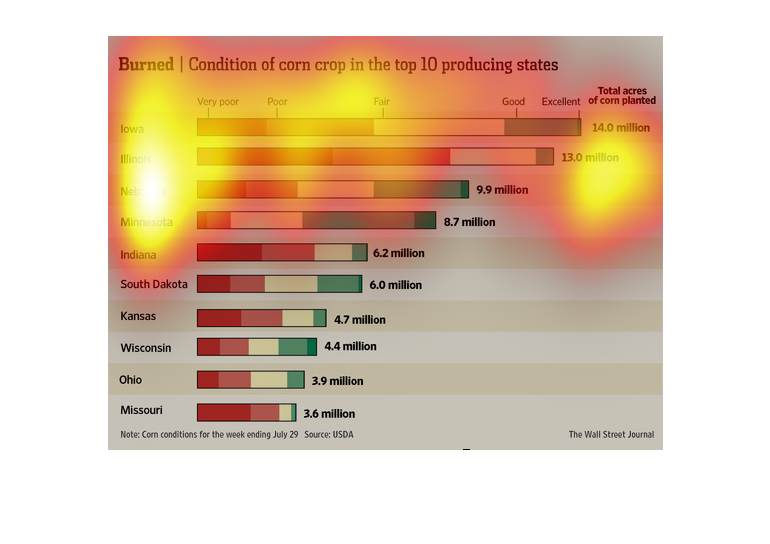
This chart from the Wall Street Journal shows how the corn crop in the top ten producing states
are more burned because of drought and high heat waves
This is a chart showing the quality of corn in the top producing states of corn in the United
states.  It has different colors to represent the different quality of corn.  Also shows the
total acres of corn planted for each state.
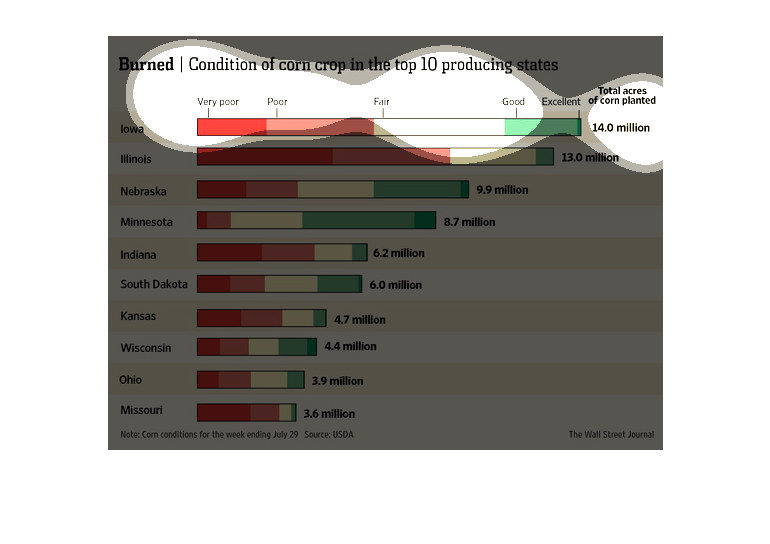
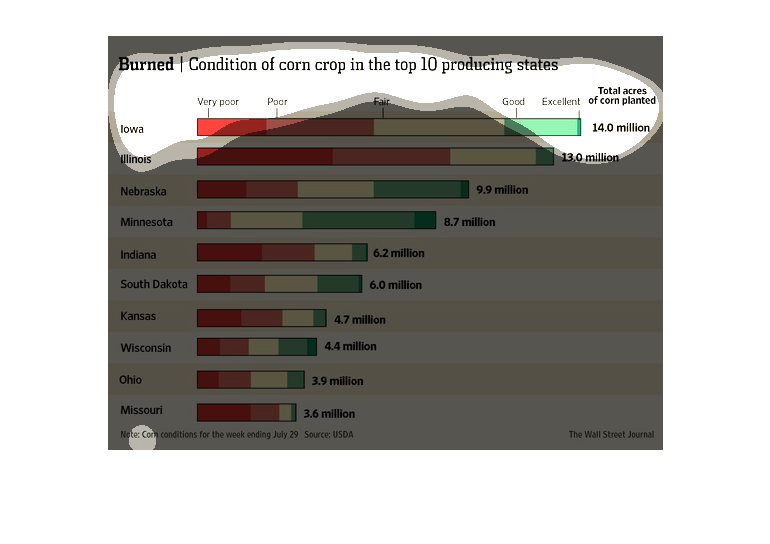
This is a series of color coded bar graphs and related statistics depicting the condition
of the corn crop in the top ten producing states. Iowa is shown to be ranked first.
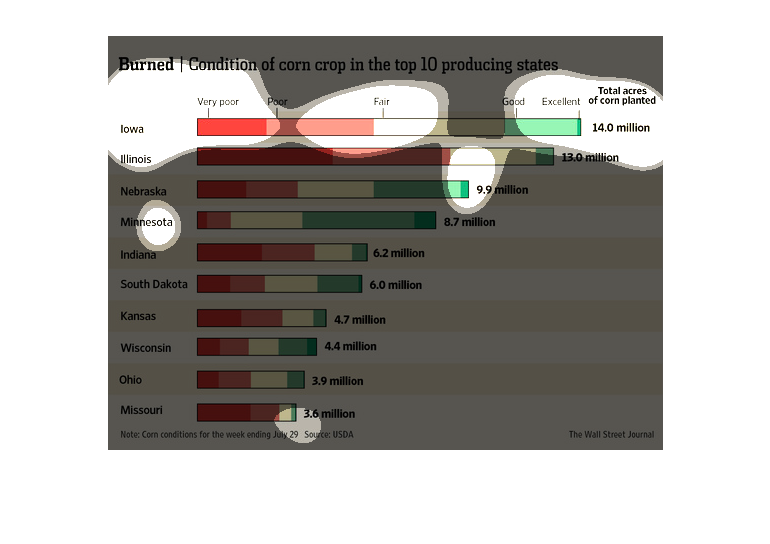
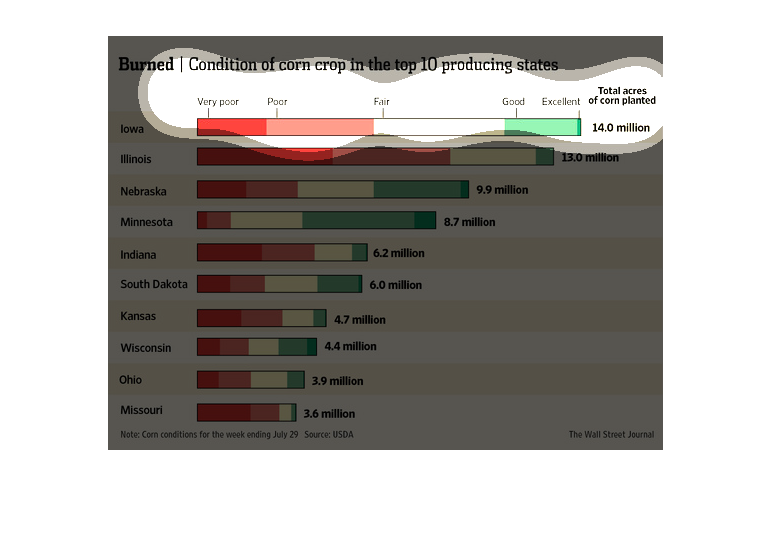
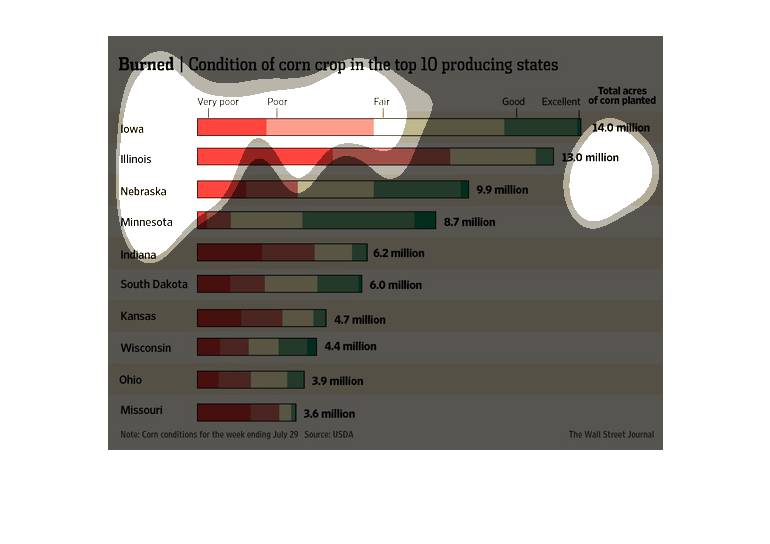
This chart from the Wall Street Journal shows how the corn crop in the top 10 producing states
in the US are faring due to the ongoing drought, which is not good

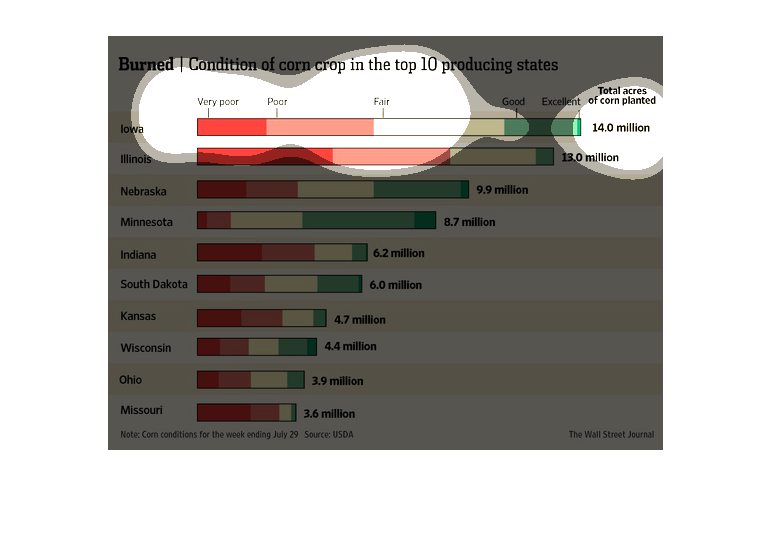
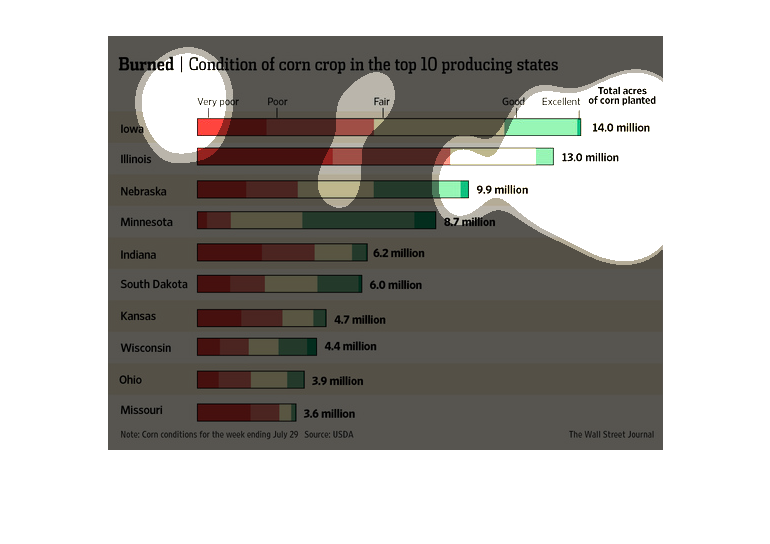
This chart shows the condition of corn crops in the states of the U.S. that produce the most
corn. Iowa's crops are the best of these states, and Missouri's crops are doing the worst.
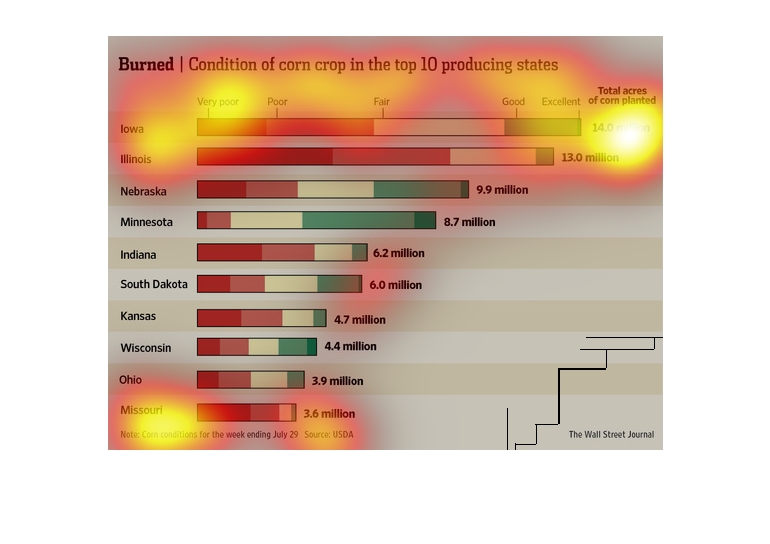
This chart describes Burned. Specifically, condition of corn crop in the top ten producing
states, Locations on the chart include Illinois, Nebraska, and Indiana.
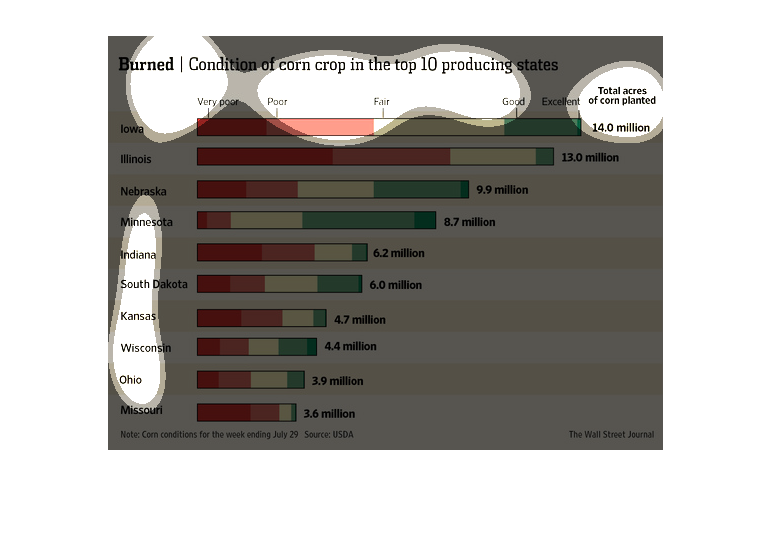
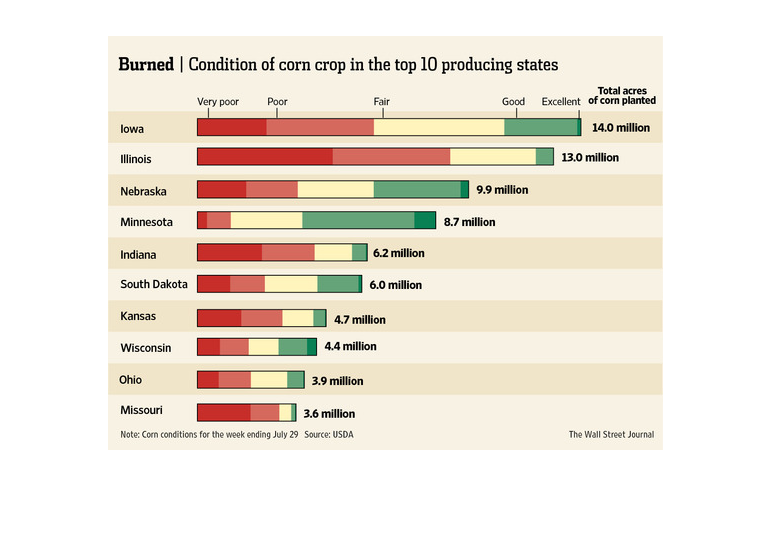
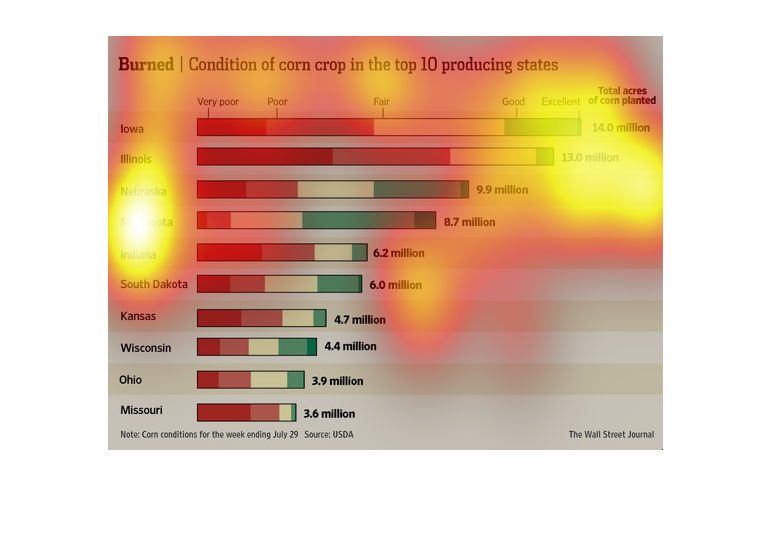
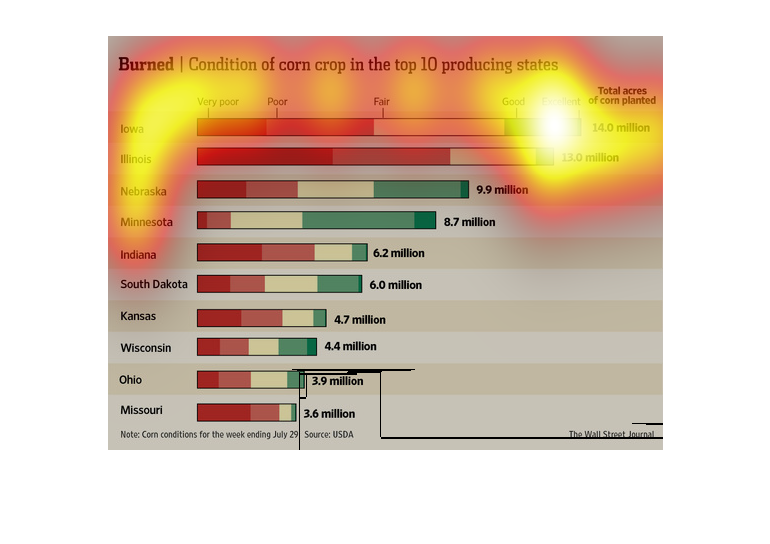
A graph chart of the condition of corn crops in the top 10 producing states.  It lists Iowa
in the top spot with 14.0 million acres of excellent corn planted.  And Missouri in the bottom
spot with 3.6 million, most of which was poor condition planted corn.
This image is illustrating the condition of the corn crop in the top ten corn producing states.
 The graph is depicting how temperature has effected the corn
The title of the graph is burned: the condition of corn crop in the ten top producing states.
Iowa produces the most corn crop at 14.0 million per year.
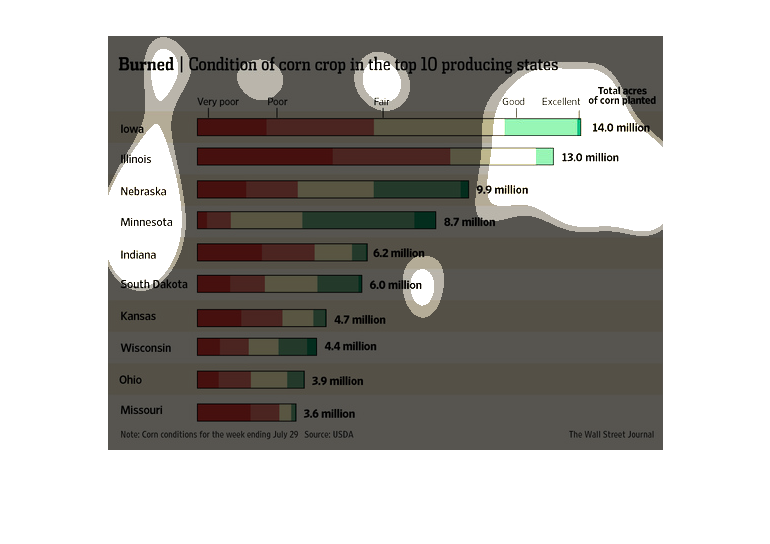
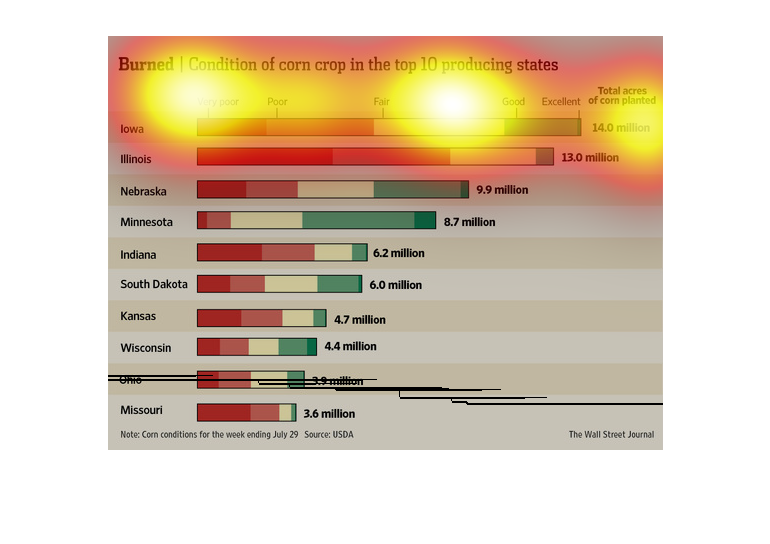
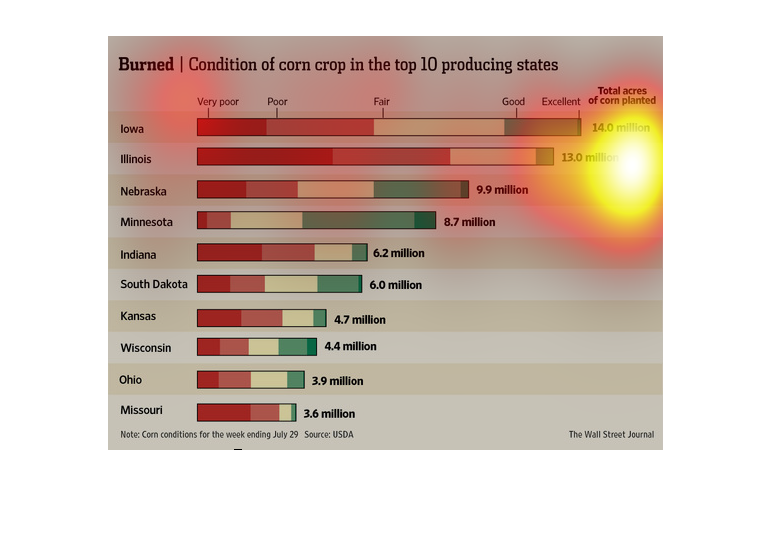
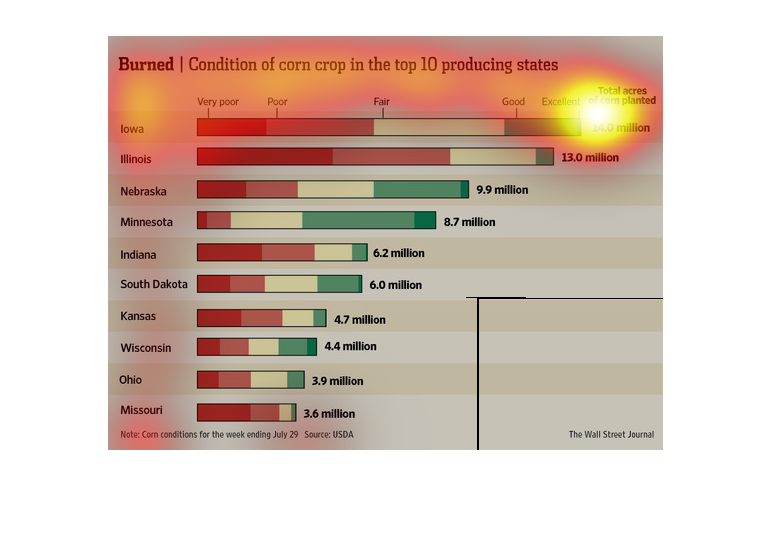
Burned. condition of corn crop in the top 10 producing states On the Y axis we see the states,
on the X axis we see corn produced and the bards are split into amounts of quality of corn.
This bar chart illustrates the conditions of corn crops in the ten most producing states in
the US.  It shows total acres of corn planted an dhow many are burned, good, or excellent.
 Iowa and Illinois are doing the best.
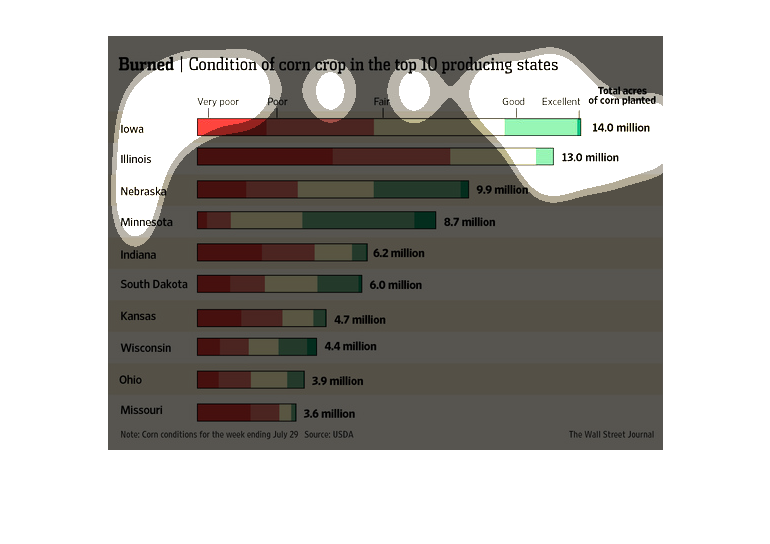
This image is a graph showing the condition of corn impact on its top 10 producing states.
The graph has the  top states and how much corn they produce in acres.
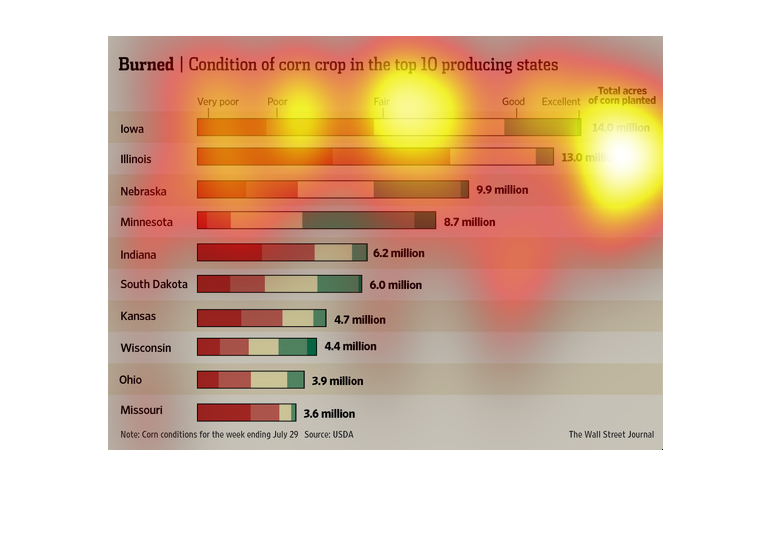
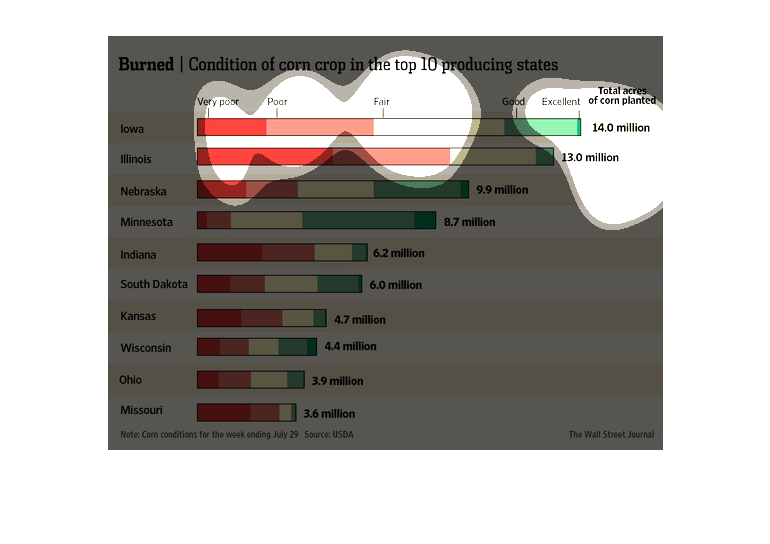
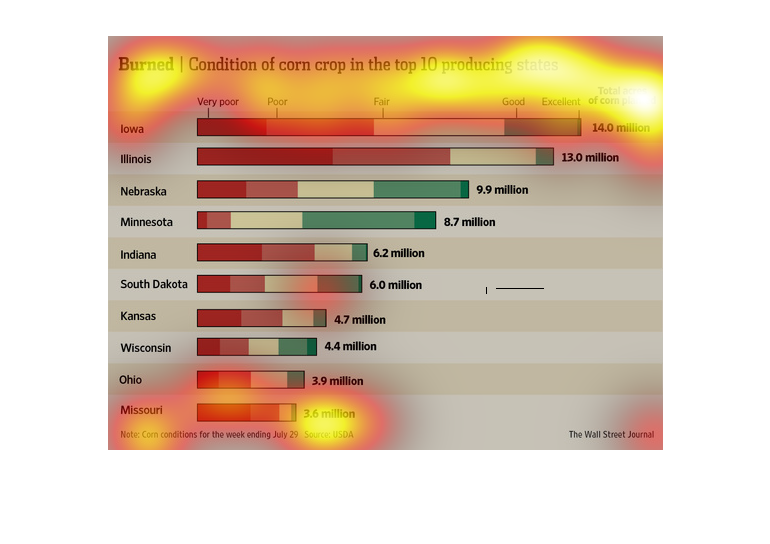
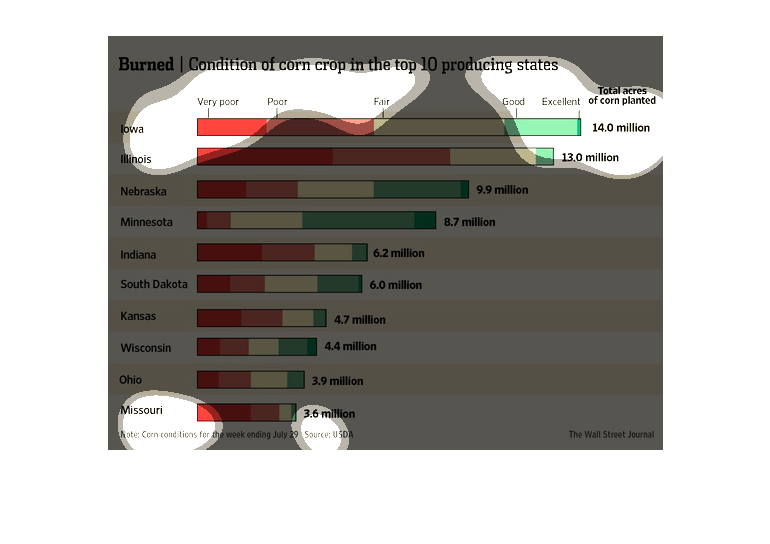
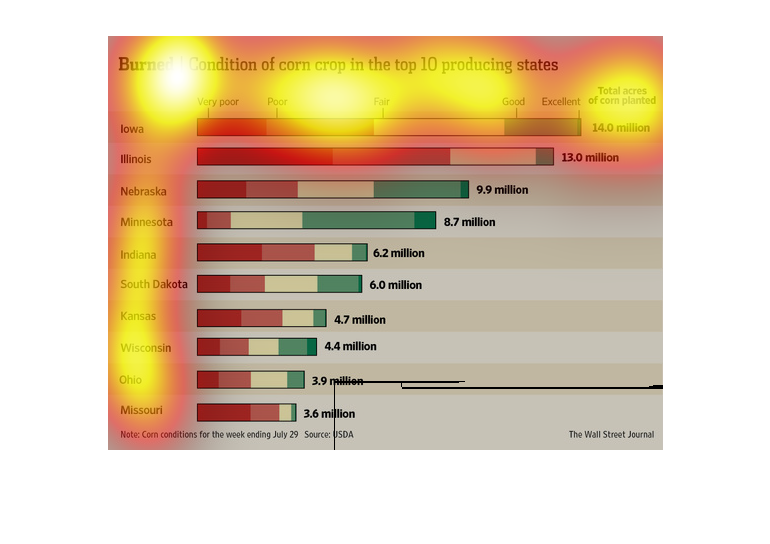
This graph shows the condition of corn crop in the top 10 producing states. The trend is that
it was a pour growing season with a lot of the crop burned. Iowa planted the largest amount
of acres, 14.0 million, of corn and of that, just under a half of it was in very poor or poor
condition. Illinois faired even worse with about 3/4 of its crop in poor or very poor condition.
Missouri had the highest overall portion of its crop in poor condition.