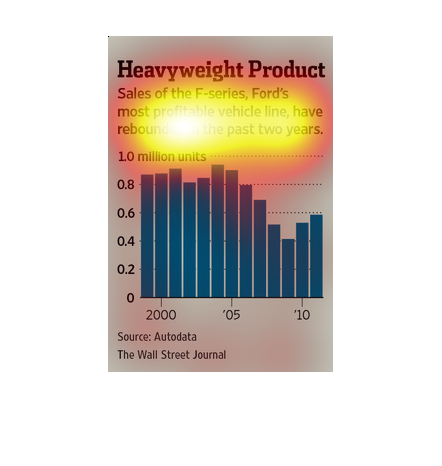
This chart from the Wall Street Journal shows how sales of Ford's F-150 truck is decreasing
over time which is having a negative impact on overall sales
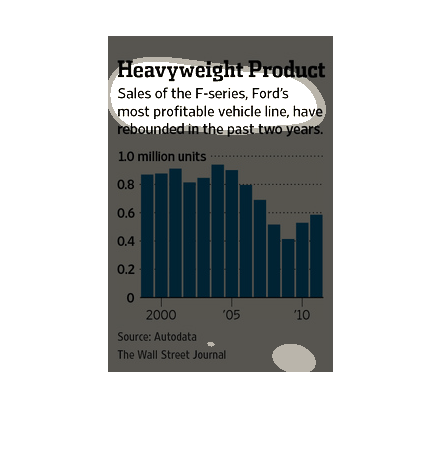
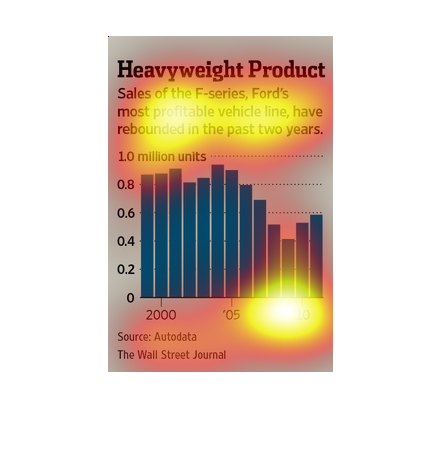
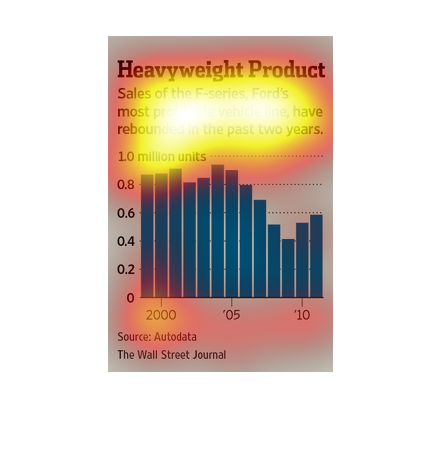
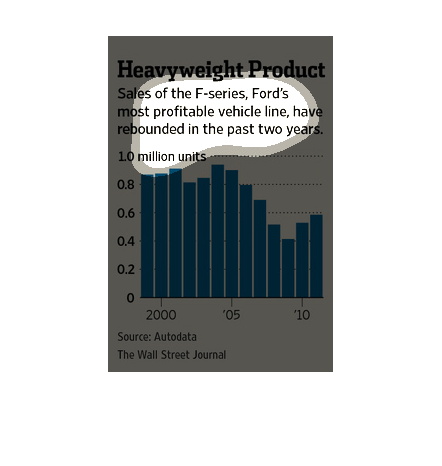
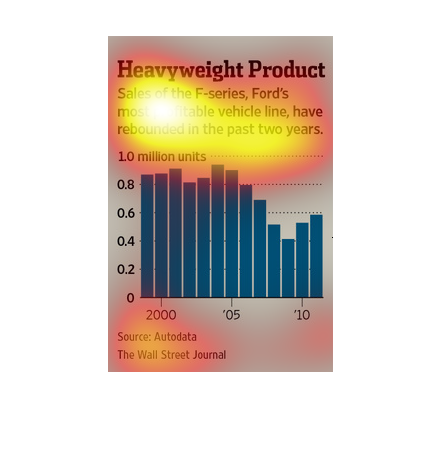
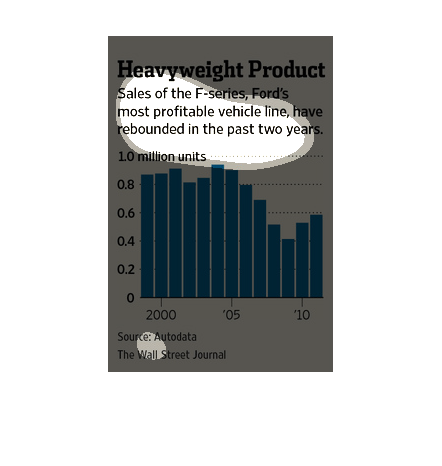
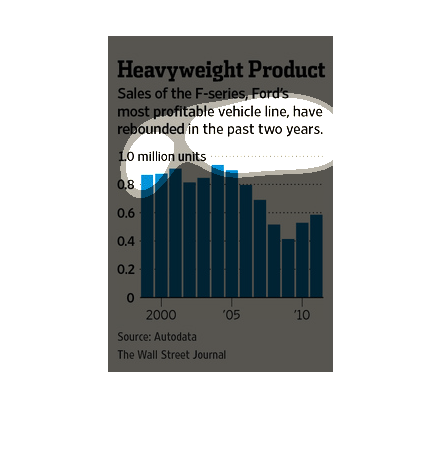
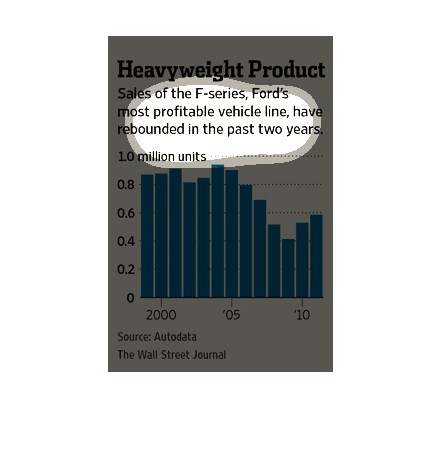
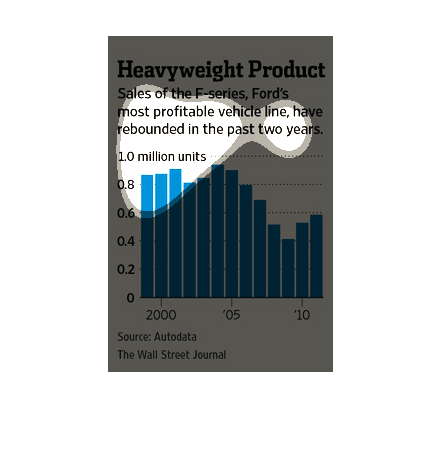
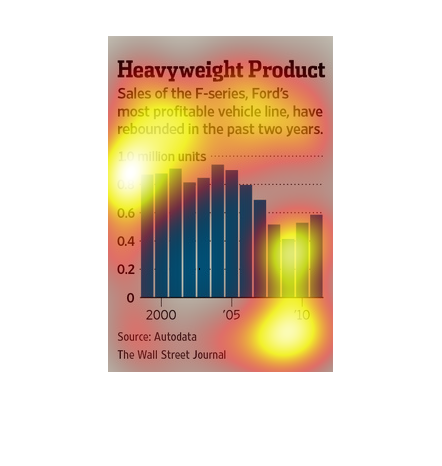
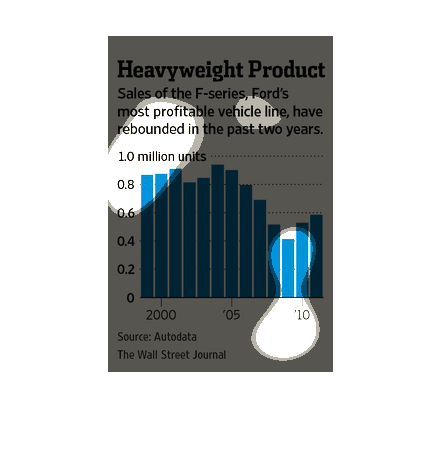
This is a series of bar graphs and related statistics depicting the sales of the F-Series,
Ford's most profitable  vehicle line, had rebounded in the past two years.
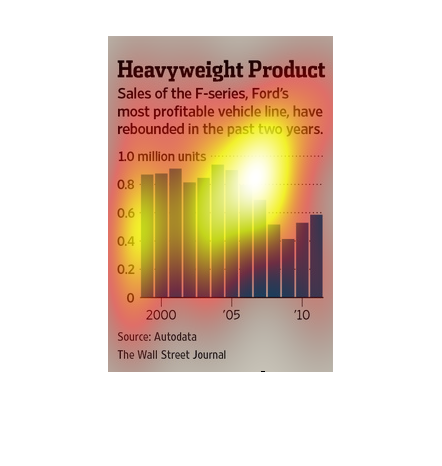
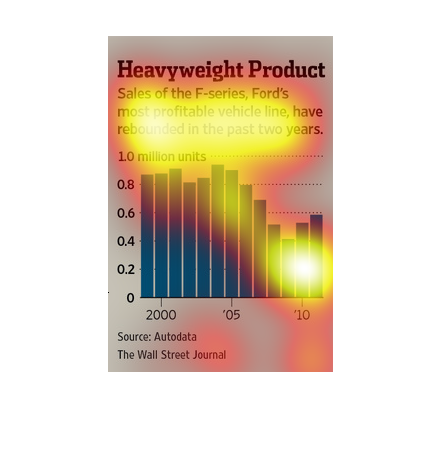
This chart from the Wall Street Journal shows how Ford is seeing decreases in sales of its
heavy duty trucks, the F-series. These trucks have higher margins than compacts
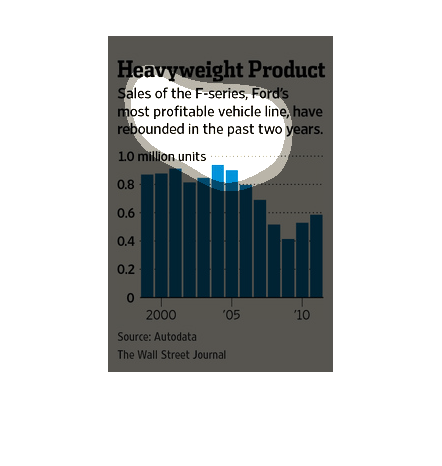
The caption of this graph is, "Heavyweight Product, Sales of the F-Series, Ford's most profitable
vehicle line, have rebounded in the last two years".  The graph displays sales data from 2000-2010
in millions for Ford motor company's F-Series truck.
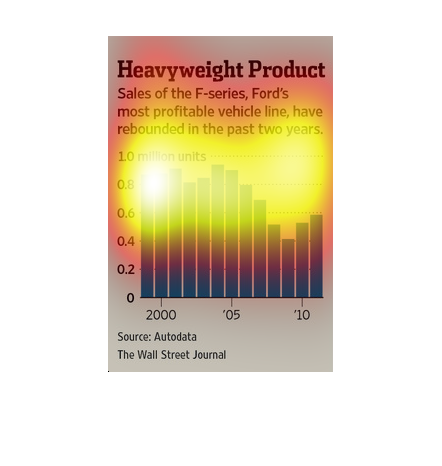
In this study conducted by the Wall Street Journal- from information gathered from Autodata-
we see that the Ford F series within the period of 2000 to 2010 has seen a resurgence in sales.
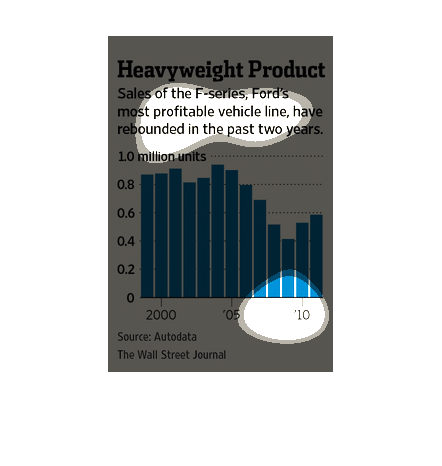
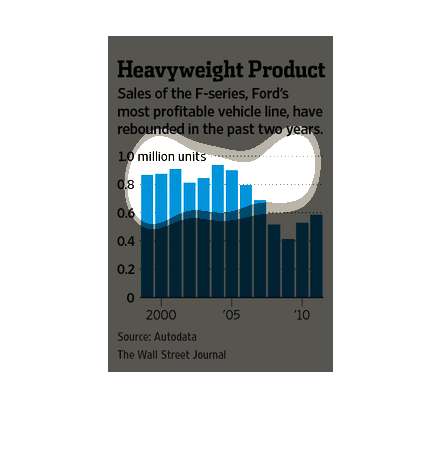
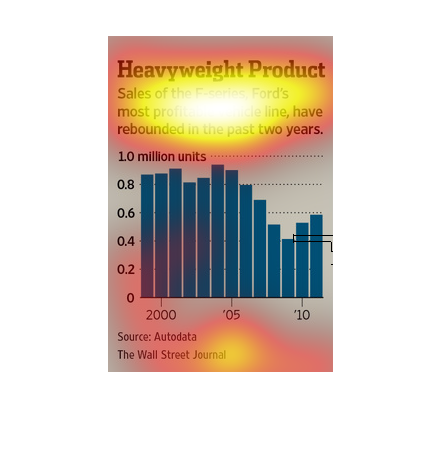
Heavyweight Product:  Sales of the F-series, Ford's most profitable vehicle line rebounded
in the past two years.  This fact is illustrated with a bar chart that shows that while it
has not reached the previous levels of 0.8-1.0 million units, the most recent two years shows
a rebound in sales.
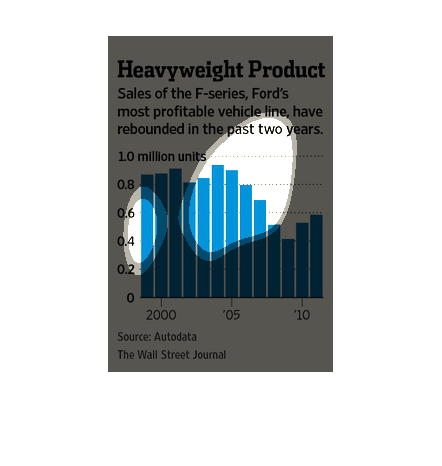
This bar graph illustrates how sales of the F-series g=Ford, their most popular vehicle line,
has rebounded in the past two years.  It has data from 2000 to 2010.
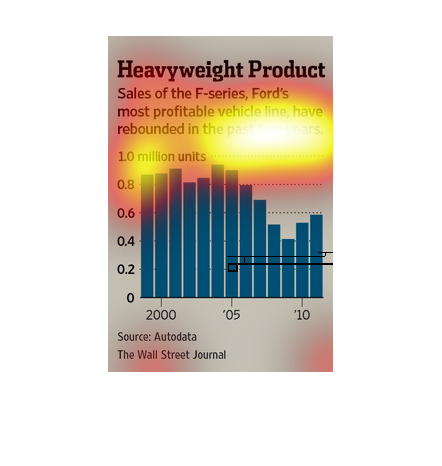
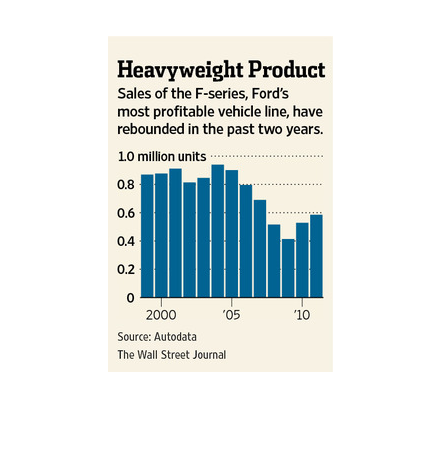
The image depicts sales of the F-series, Ford's most profitable line, having rebounded in
the past two years. Sales have increased in 2010, but still noticeably lower than their sales
highs in 2005.
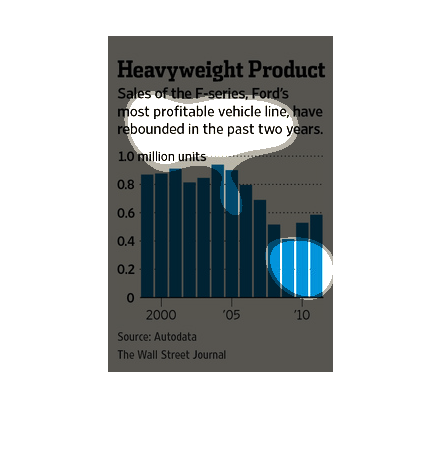
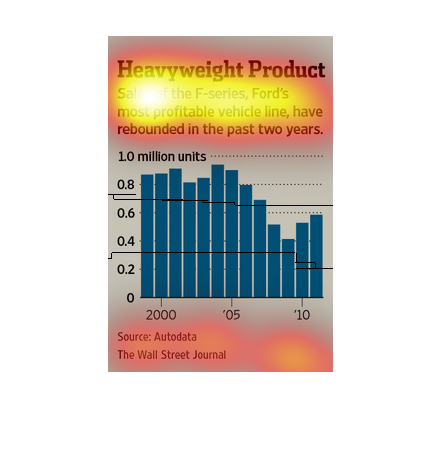
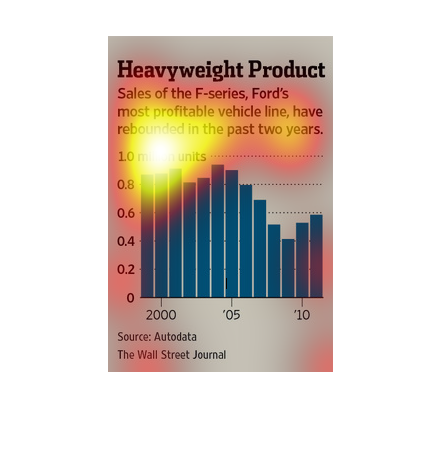
The graph shows the sales of the ford F series cars through the years of 2000 and 2010. The
graph also shows that between the years of 2000 and 2004 the sales went up meanwhile the sales
went down afterwards.
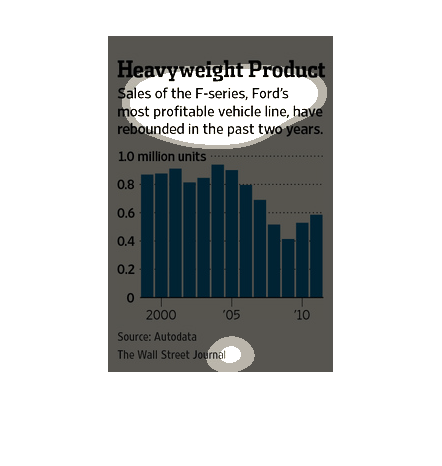
This chart describes heavyweight product. Specifically, sales of the F-series, Ford's most
profitable vehicle line, have rebounded in the past two years.
This graph shows how sales of the F- series trucks, Ford's most popular vehicle line, has
changed from the year 2000 to the year 2010 and increased over the last two years.
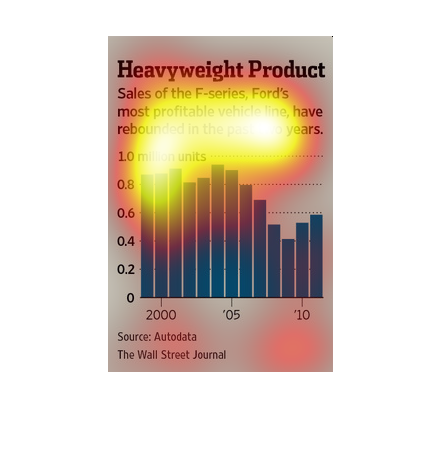
This chart describes heavyweight product. Specifically, sales of the F-series, Ford's most
profitable vehicle. The highest spike on the chart comes in the year 2205.
This chart shows how Ford's F-series has been seeing an increase of sales in the past two
years after multiple years of declining sales. Data was taken from around 2000 to 2010.
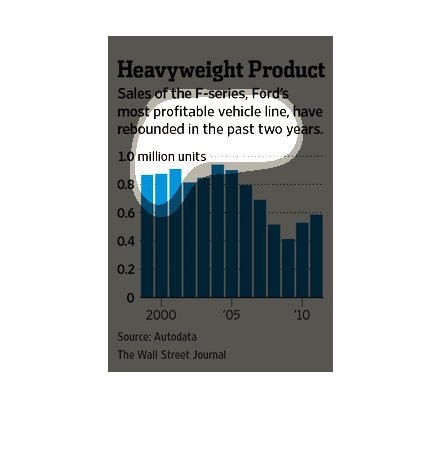
Between 2000 and 2010, sales of Ford's F-series, it's most profitable vehicle line, has decreased
from approximately .9 million units to approximately .6 million units, with its lowest year
being in 2009 at approximately .4 million units.
This chart shows sales of the Ford F-Series over the past 10 years. This chart shows a drop
in sales around 2007, and an increase over the past two years.