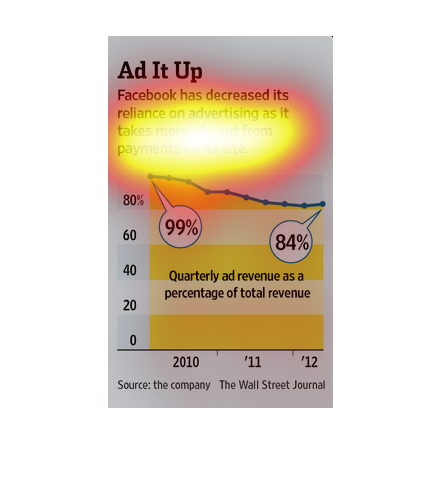
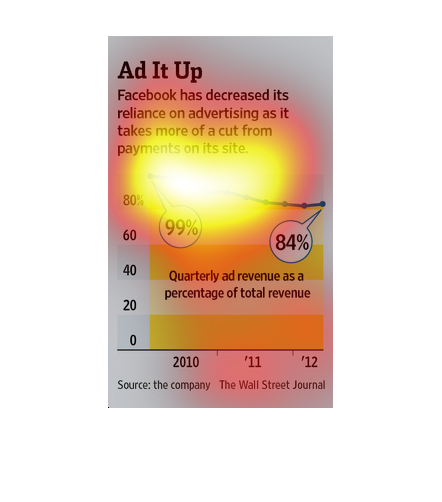
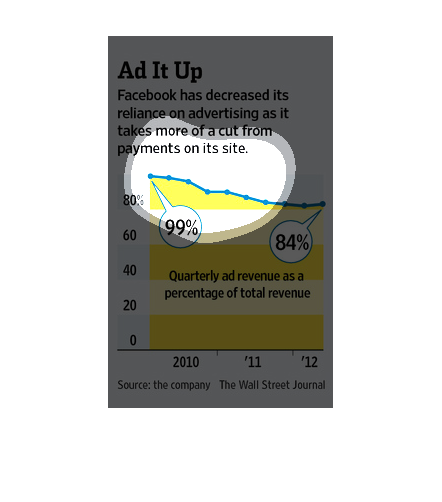
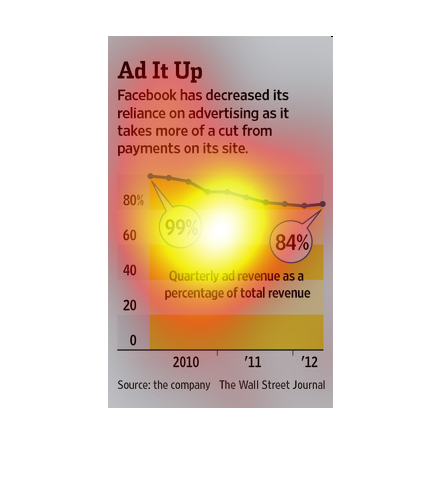
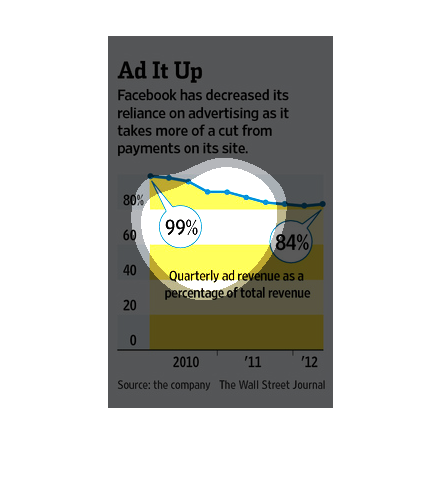
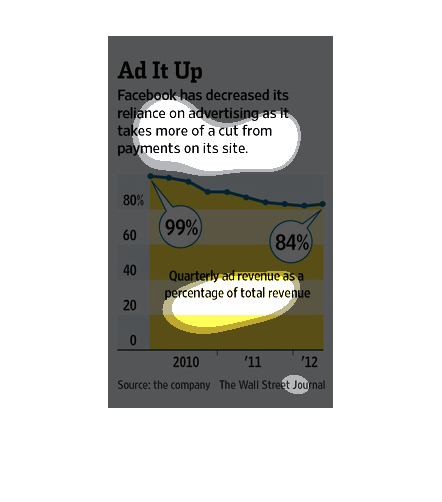
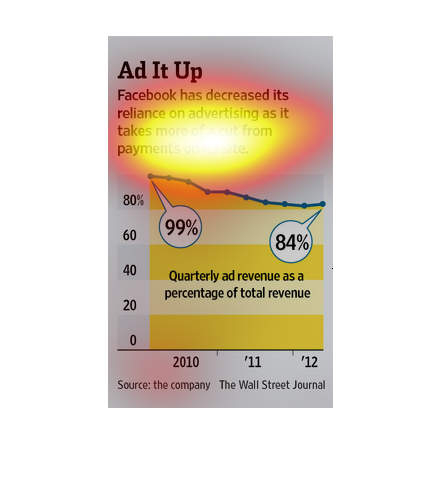
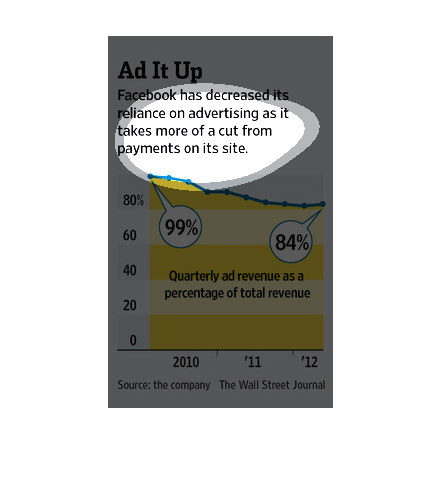
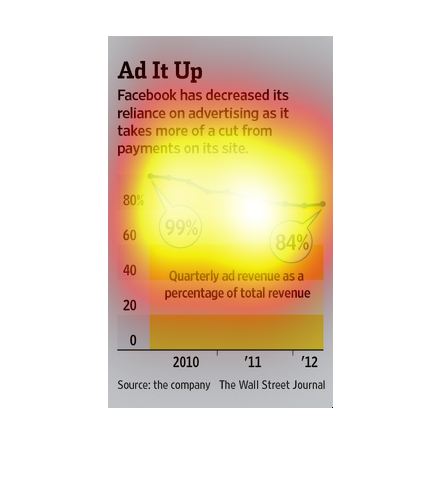
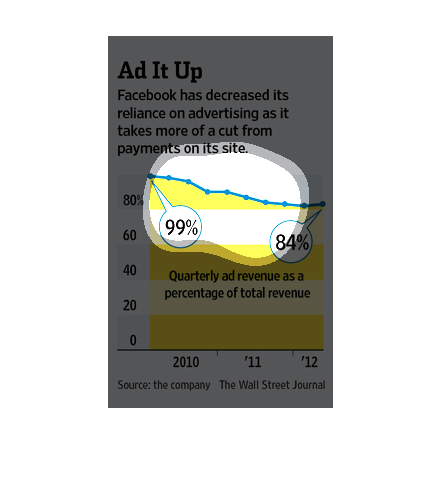
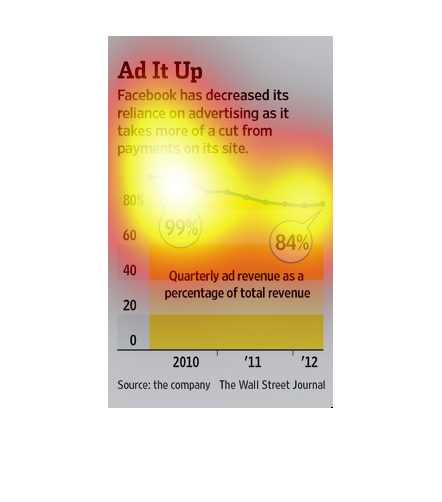
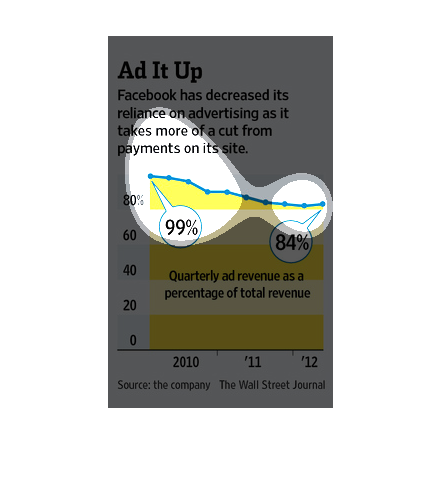
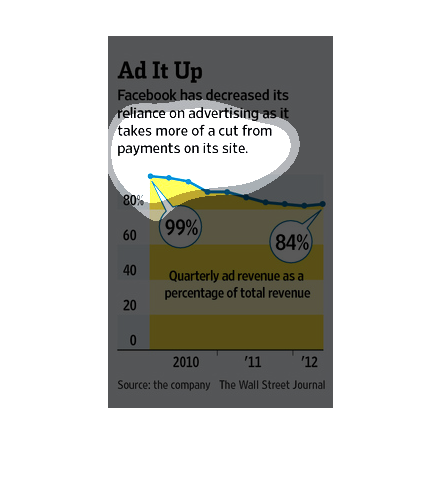
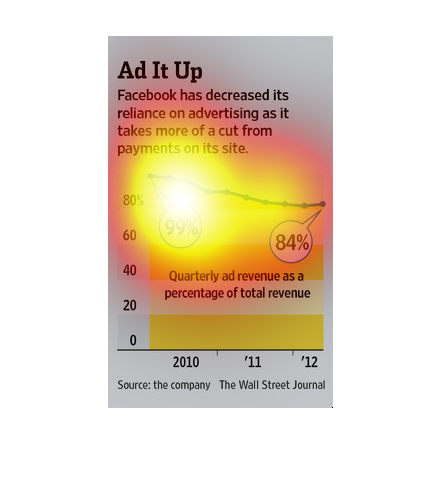
This chart describes ad it up. Specifically, Facebook has decreased its reliance on advertising
as it takes more of a cut from payments on its website.
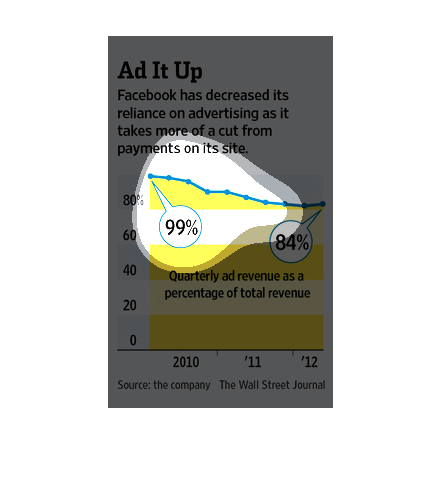
This graph shows a decrease in the percentage of revenue that Facebook receive from advertisements.
The cause of this is that Facebook is taking more of a cut from payments on its website.
This article discusses how Facebook has taken a tremendous loss because of the lack of advertising.
The pay has been cut and decreased in abundance and has caused a decline in the site.
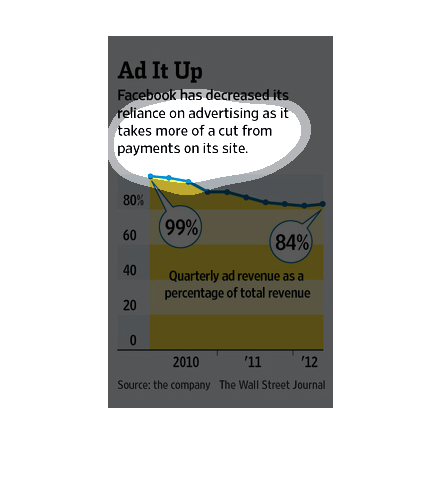
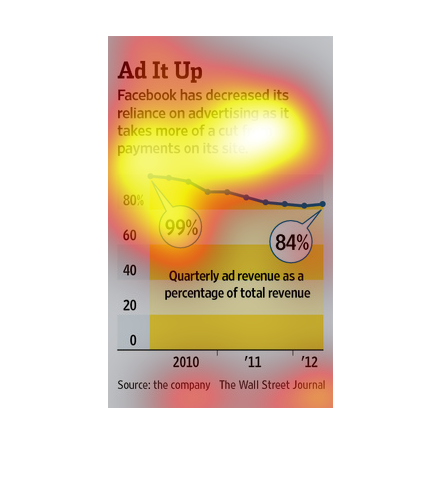
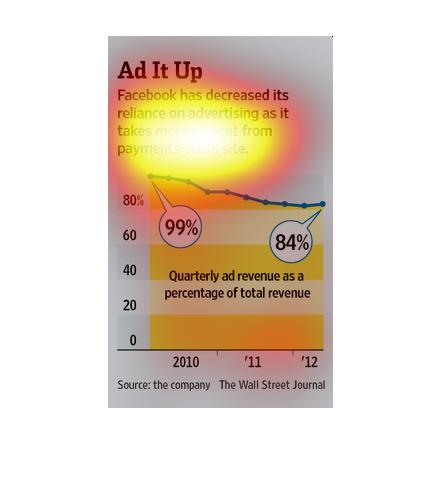
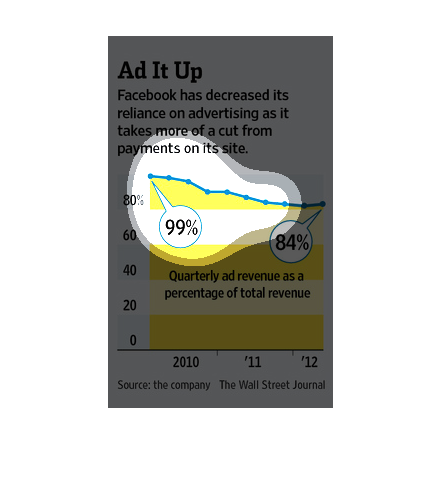
This chart shows how Facebook has decreased its reliance on advertising as it takes more of
a cut from payments made on its site.  It contains data from 2010 to 2012.
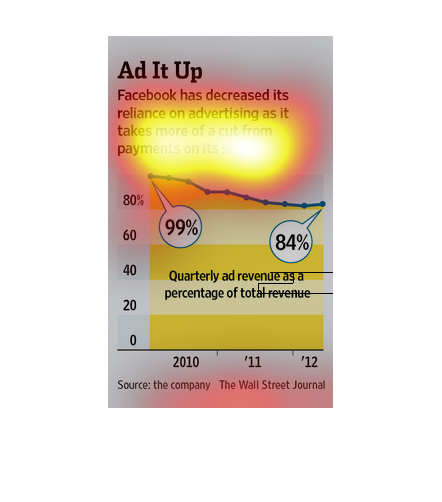
The topi is Add it up. It is discussing how facebook is cutting its Ad's. its a line graph
discussing quarterly ad revenue. This was based on the Wall street Journal. Ads are based
on cuts as well
In this study conducted on Facebook by the Wall Street Journal, it states that the site has
decreased its reliance on selling advertising to its users on have more dedicated their time
for sites to pay them to use their content.
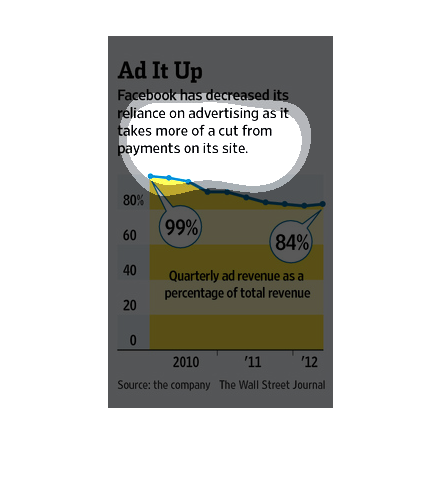
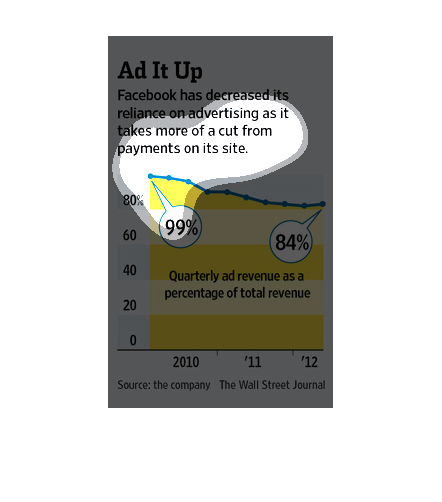
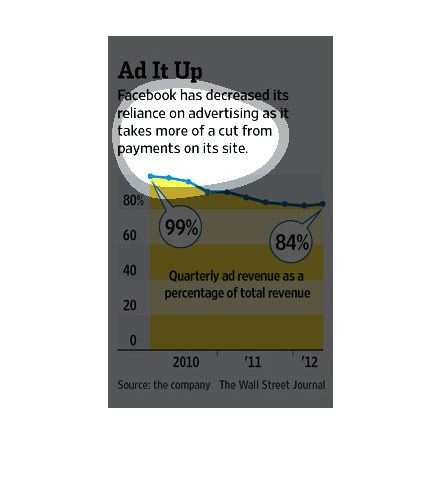
The title of this graph is ad it up. It says that Facebook has decreased its reliance on advertisements
as it takes more of a cut from payments on its site.
This chart from the Wall Street Journal shows how facebook has altered its revenue model to
rely less on advertising and more on other services provided
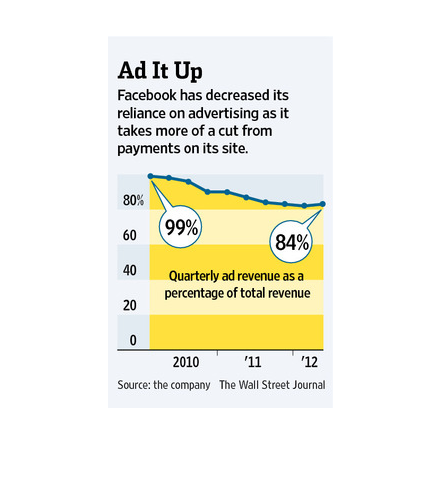
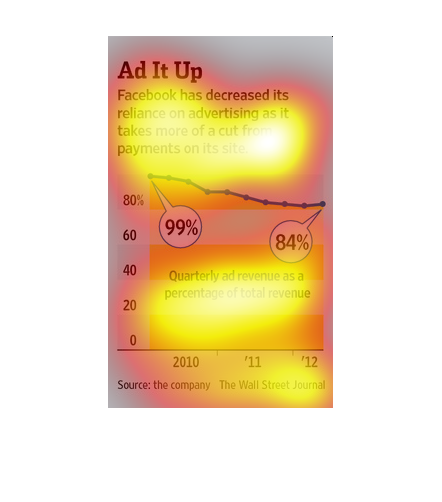
This graph shows how Facebook has decreased its reliance on advertising since it has begun
taking more of a cut from payments that are made on the website itself.  2010, 2011 and 2012
statistics are listed and the information comes from Facebook.
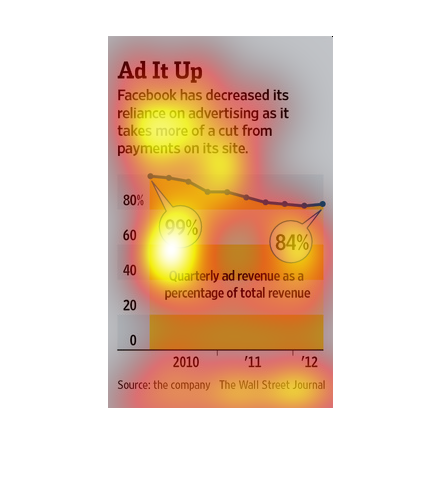
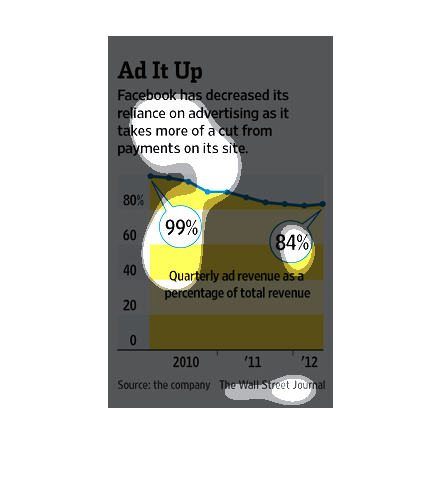
The graph shows Facebooks decline in payments as it takes cuts from its site. The graph shows
in 2010 it was 98 percent and now in 2012 it is only 84 percent
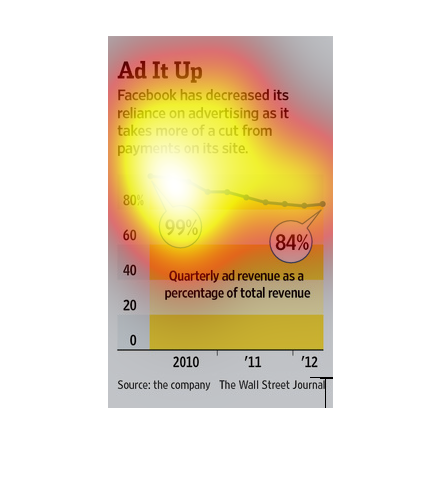
Facebook is no longer making large percentages of revenue from Advertisements. This has decreased
steadily since 2010. Facebook now makes it revenue from taking a cut from payments on its
site.
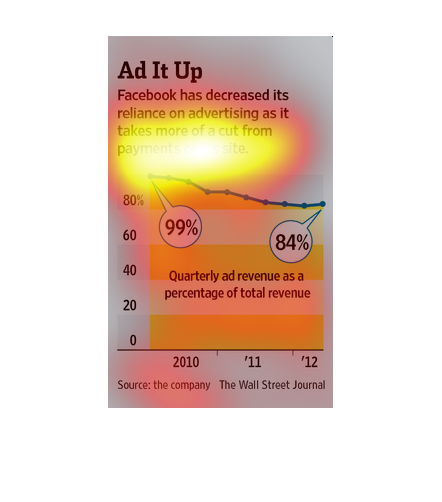
The graph shows the calculated percentage of which Facebook has taken a cut in total revenue.
The cut is due to the sites lessening reliance on advertising.
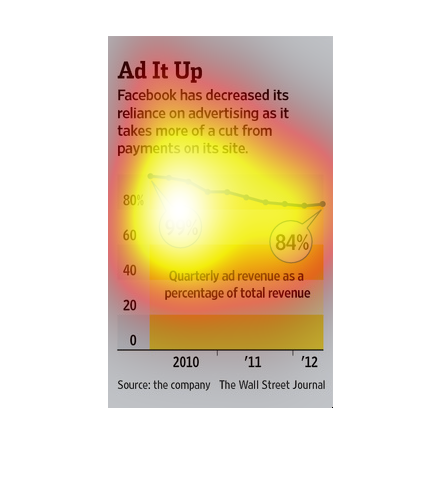
This chart from the Wall Street Journal shows how facebook has decreased its reliance on ad
revenue to support its business model and on other revenue sources

This chart describes ad it up. Specifically, Facebook has decreased its reliance on advertising
as it takes more of a cut from payments on its website.
Before I clicked on anything, the blurry image looked like a common text message screen on
my phone.   After I clicked on it, I found the image was about Facebook spending less on advertising
because it takes a cut from its payment service.  The graphs below show year over year differences.