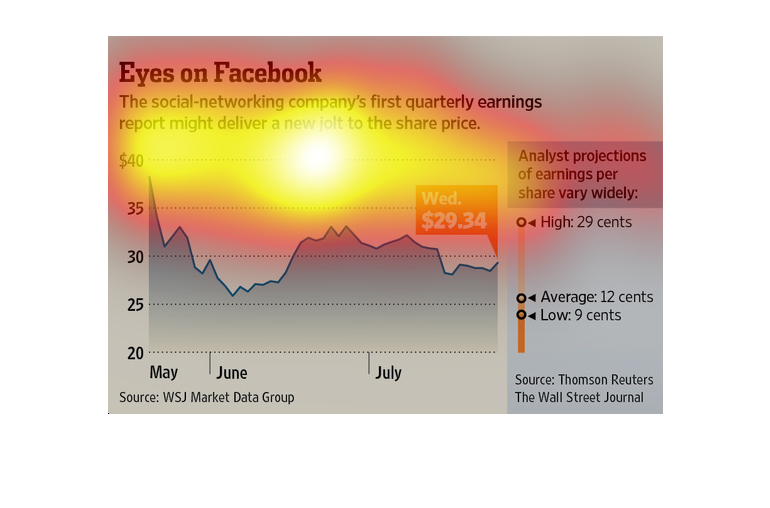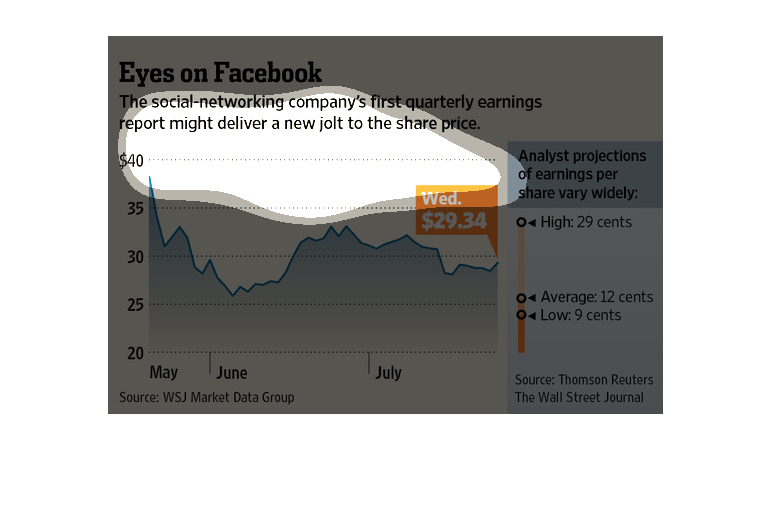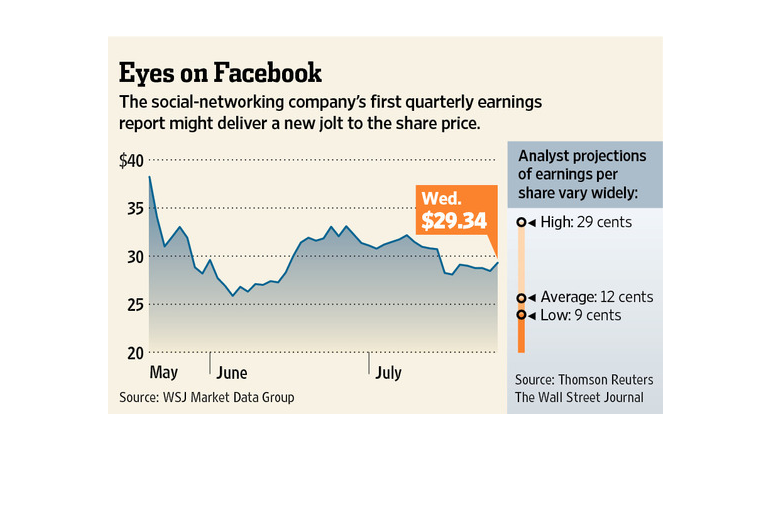
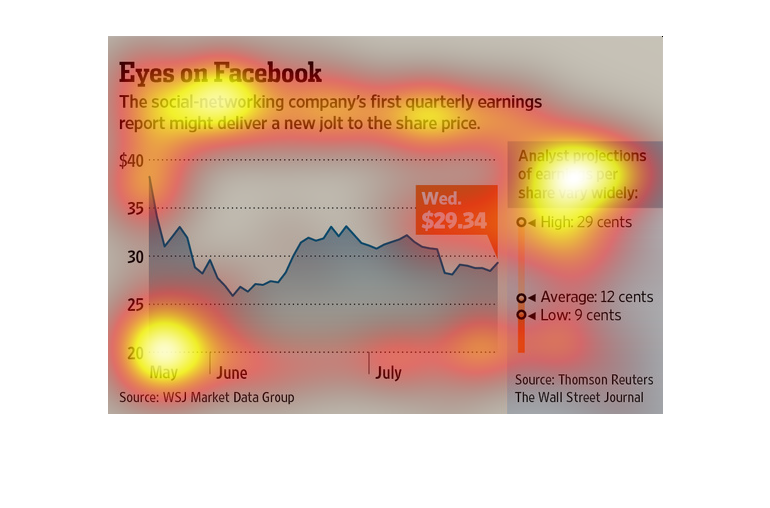
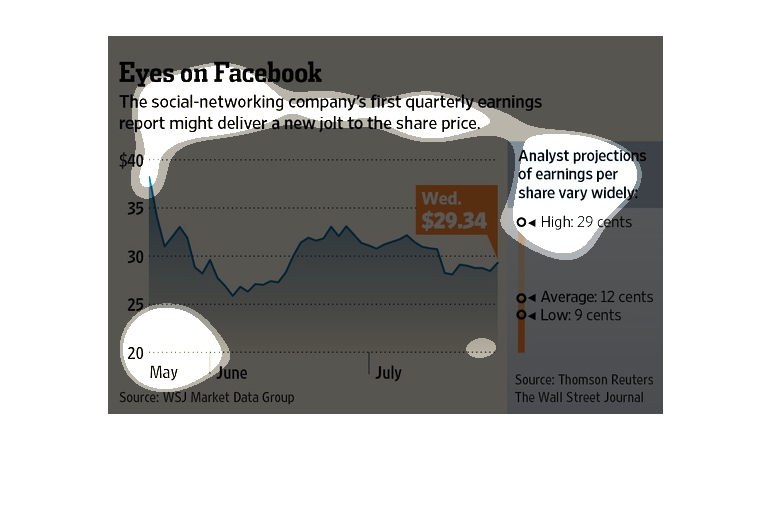
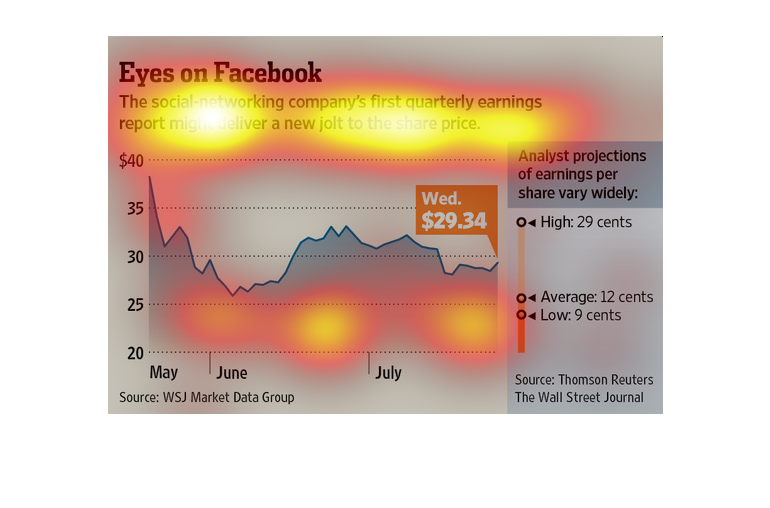
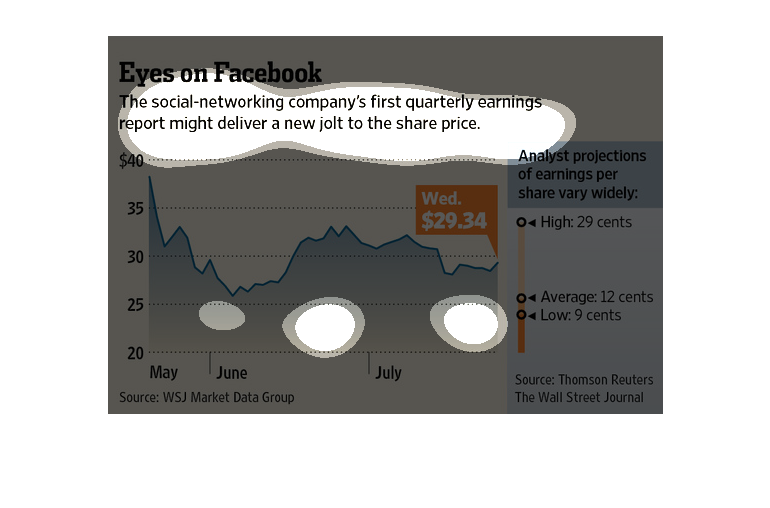
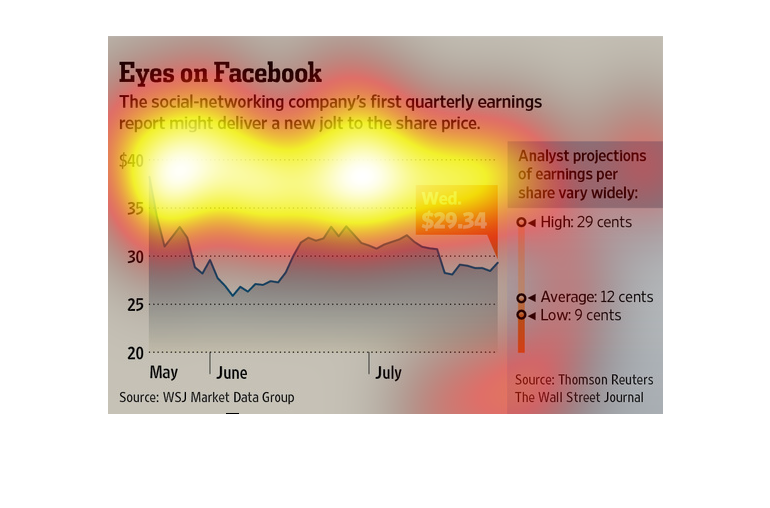
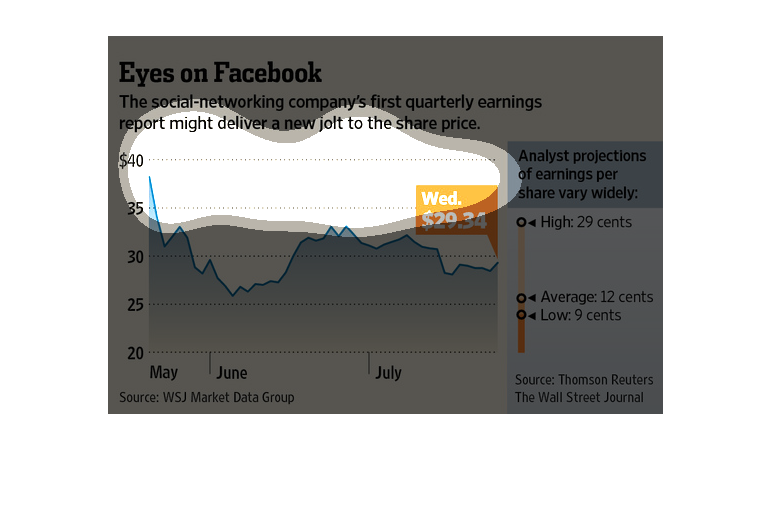
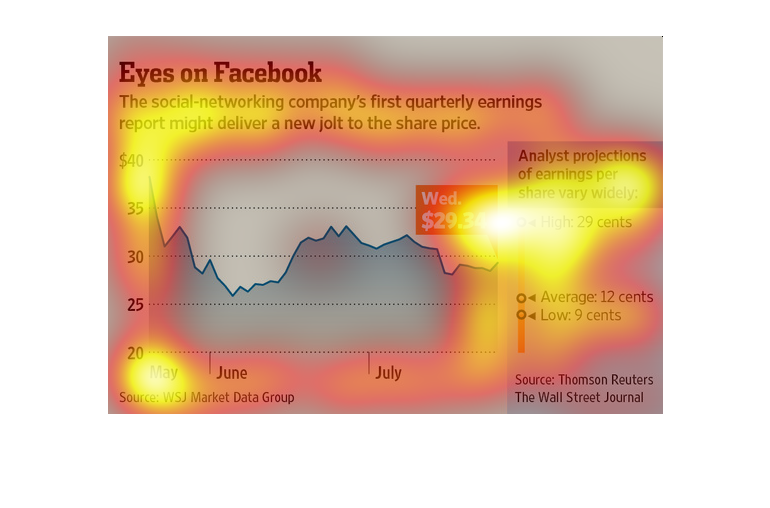
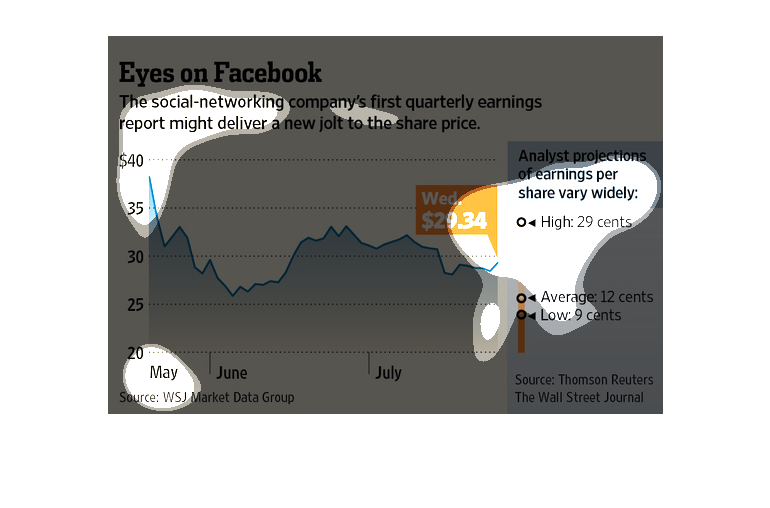
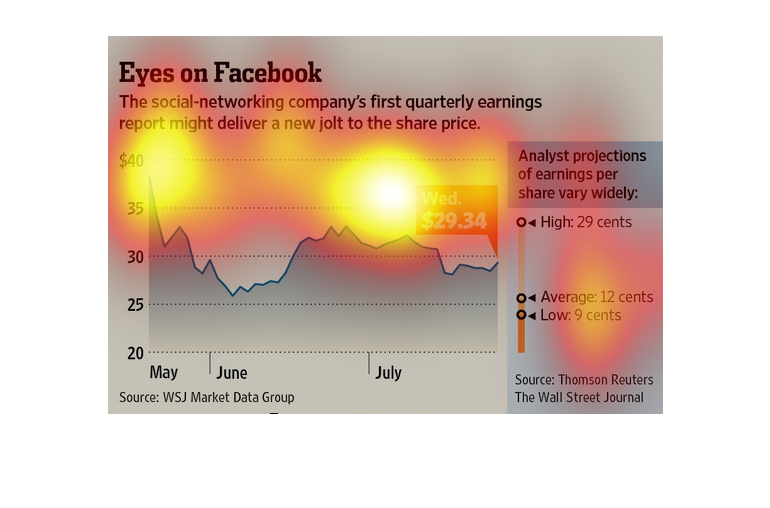
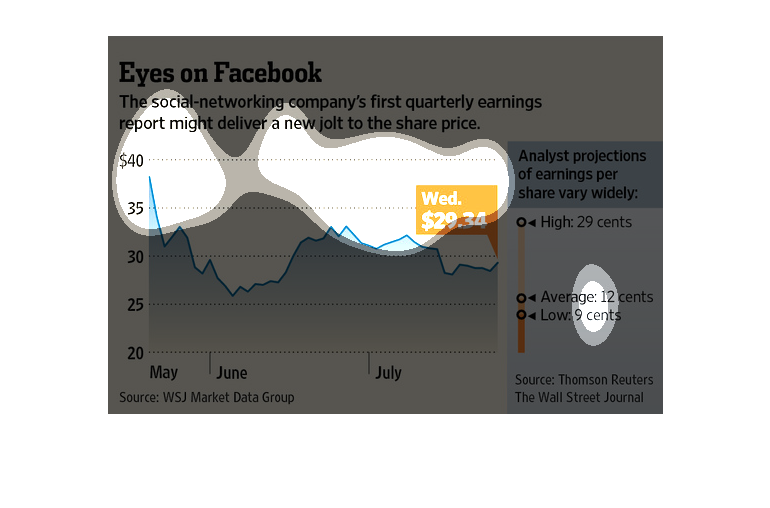
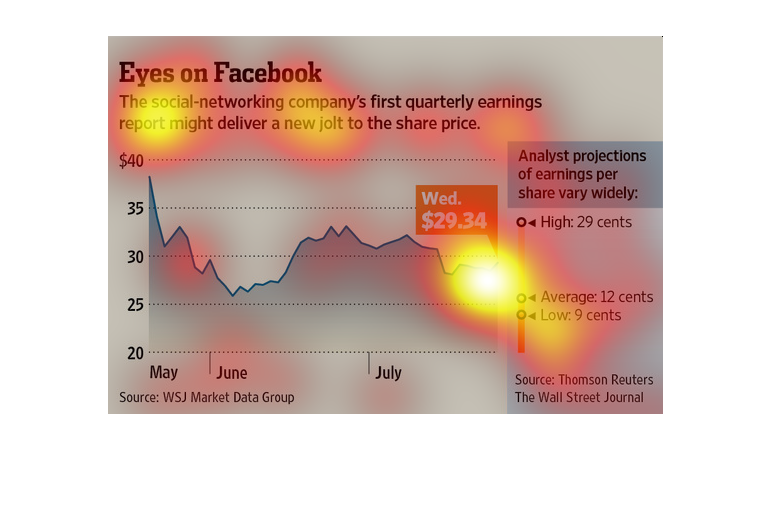
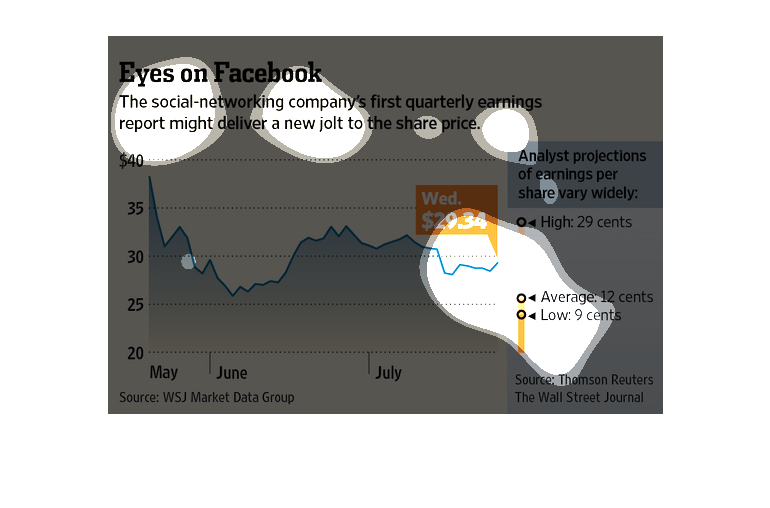
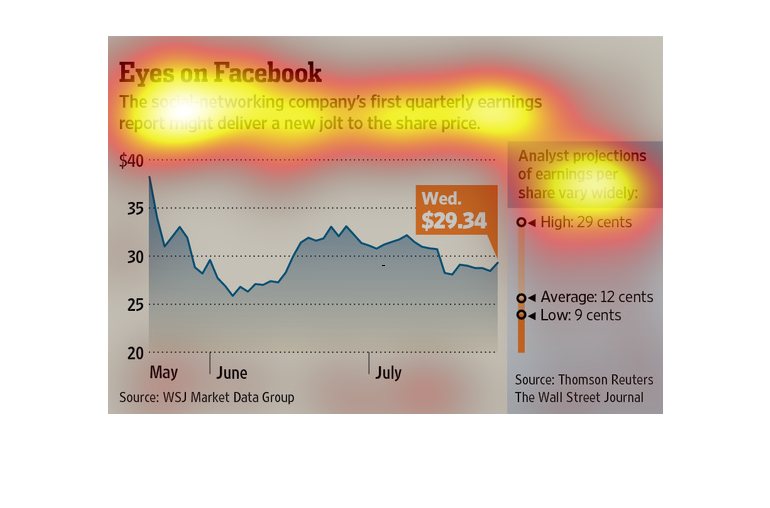
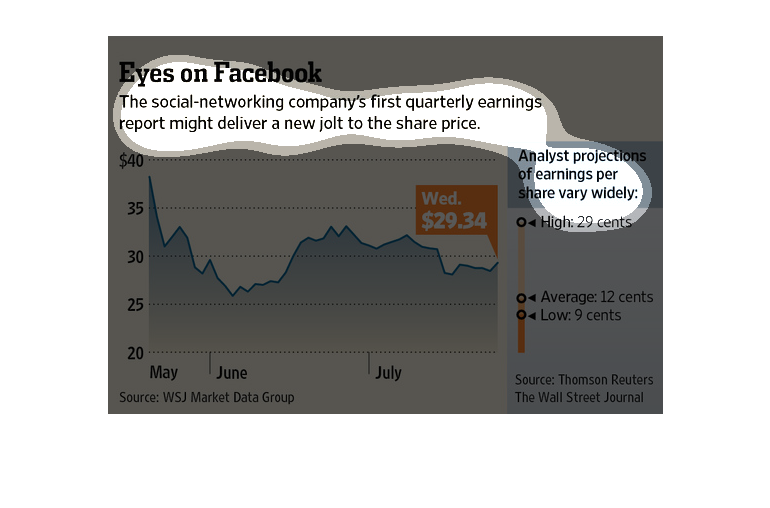
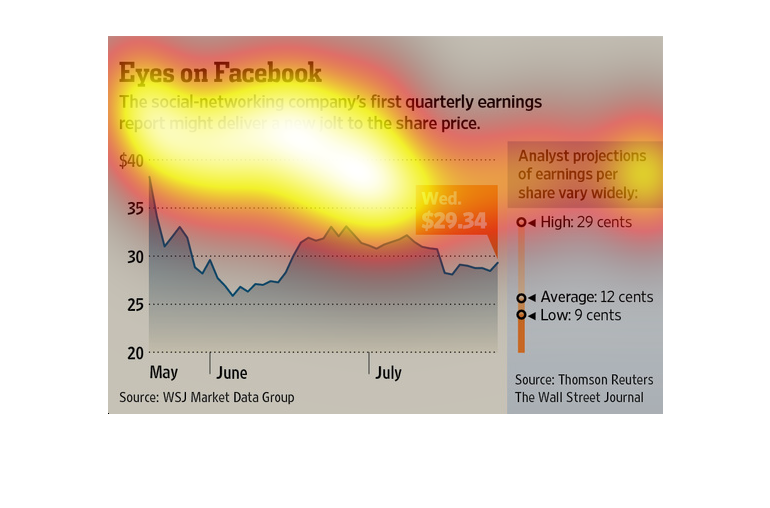
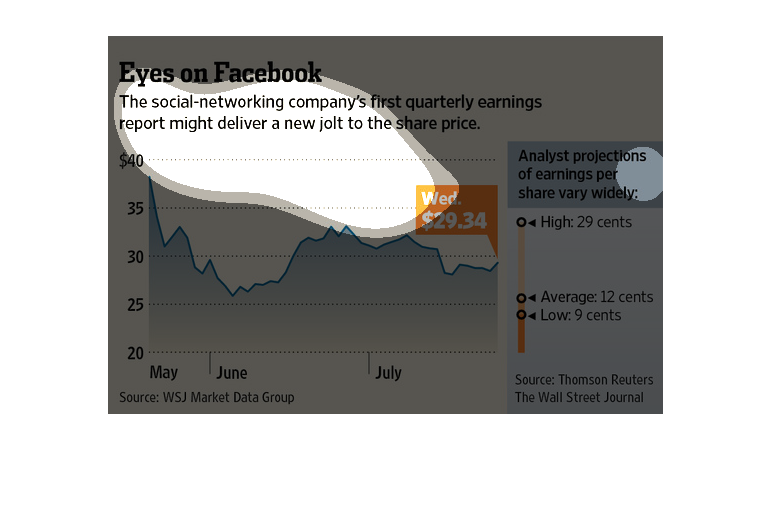
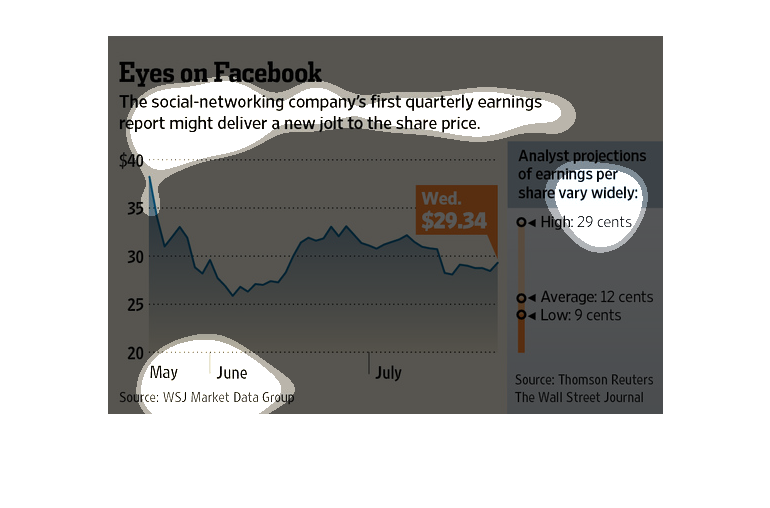
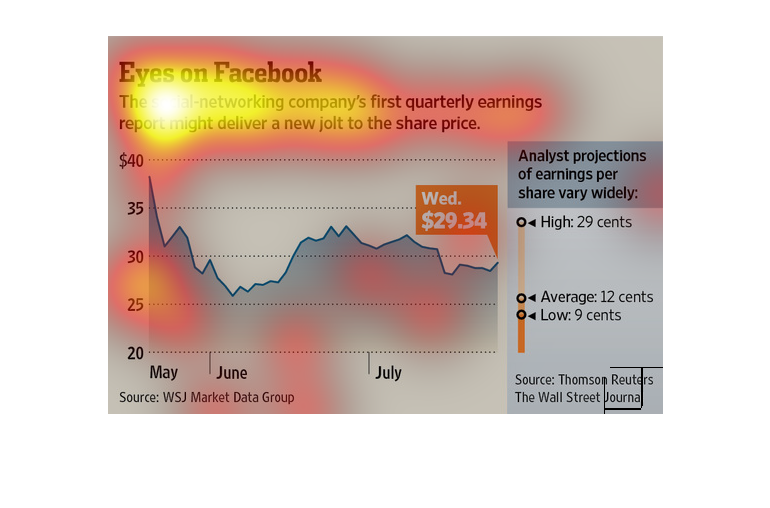
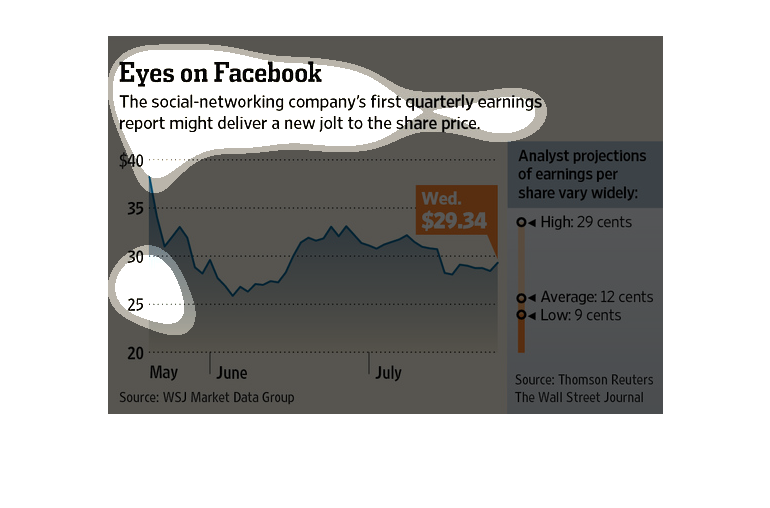
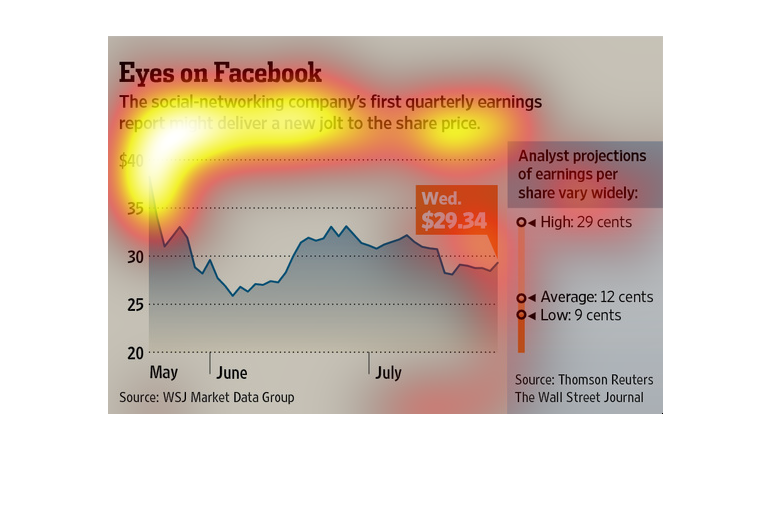
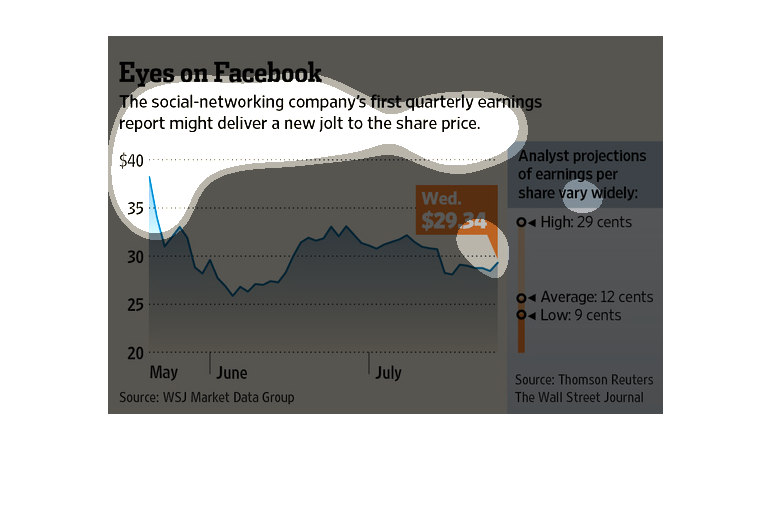
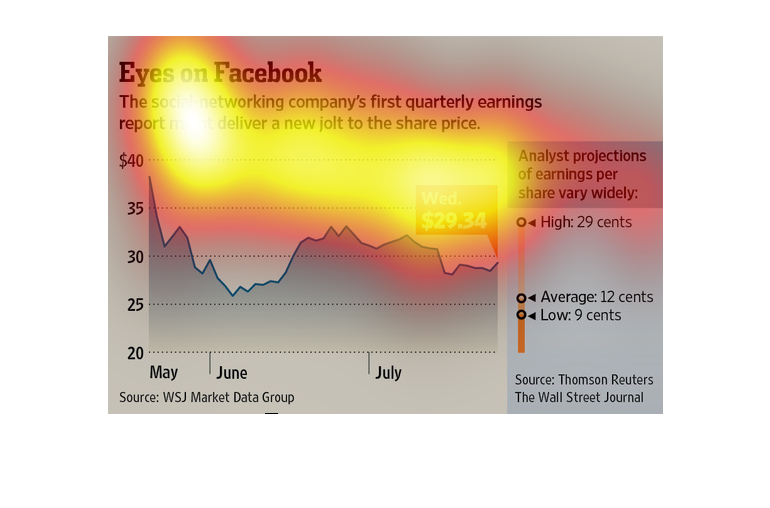
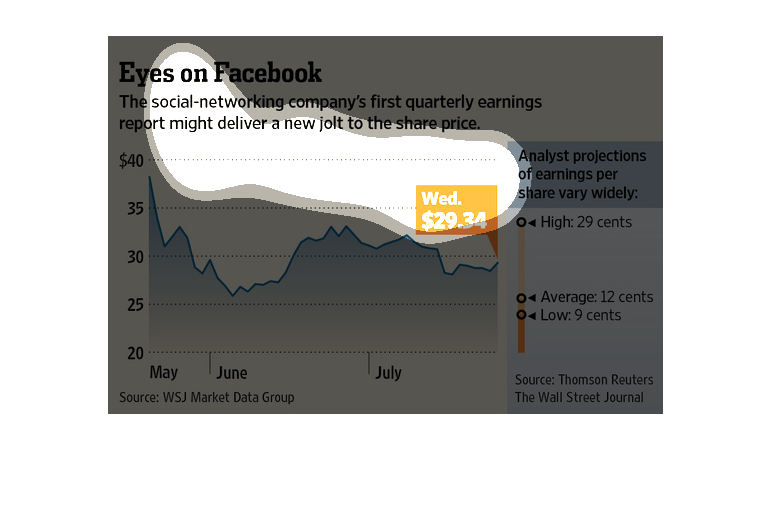
The caption for this chart is, "Eyes on Facebook, The social networking company's first quarterly
earnings report might deliver a new jolt to the share price".  There are two separate graphs
that display Facebook's shares price from May through July.  While another graph shows projections
that analyst have predicted.
This image shows or depicts in statistical line bar graph format information concerning with
Facebook and the amount of first quarter revenue that would deliver a jolt the share price.
This graph is a simple representation of the stock price of Facebook over a long period of
time. This is a simple line graph that tracks the price of the stock over time.
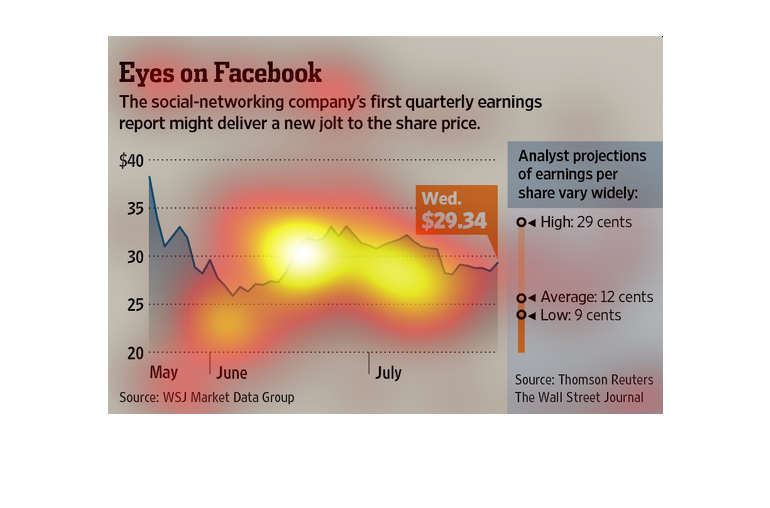
This chart from the Wall Street Journal shows how the market is anticipating facebook's performance
during its first public earnings release after the IPO
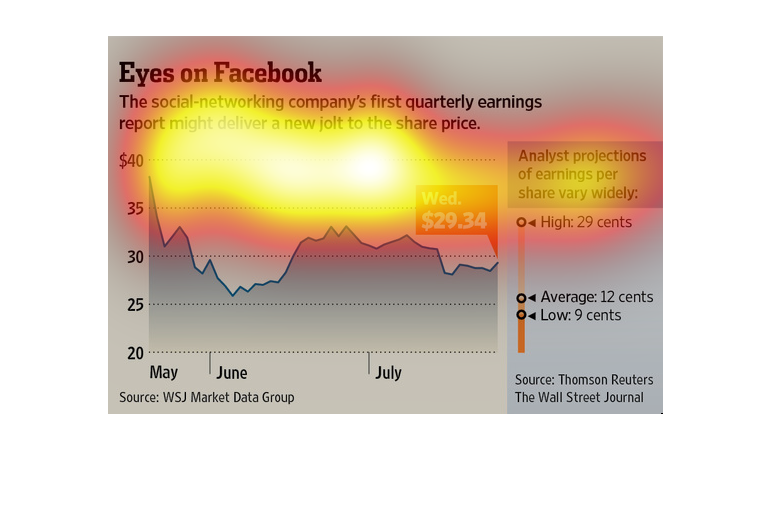
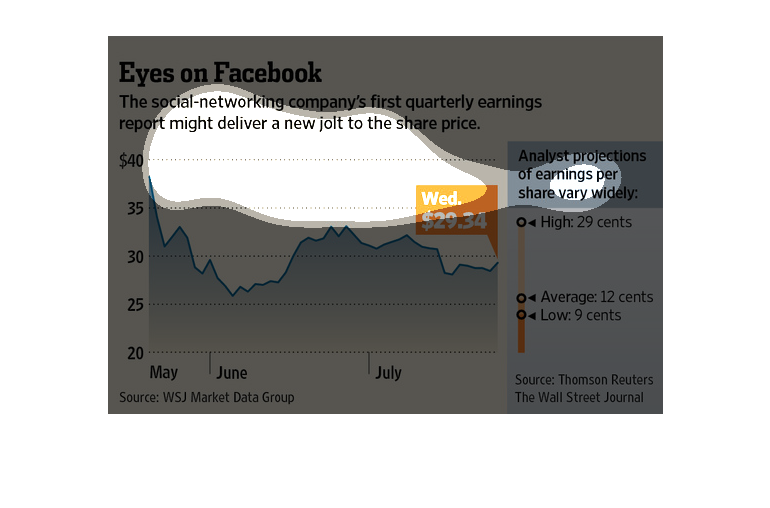
The graph shows the trend of the price of Facebook stock shares from May through July.  The
sidebar shows the projection of analysts for the increase of the share price, with an average
estimate of 12 cents.
This is a graph illustrating the earning of Facebook after going IPO and how they may be looking
forward to a jolt in share price in the future based on projected earnings per share.
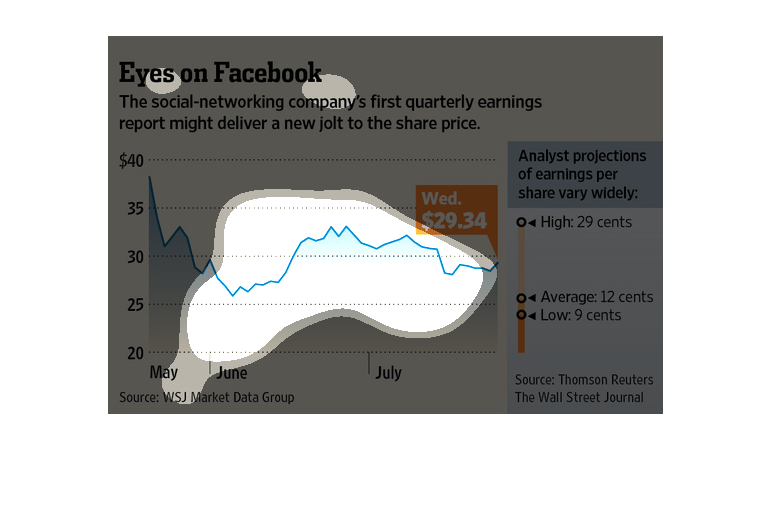
This is a chart of Facebook share values. IT details value of shares over months and a new
upswing, though overall value is questionable. Value only began recovering after June.
A chart showing the growth of Facebook's stock shares.  Analysts project that Facebook's first
quarterly earnings report should reveal widely varying earnings.
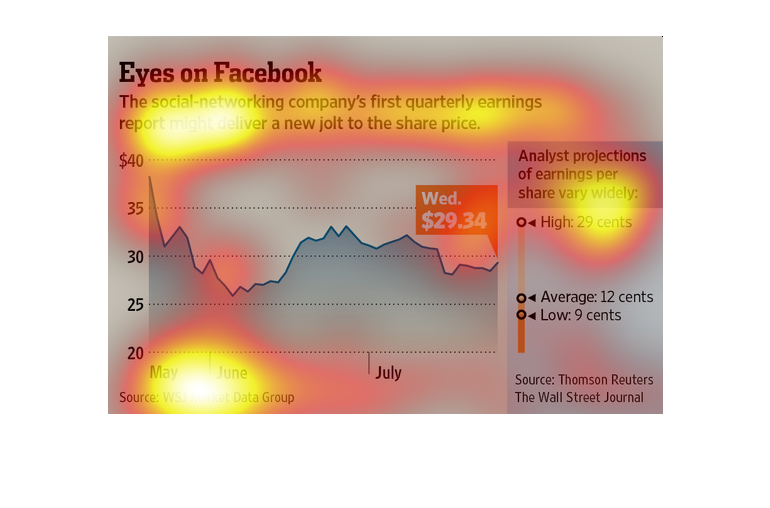
This chart from the Wall Street Journal shows howthe market is preparing the for the earnings
report from Facebook after it went IPO. It shows the market expectations
If you want to make some money, you better invest in Facebook stop according to this research
done by the Wall Street Journal. In it we find that the stock is steadily on the rise.
This chart/graph displays Facebook's social network quarterly earnings. Just as of May, it
piked high and is still staying steady.The source is from WSJ Market Data group
This chart describes eyes on Facebook. Specifically,the social networking company's first
quarterly earnings. The highest spike on the chart comes in the the $40 dollar mark.
The image depicts Facebook's first quarter earning report possibly increasing the share price
of the tech giant's stock. The data shows the present stock declining from around $40 in May
to $29.34 in July.
The title of the graphic is eyes on facebook. It says that the social networking company's
first quarterly earnings report might deliver a new jolt to share prices.
This chart describes eyes on Facebook. Specifically, social networking company's first quarterly
earnings report might deliver a new jolt to the share price.