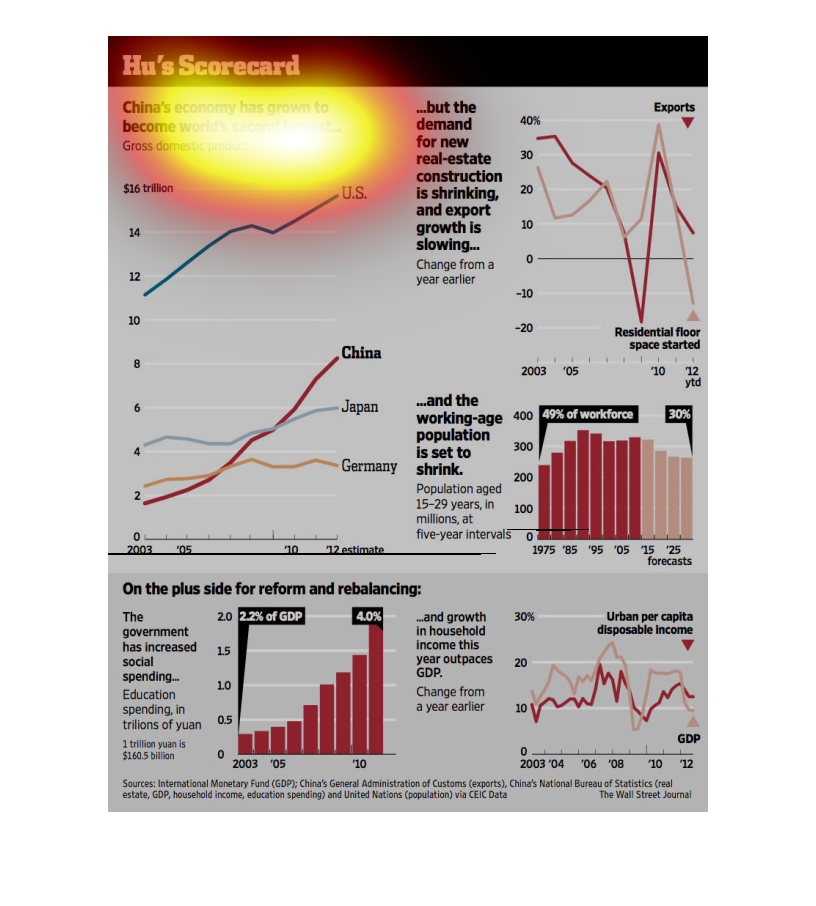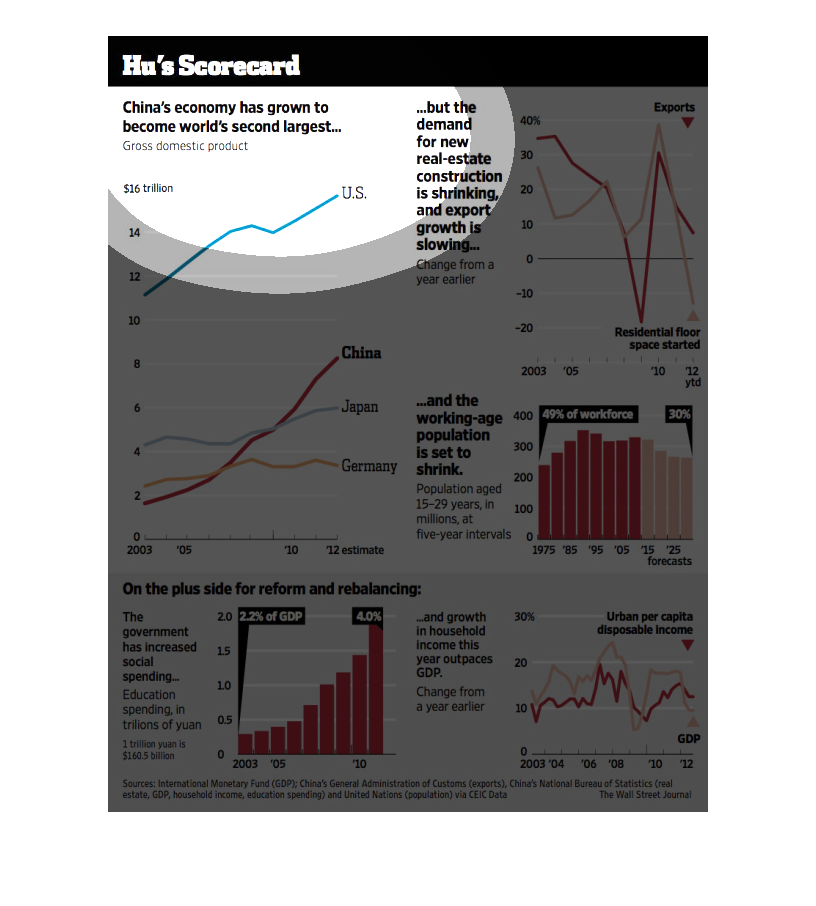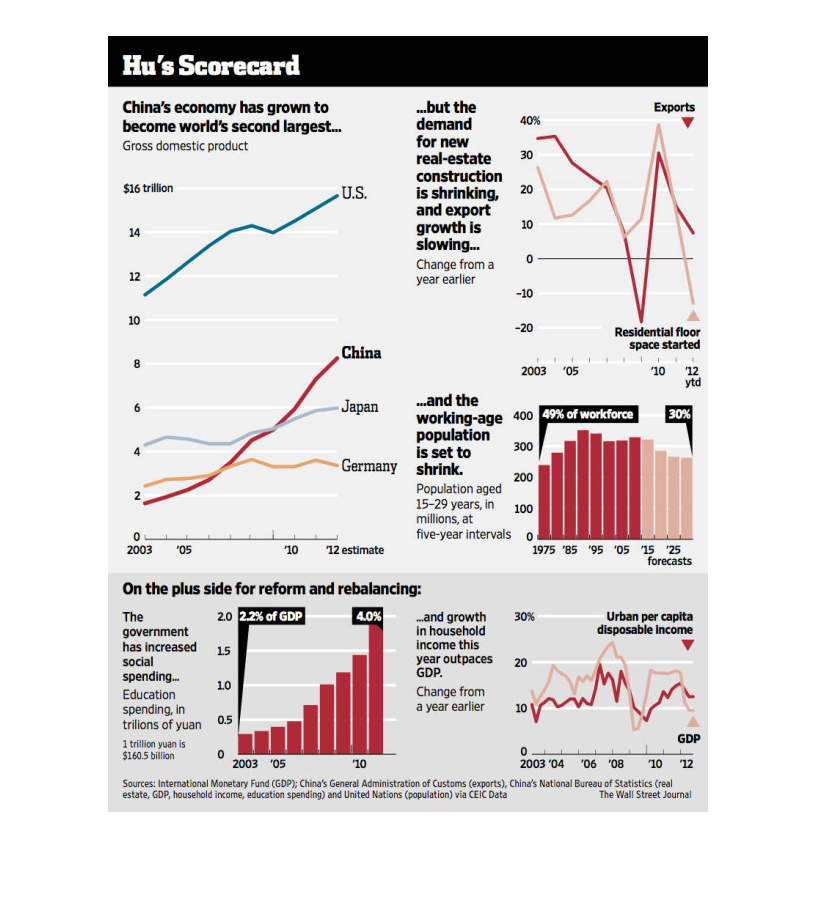
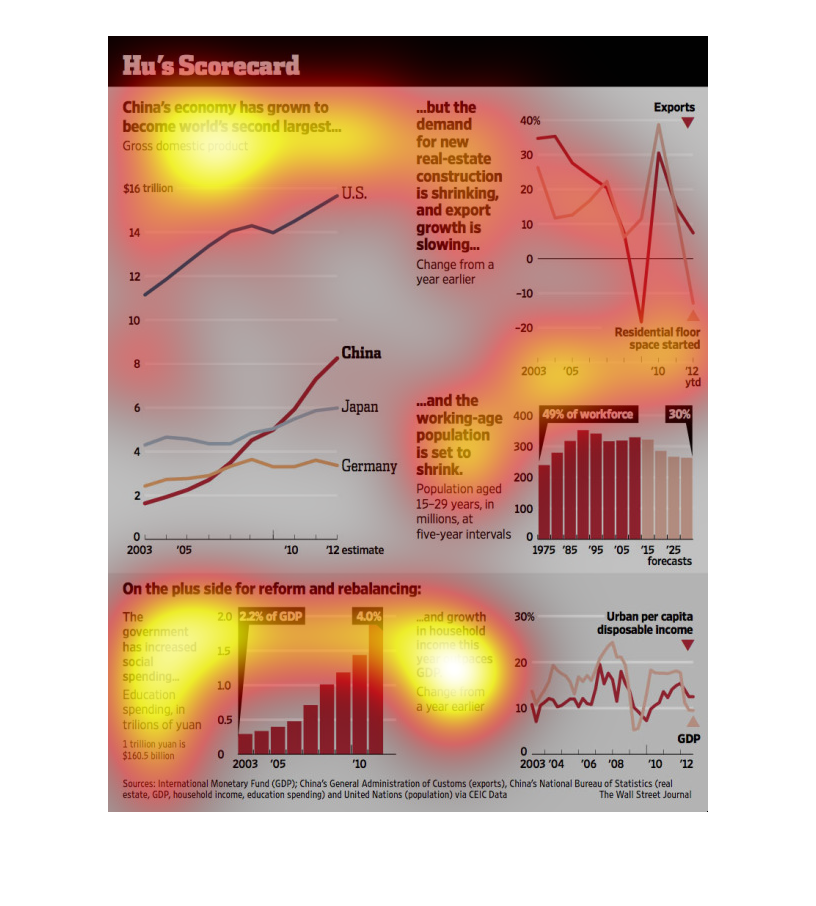
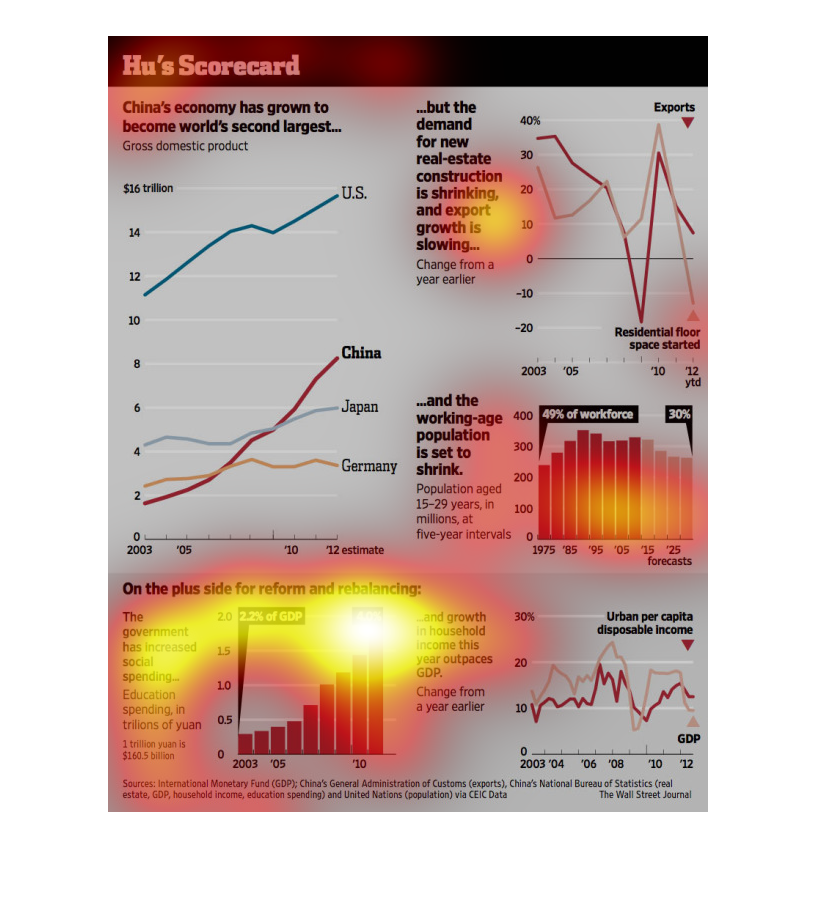
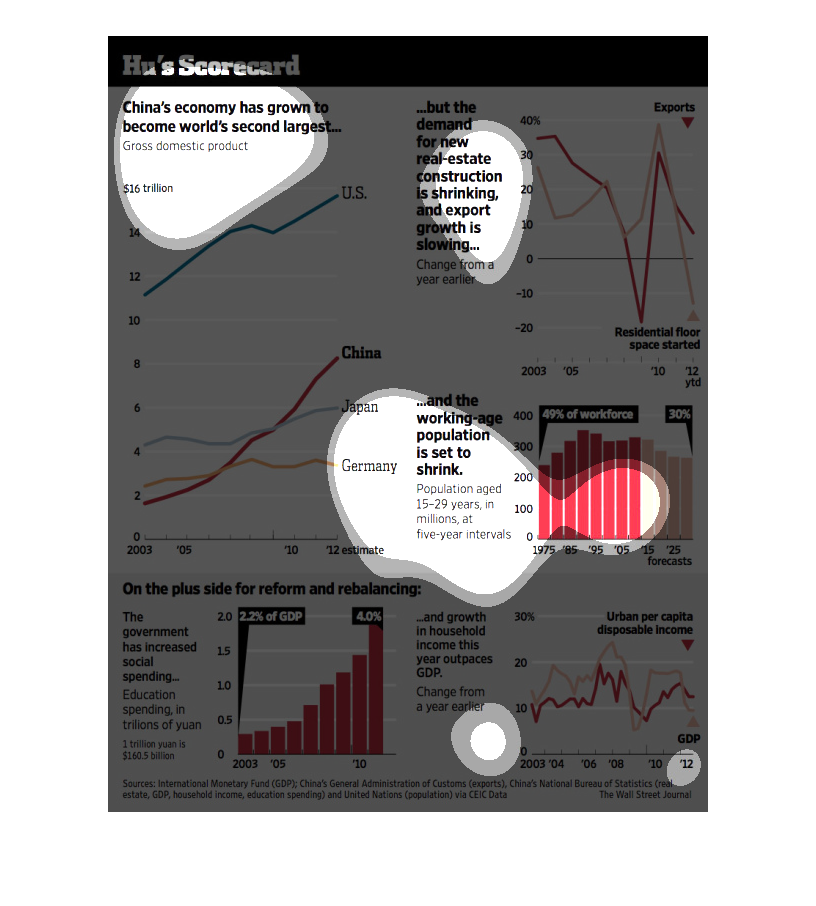
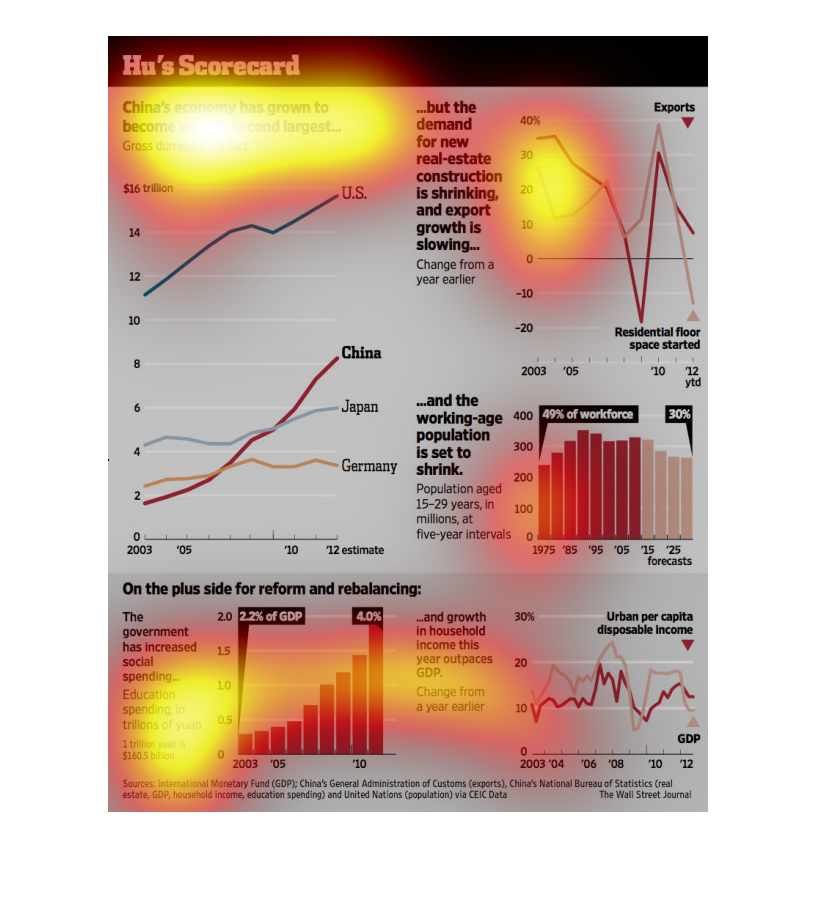
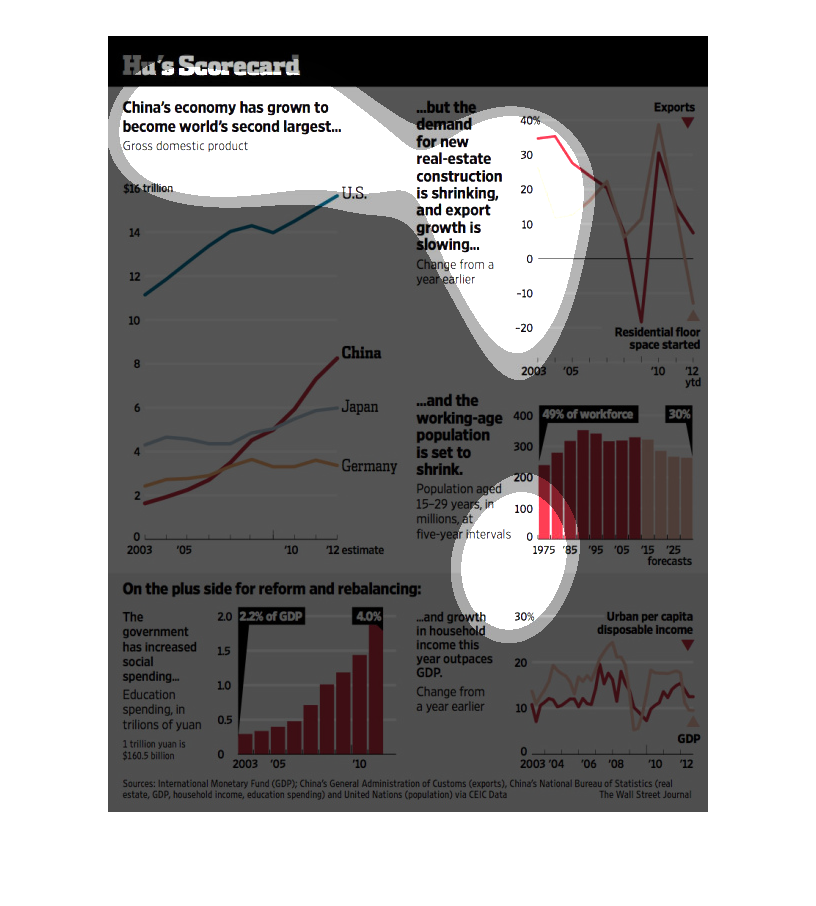
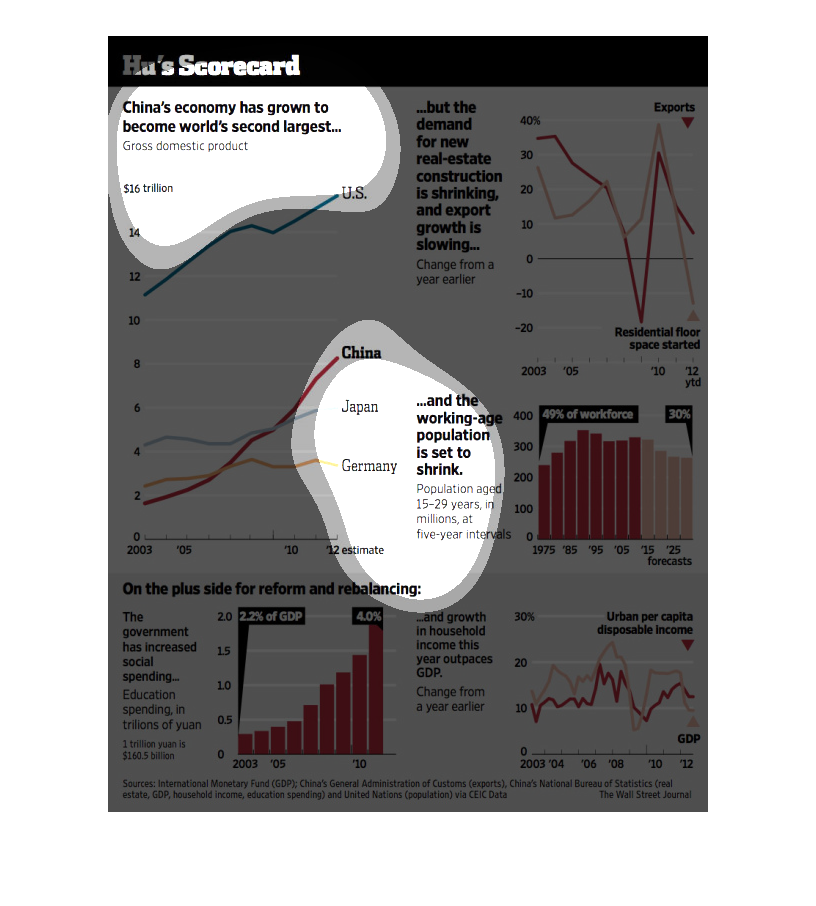
This graph represents the decreasing housing demand and export growth despite China being
the worlds number 2 economy behind the United States. Real-estate demand and exports have
been declining since 2003, which could forecast difficult times for the world economy. However,
despite this, other graphs point to positive aspects such as increased social spending and
household income outpacing gross domestic product.
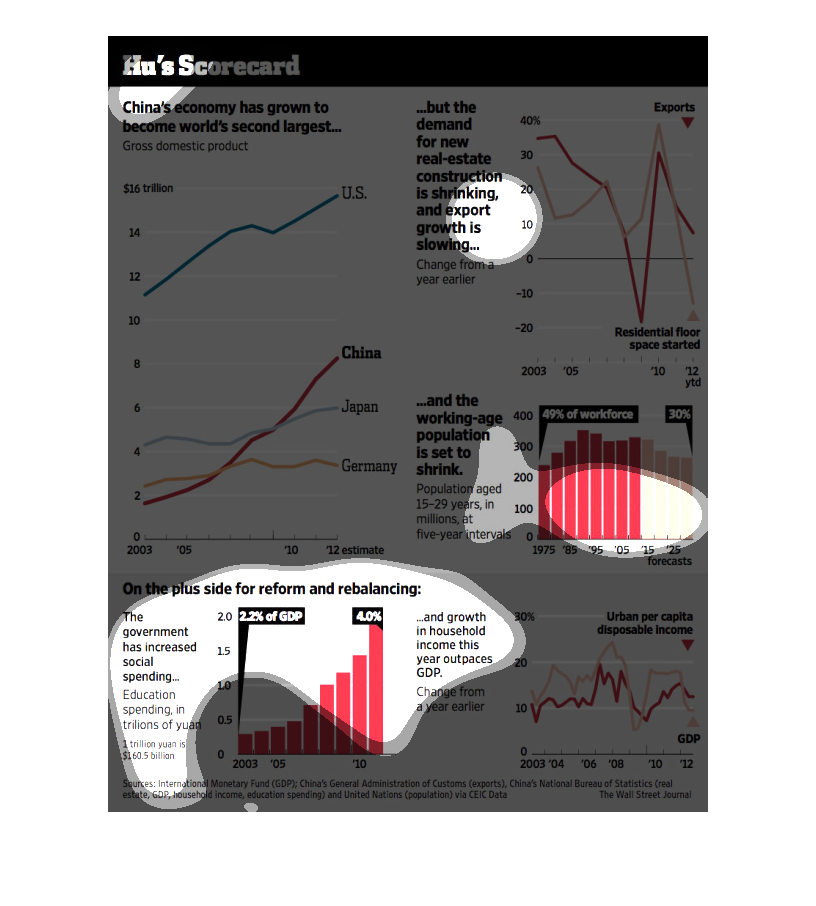
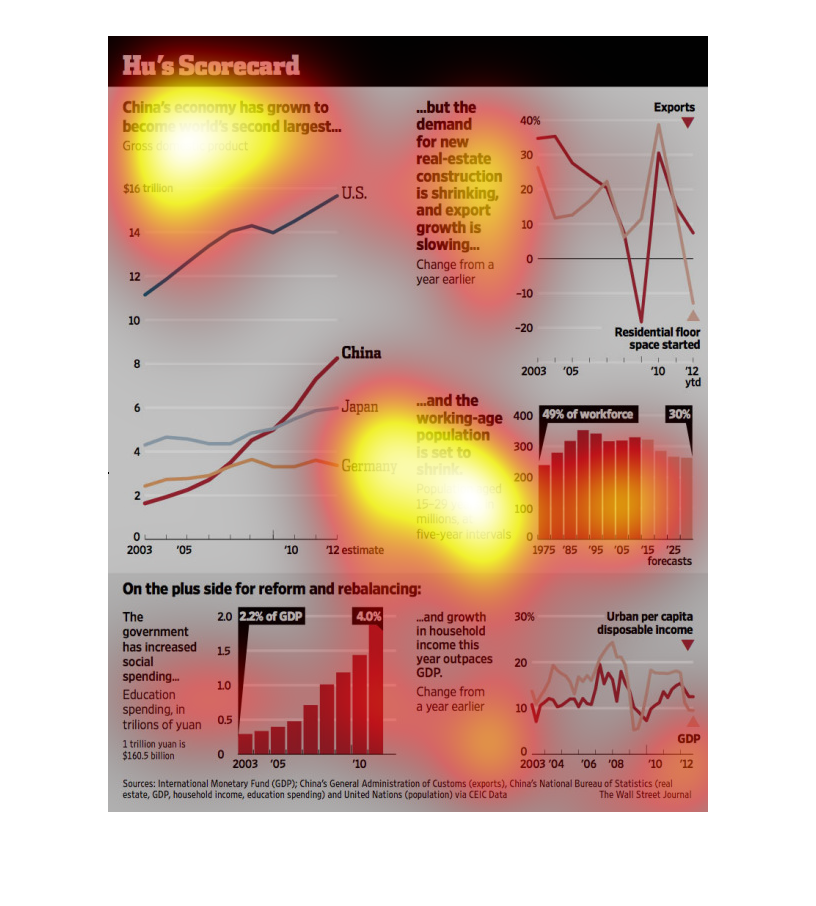
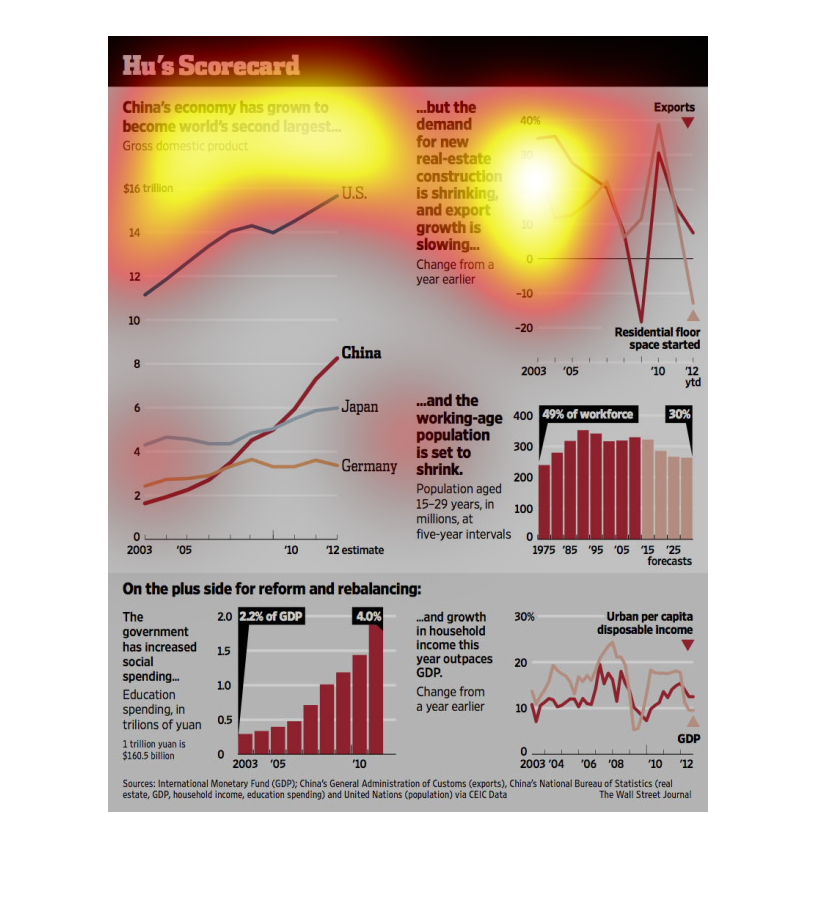
This image is about the Hu's Scorecard. It details about working age population in China.
It also discusses about how the reform could be done to improve and rebalance the situation,
as the working age population and the exports and shrinking.
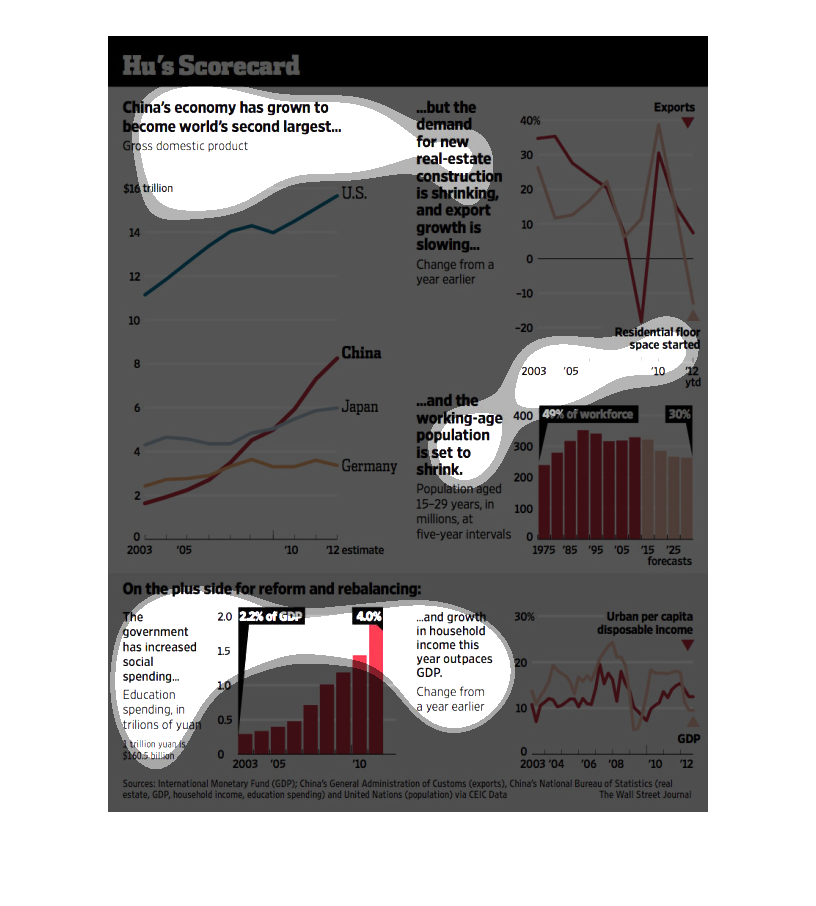
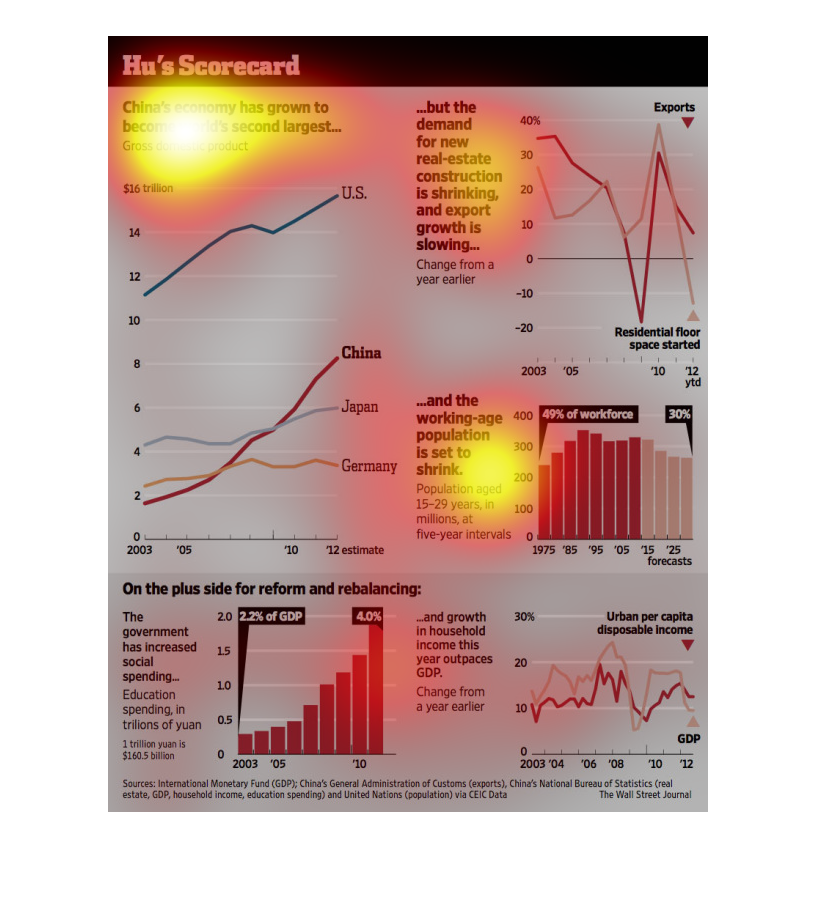
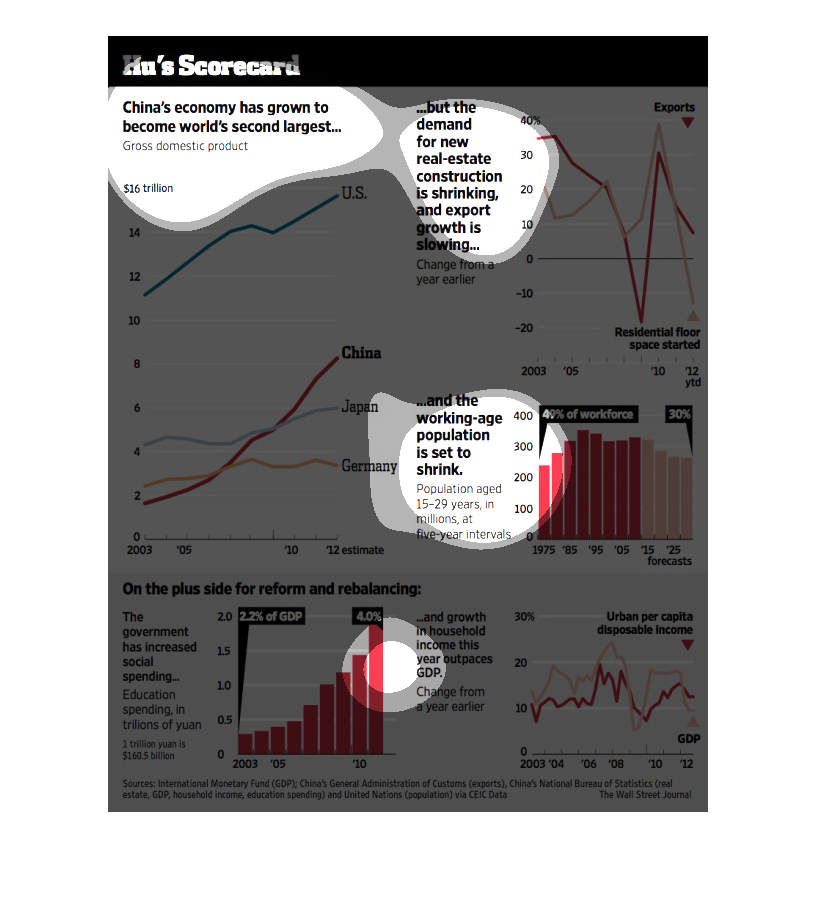
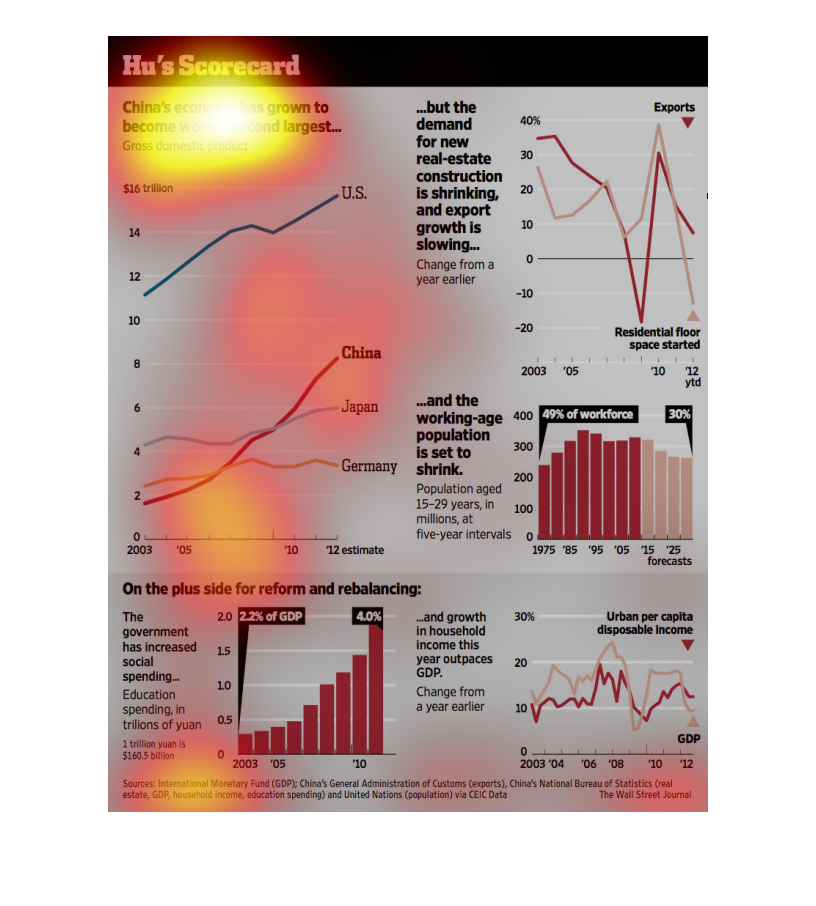
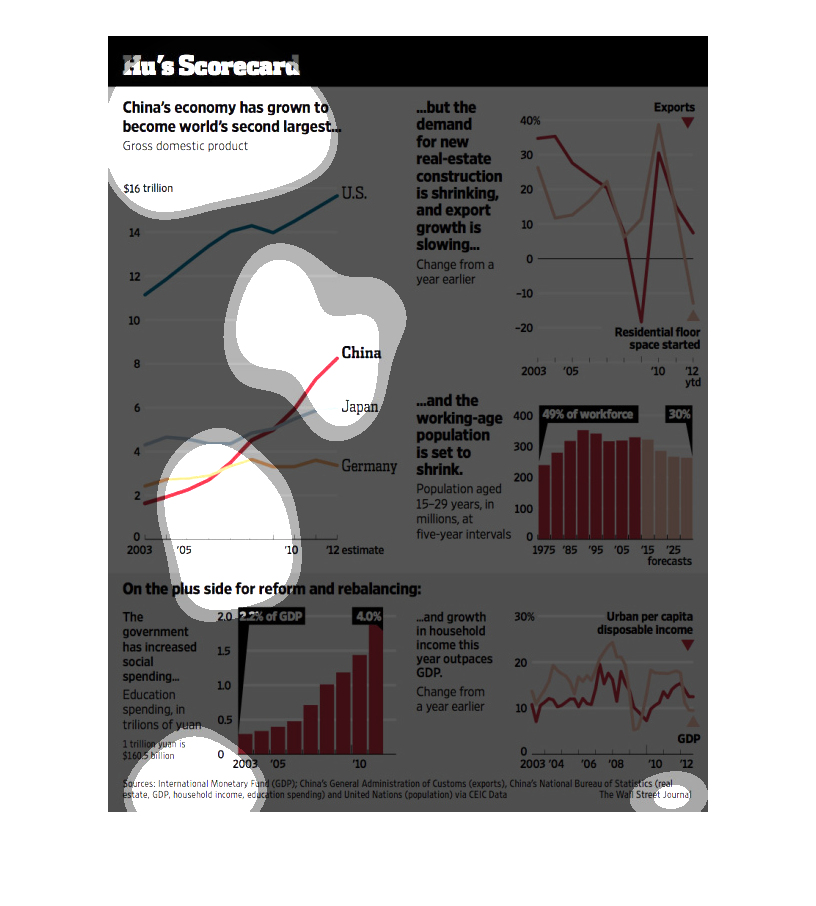
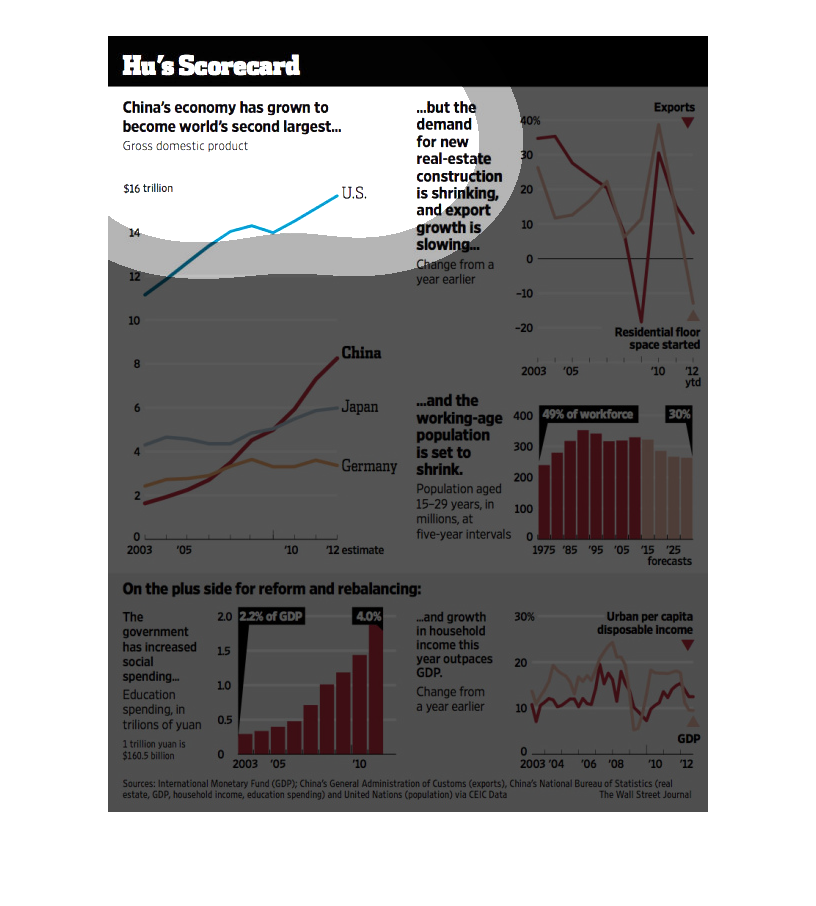
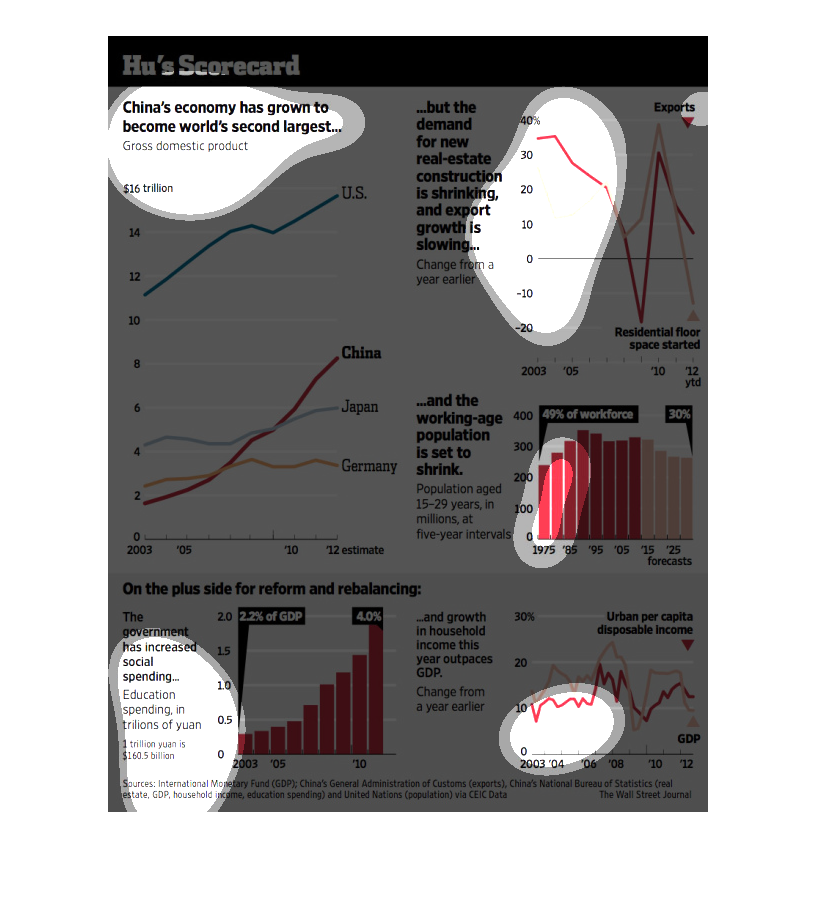
The caption for this image is, "Hu's Scorecard, China's economy has grown to become worlds
second largest".  There are five different graphs that make up this image.  The graphs display
data on government spending for education, real estate construction, age and population of
it's workforce, and household income.
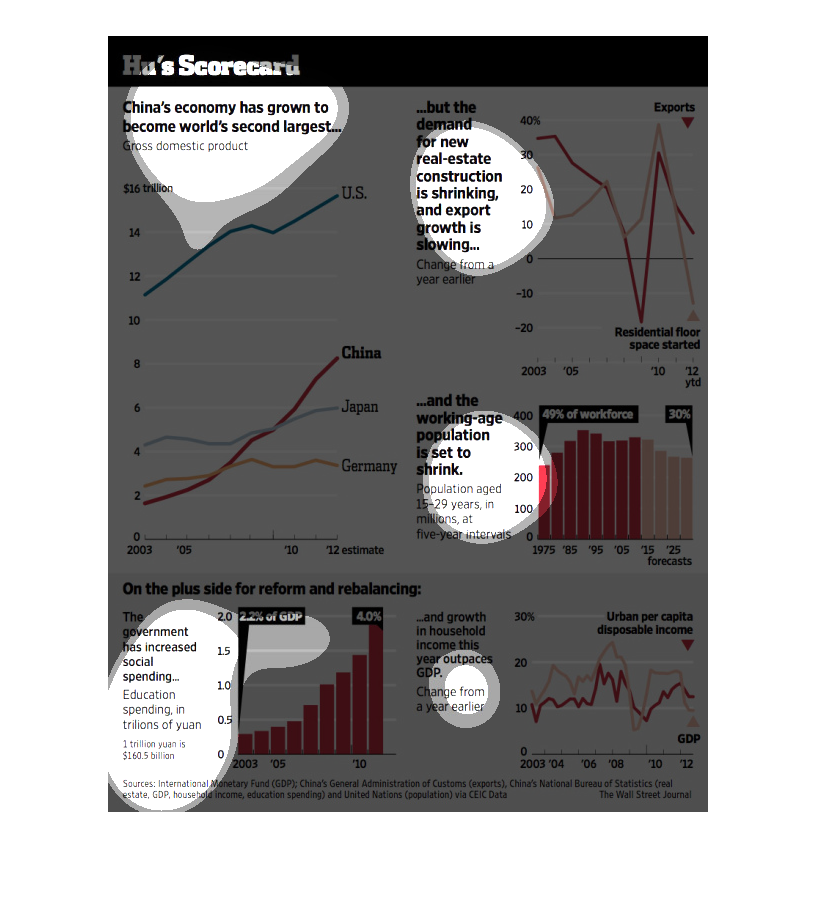
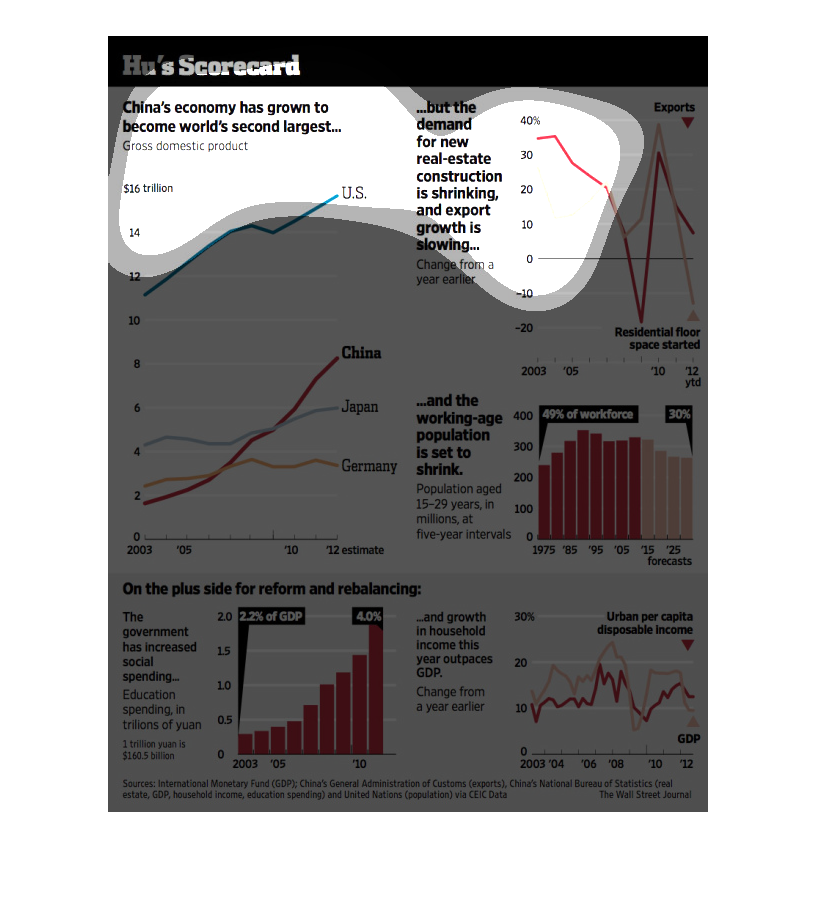
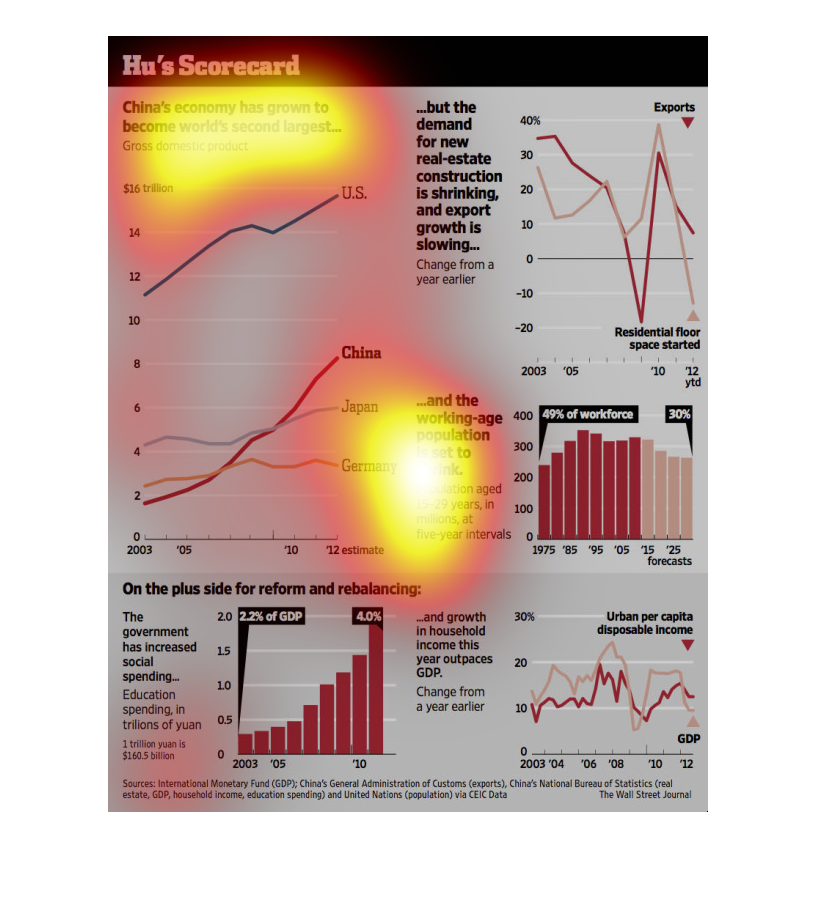
This image is entitled "Hu's Scorecard."  It shows how China's economy has grown to become
the second largest but the demand for new real estate construction is shrinking and export
growth is slowing. Concern is great because the working age population is set to shrink.
Various graph charts are shown to illustrate the expected changes in the economy.
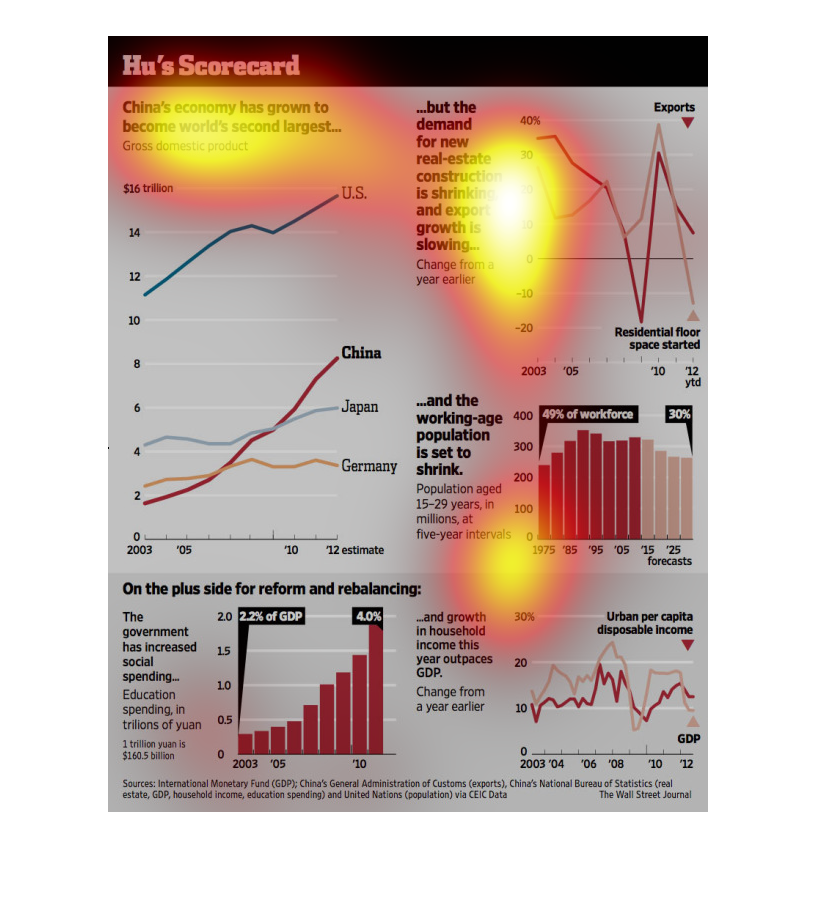
In this study conducted by the Wall Street Journal- from information obtained from the International
Monetary Fund- we see the steps China has taken to become the second largest economy in the
world.
The image depicts how China's economy has grown to become the worlds second largest. Rising
GDP, rising exports are positive, with minor negatives like a shrinking working-age population.
The title of the graphic is Hu's scorecard. It says that China's economy has grown to become
the world's second largest economy, behind on the United States.
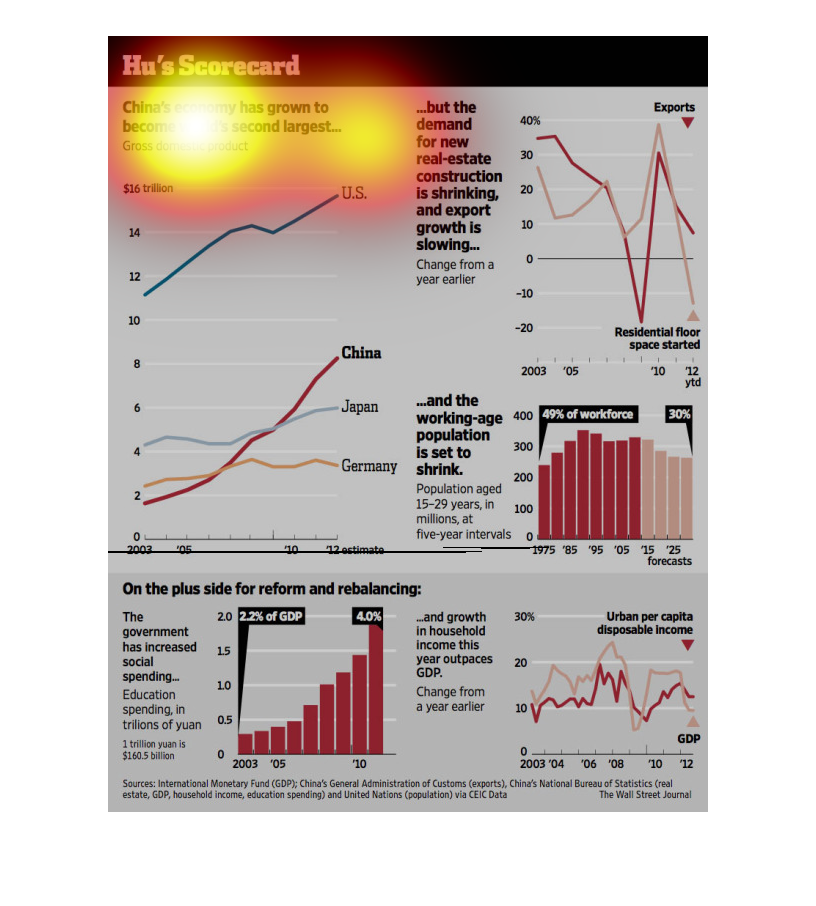
The image shows many graphs that pertain to china's economy and tells how china has grown
to be the second largest economy. It tells that china has increased money into social spending.
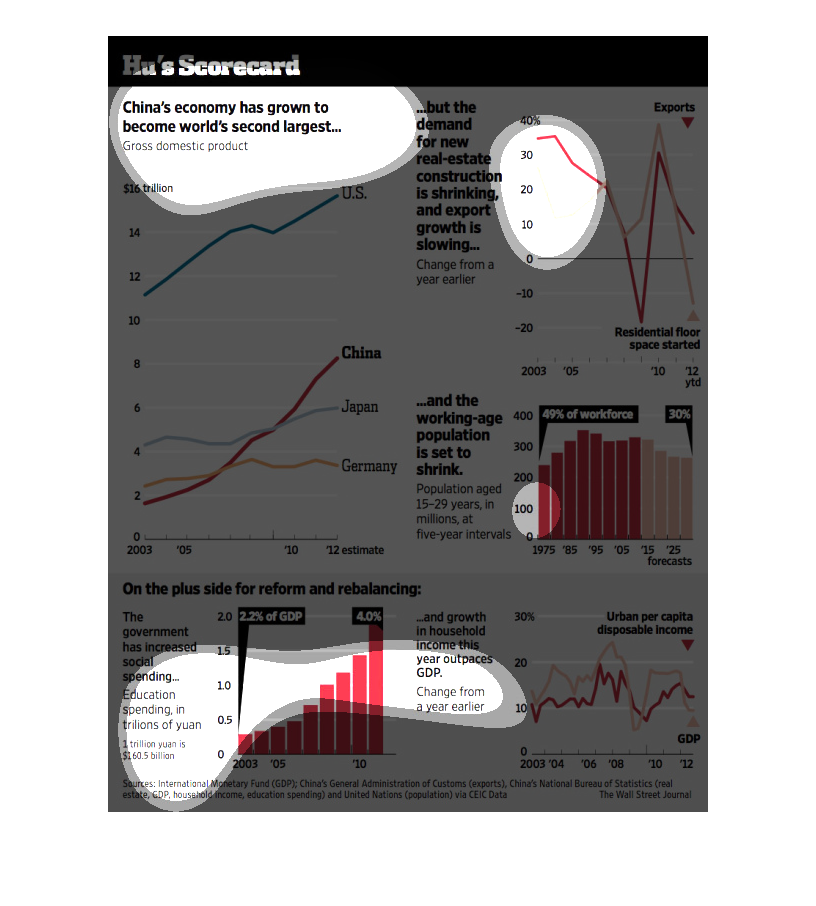
This graphic details some of the problems with China's economy. Demand for real estate and
exports are decreasing, and the population available to work is decreasing.
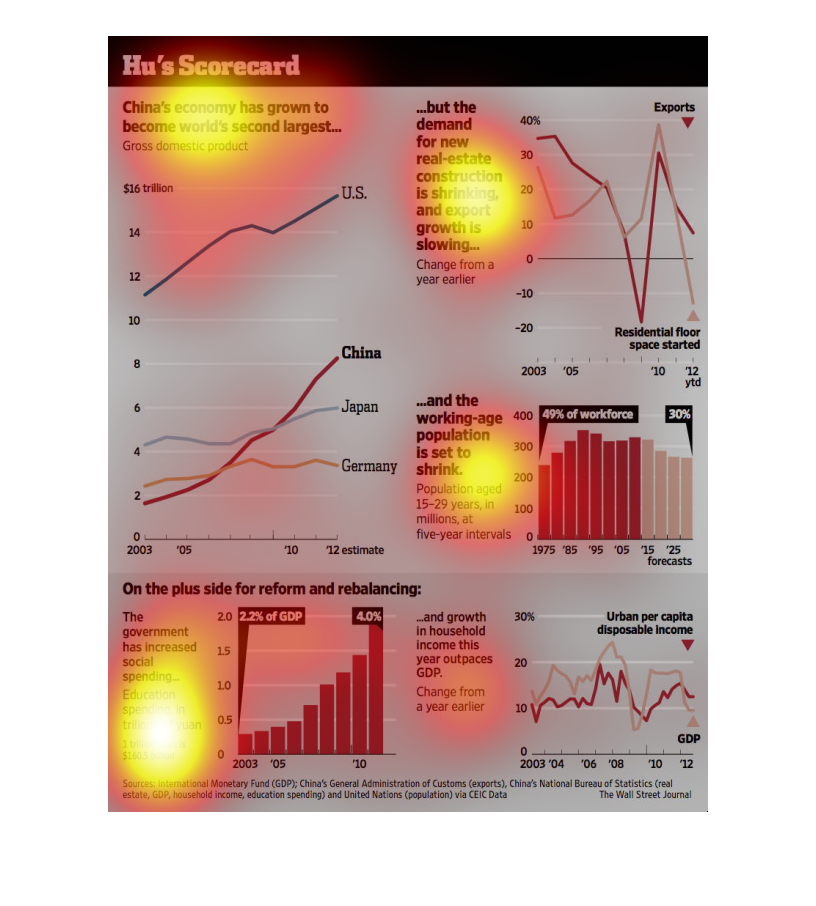
TITLE: Hu's Scorecard  China's economy has grown to become second largest...   Different graphs
and data (approx. 5). Such as a graph that indicates US economy is at $14 Trillion, China
is around $8 Trillion.  Another: demand for new real-estate construction is shrinking and
export growth is slowing (accompanying chart shows the same).
This graph is about China's economy and contains data on the GDP, real estate construction,
the working age population, education spending, and household income.
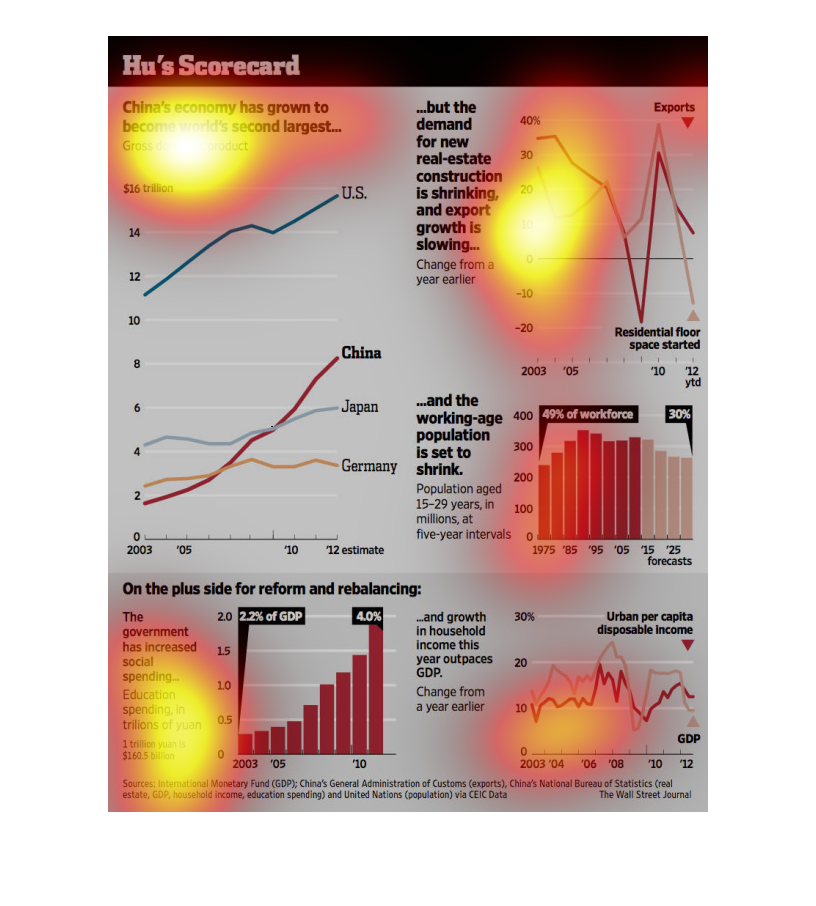
Hu's scorecard. China's economy had grown to become world's second largest followed by Japan
and Germany, United States still lead and double of what China boasts.
This chart describes Hu's scorecard. Specifically, China's economy has grown to become the
world's second largest. Different categories are represented by different colors.