The image depicts big-dividend stocks outperforming the broader market and sectors often billed
as faster-growing. Healthcare, consumer staples, utilities, and telecom services lead the
way.
This graph illustrates how large dividend stocks have outperformed the broader market in telecom
services, utilities, health care, and consumer staples.
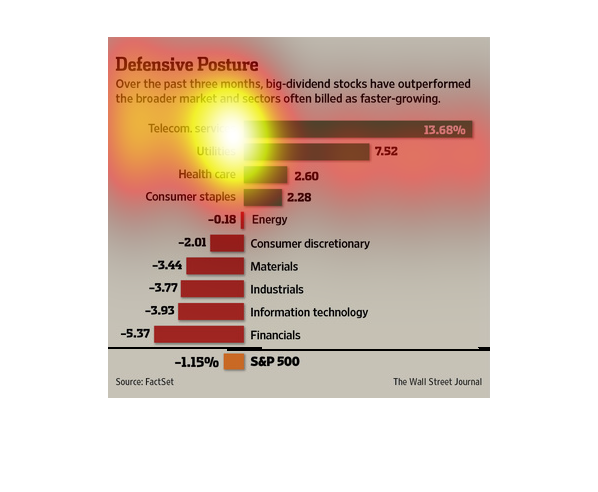
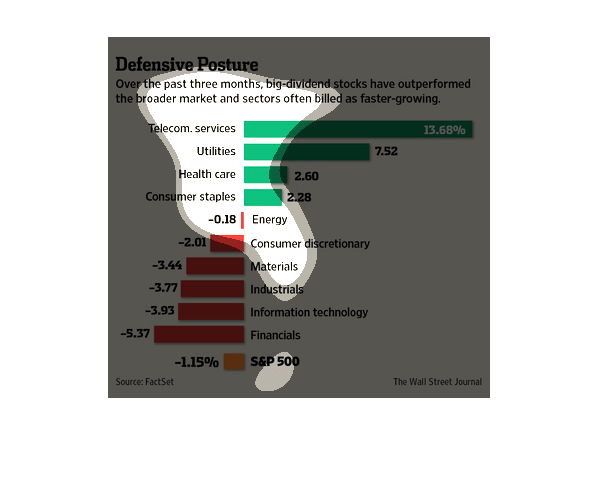
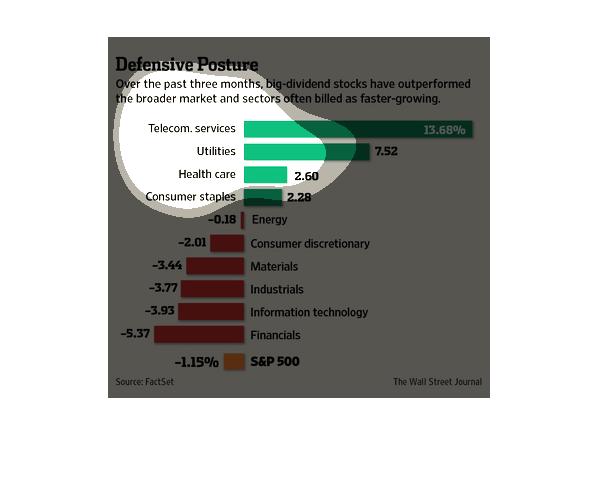
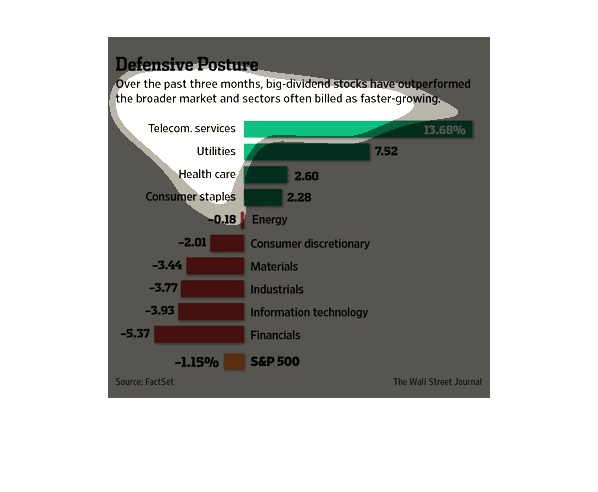
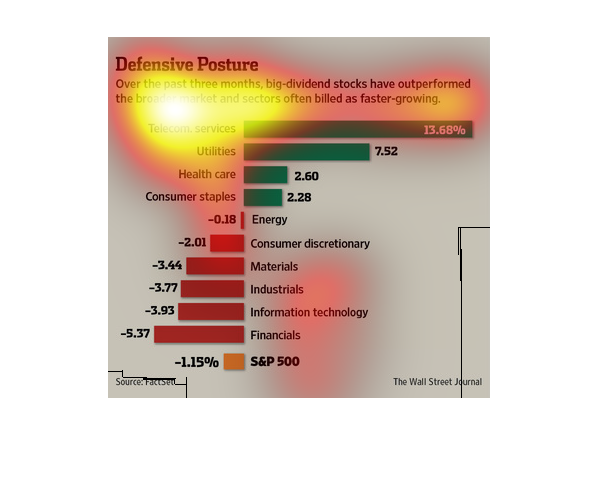
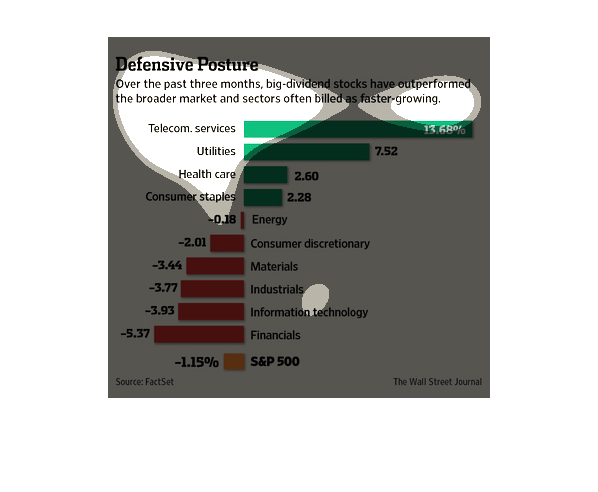
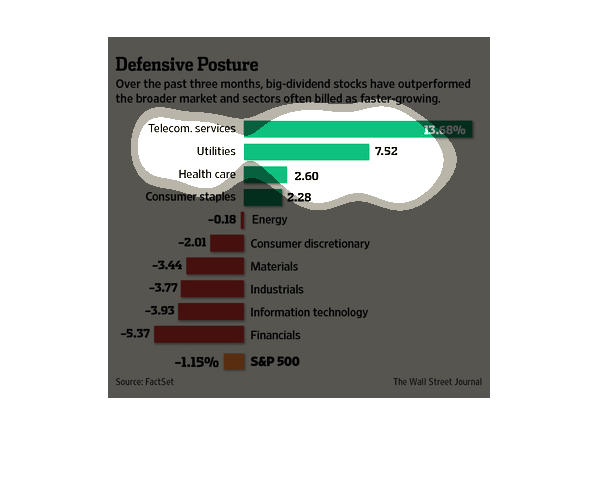
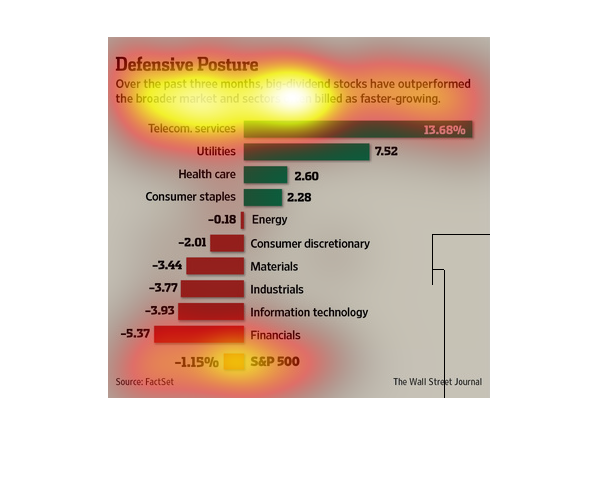
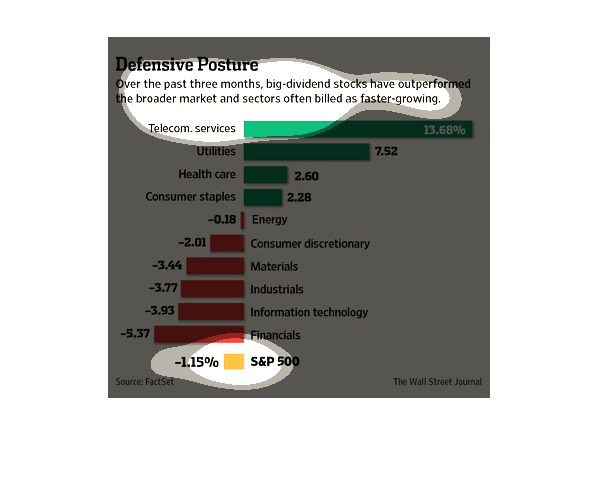
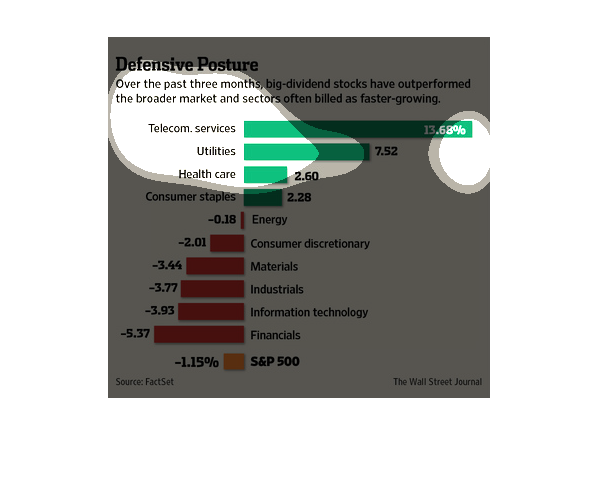
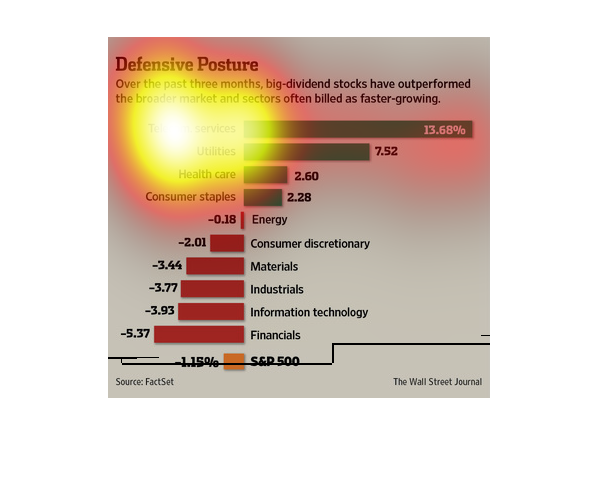
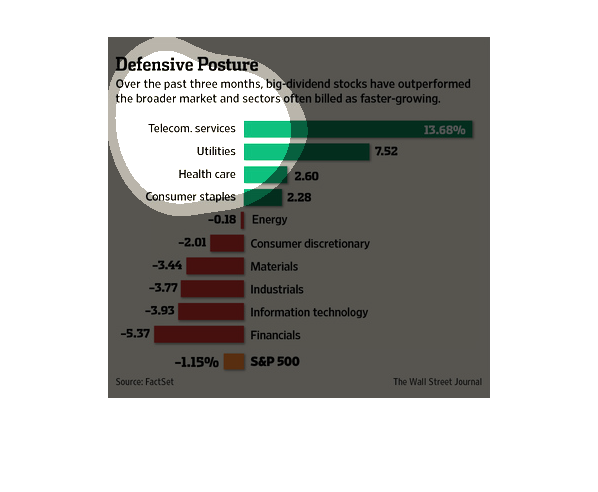
This chart describes defensive posture. Specifically, over the past three months, big dividend
stocks have outperformed the broader market and sector.
The image depicts big-dividend stocks, within the period of 3 months, outperforming the broader
market and sectors often expected to be faster-growing.
This is a chart showing "Big-dividend" stocks outperforming usually  faster growing stocks.
On the top of the chart it shows Telecom at 13.68% growth and on the bottom the S&P 500 at
-1.15%.
This is a chart having to do with stock markets and other aspects. It shows that some of the
companies are growing while there is another chart showing decrease in percentages.
In this study conducted by the Wall Street Journal- its source coming from Factset- we see
the even flow of funds throughout broader markets that have seen an increase in activity.
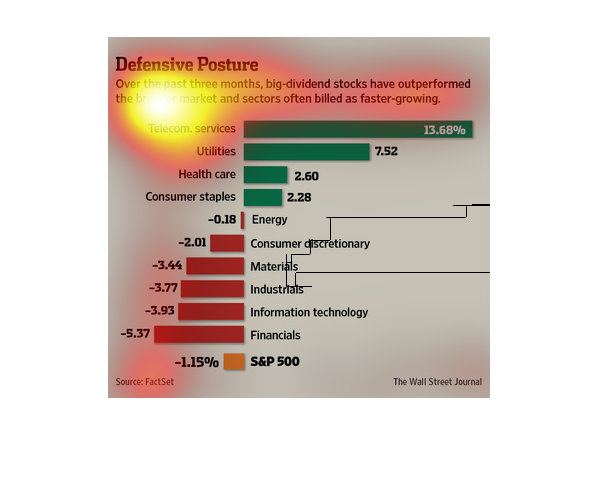
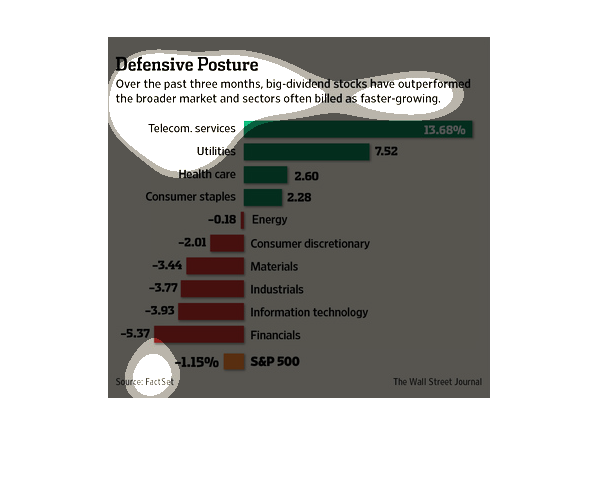
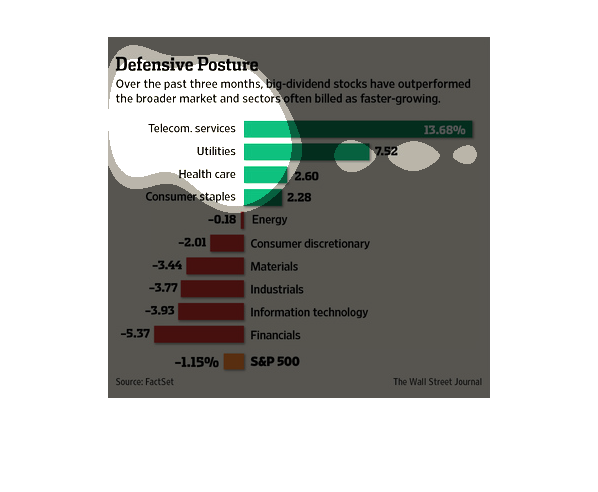
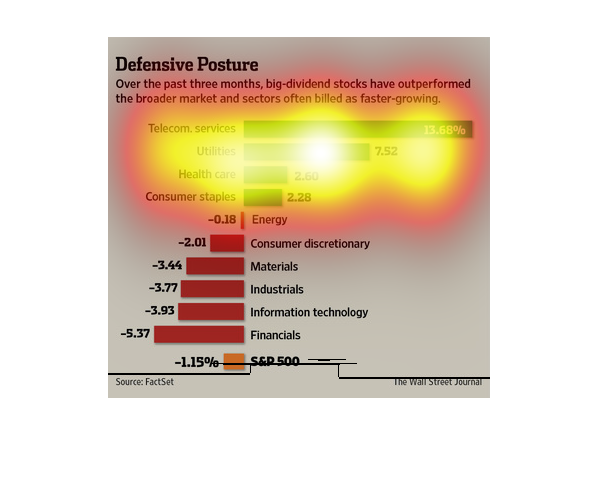
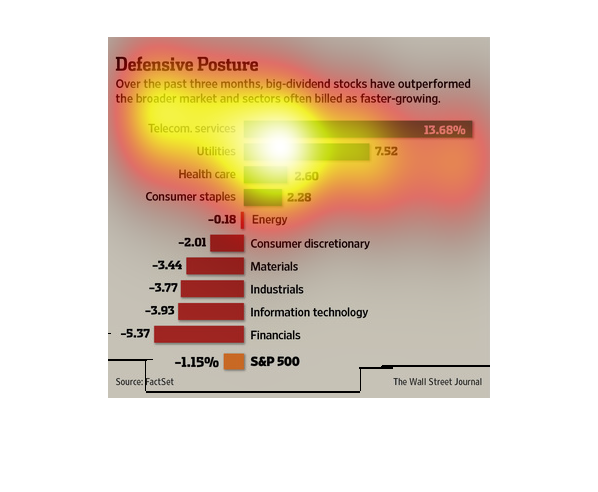
This graph is titled "Defensive Posture."  It illustrates the fact that big-dividend stocks
have outperformed the broader market.  The green bars show how much more big-dividend have
performed.  The red bars show how much of a loss has been experienced in other areas of the
market.
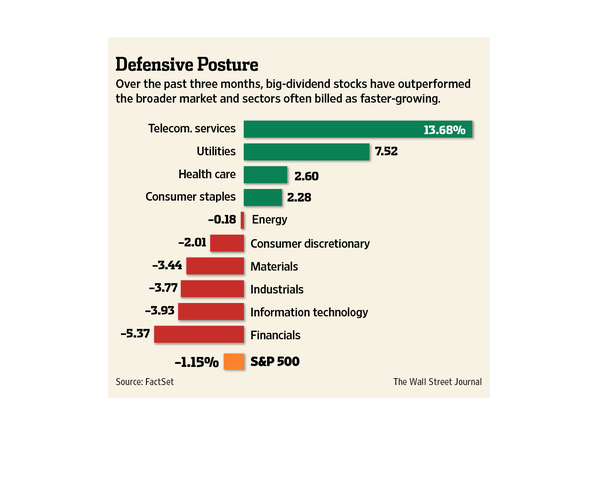
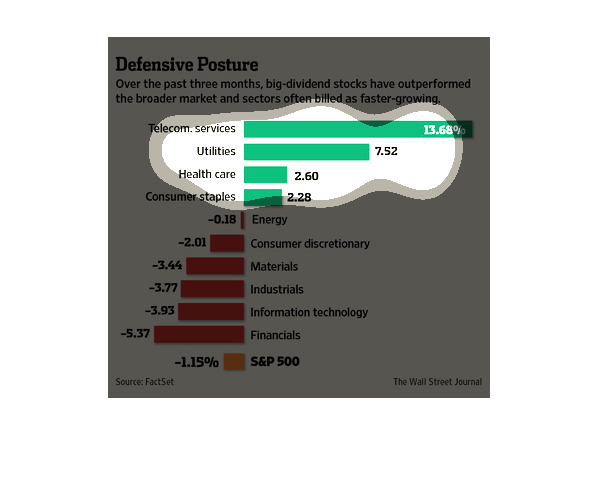
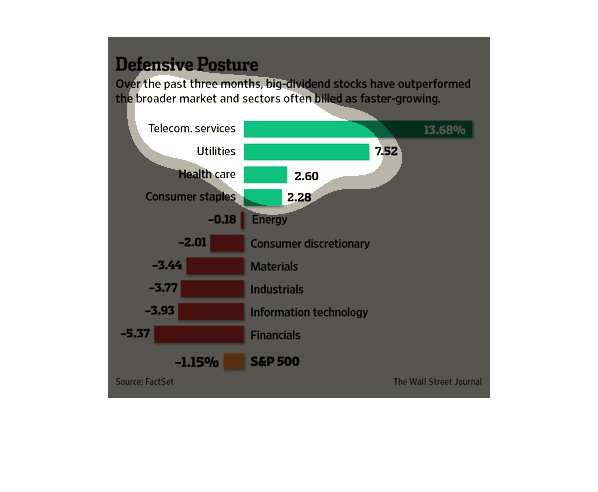
This is a series of color coded bar graphs and related statistics depicting that big dividend
stocks had outperformed the broader market and sectors usually considered faster growing.
This chart shows how big dividend stocks are outperforming the broader market sectors.  Telecom
services and utilities top the list for highest performance rates.
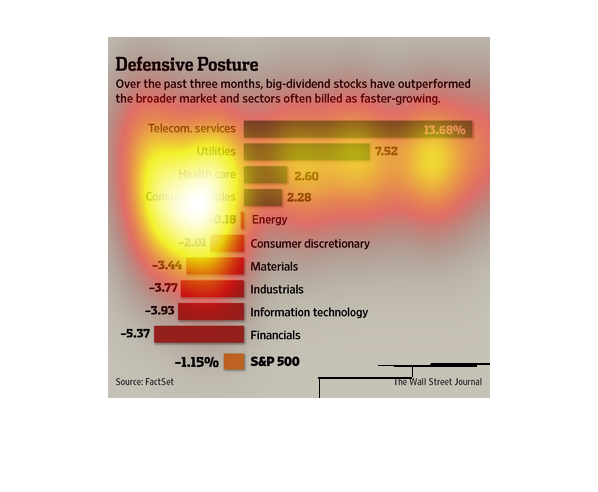
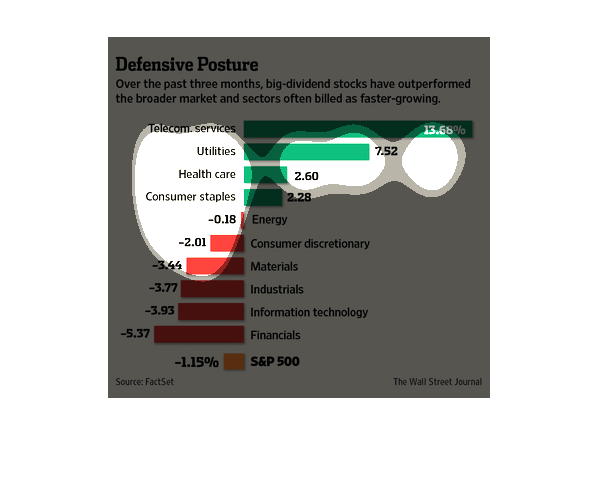
This chart shows the performance of various stock market categories during the last three
months.  The telecom and service category had the best performance with 13.8% growth, while
the financial category had a -5.37% growth rate.
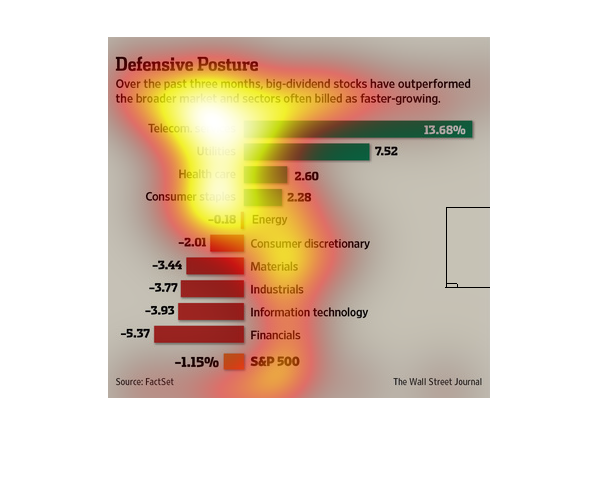
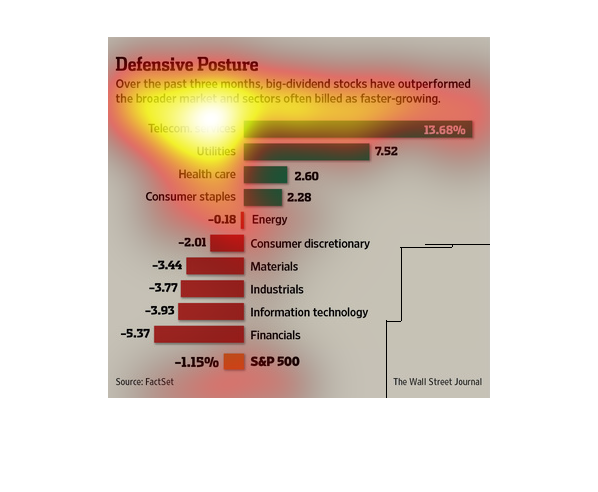
The title of this graph is defensive posture. It says that over the past three months, big
dividend stocks have outperformed the broader markets and sectors often billed as faster growing.
This chart from the Wall Street Journal shows how big dividend stocks in the United States
have had better returns than non dividend stocks in the S&P 500
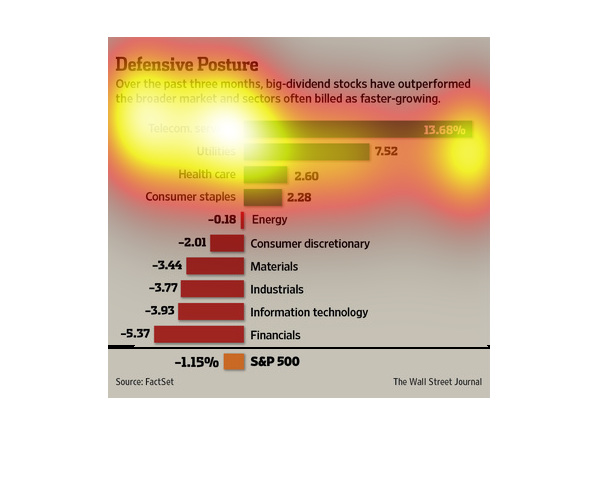
This chart describes defensive posture . Specifically, over the past three months big dividend
stocks have outperformed the broader market. Different categories are represented by different
colors.
This chart from the Wall Street Journal shows how big dividend stocks in the United States
have outperformed their peers that pay little in dividends