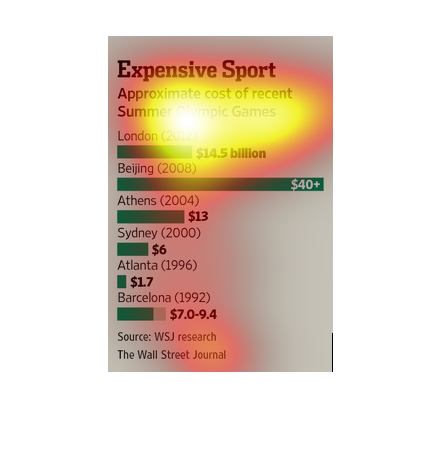
The image depicts the approximate cost of the recent Summer Olympic Games. China has, by far,
the largest budget for their Olympics, racking up 40+ million dollars for the 2008 Olympic
Games.
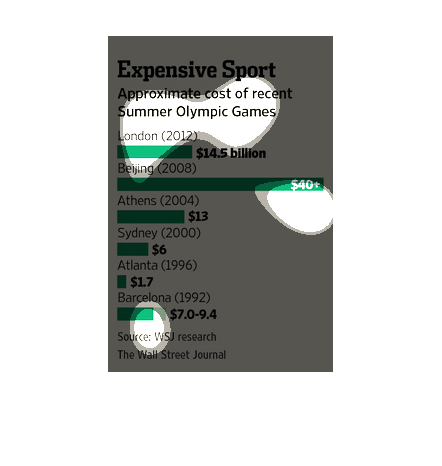
The image depicts the approximate cost of recent Summer Olympic Games. The 2008 Chinese Olympic
games come in first in terms of most expensive cost, with 40+ billion dollars spent. Atlanta
had the least expensive games with 1.7 billion.
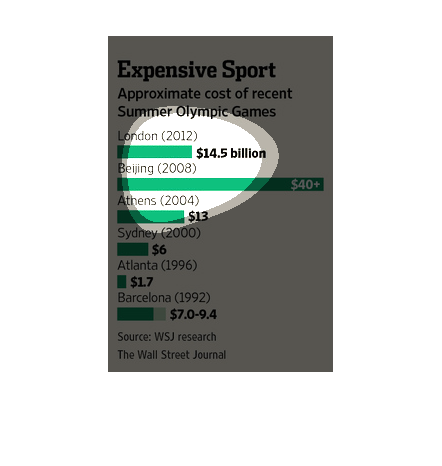
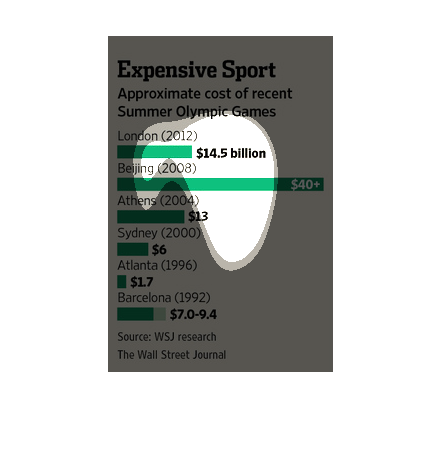
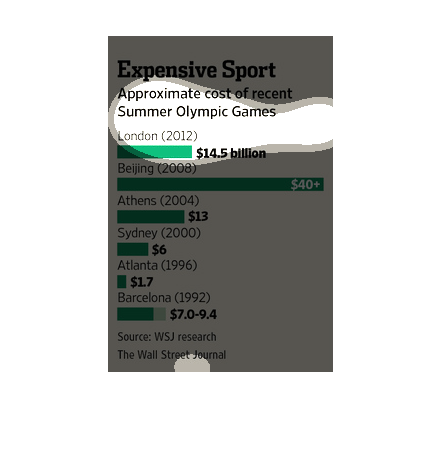
The chart is showing the costs incurred by 6 cities to host the summer Olympic games from
the year 1992 through 2012. Atlanta spent the least, $1.7 billion in 1996, while Beijing spent
the most, $ 40+ billion in 2008.
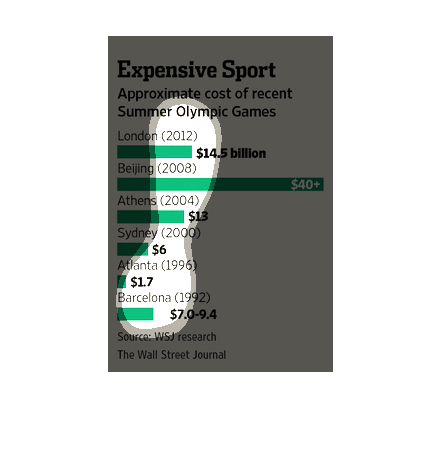
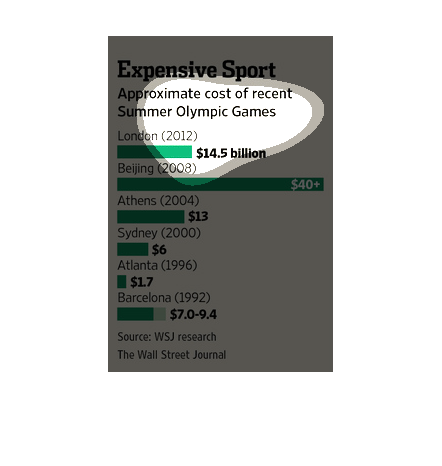
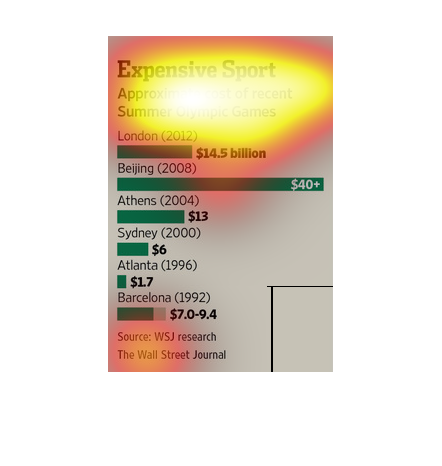
The title of the graph is expensive sport. It gives the approximate cost of the recent summer
Olympic games. The Beijing games were the most expensive.
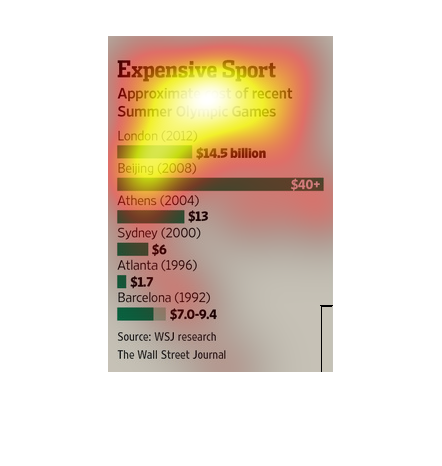
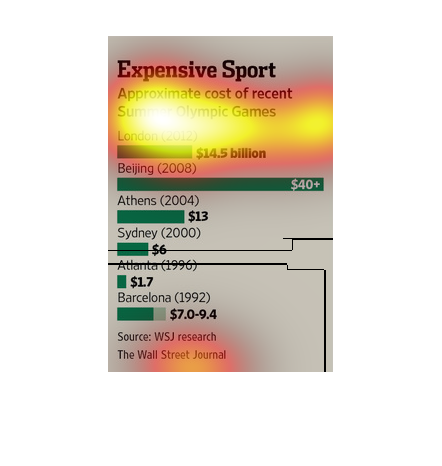
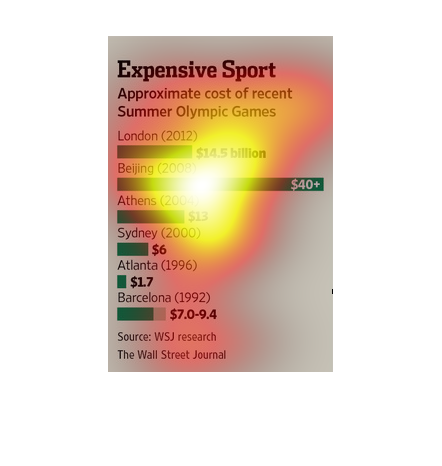
This chart describes expensive sport. Specifically, approximate cost of recent summer Olympic
games. Categories on the chart include London, and Beijing.
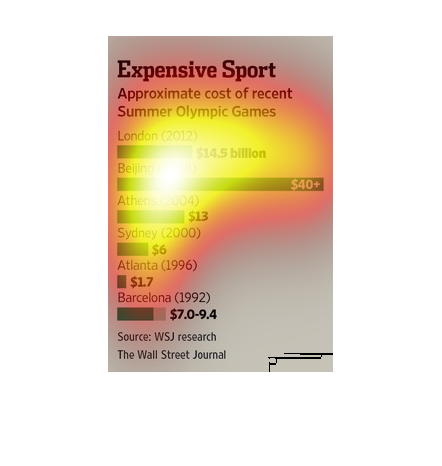
This chart from the Wall Street Journal shows how the price of hosting the summer olympics
has increased dramatically since barcelona in 1992.
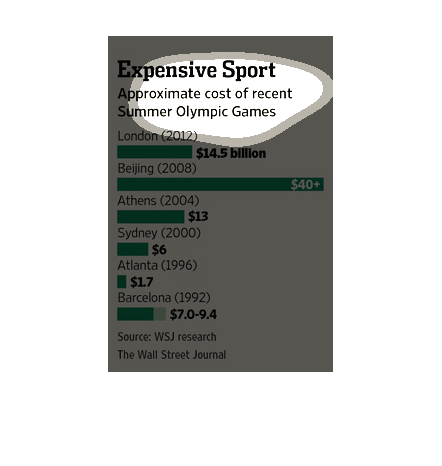
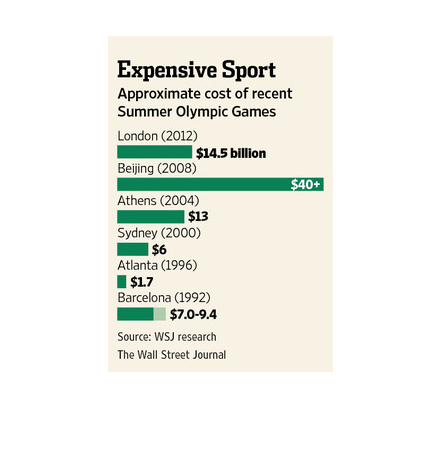
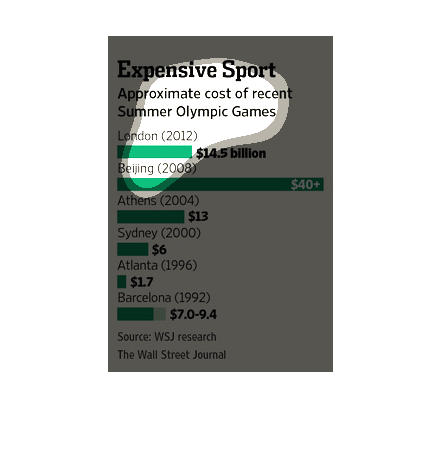
The is a chart showing the approximate cost of the Summer Olympic Games. The graph has a layout
of different cities where the game has taken place and there costs in comparison to other
countries where they have taken place.
This chart describes expensive sports . Specifically, approximate cost of recent  Summer Olympic
Games. Categories on the chart include London, and Beijing.
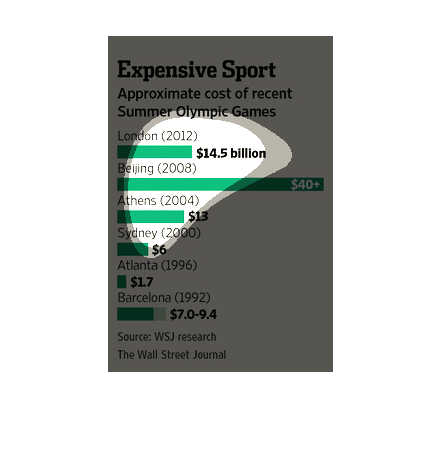
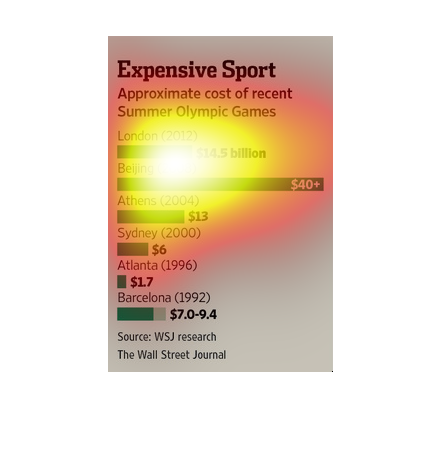
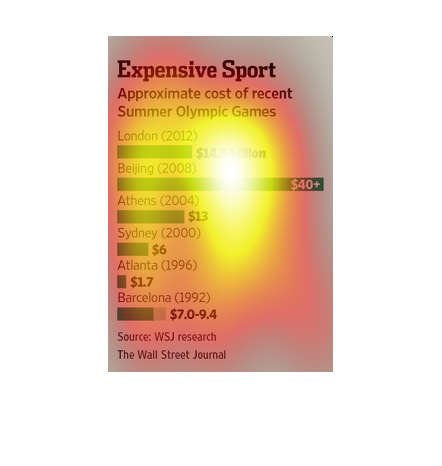
This is a series of bar graphs and related statistics depicting the approximate cost of recent
summer Olympic Games from the years 1992 through London in 2012.
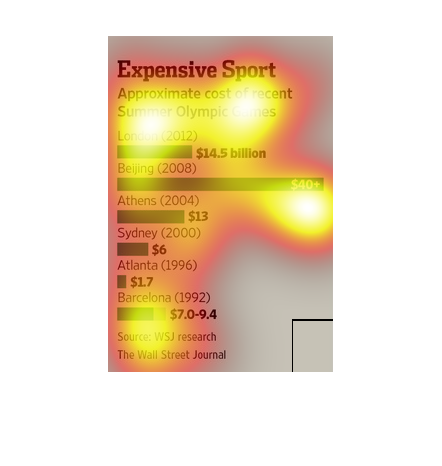
Espensive Sport | approximate cost of recent sumemr olympic games. We see an increase since
1992, peaking in Beijing 2008 olympics. 2004 and 20012 shared a similar cost o4 12/13 billion
US dollars.
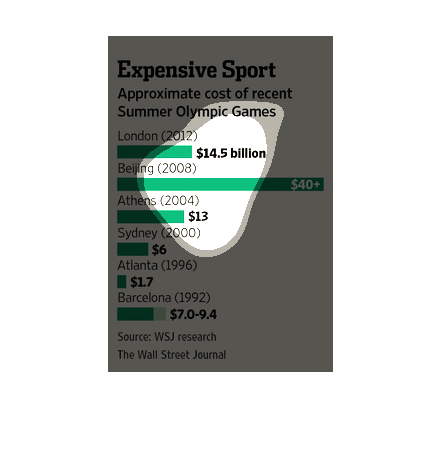
This image shows or depicts in bar graph statisical format information concerning the rising
cost over the years of games of the Summer Olympics. Years shown are 1992-2012.