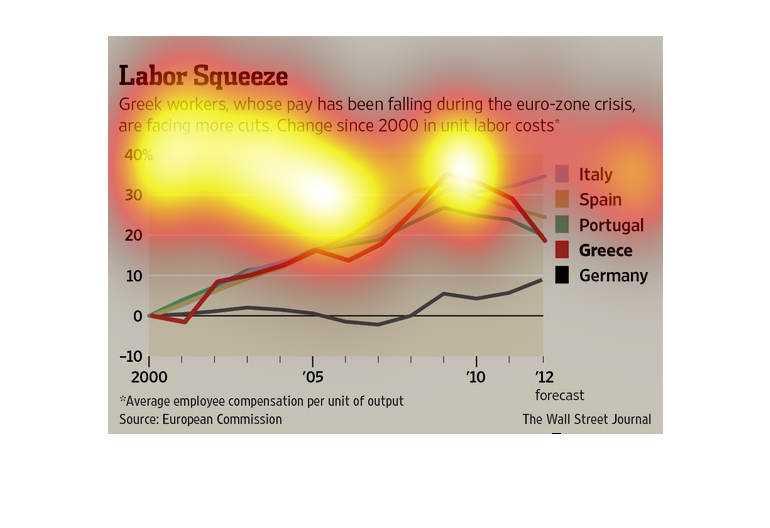
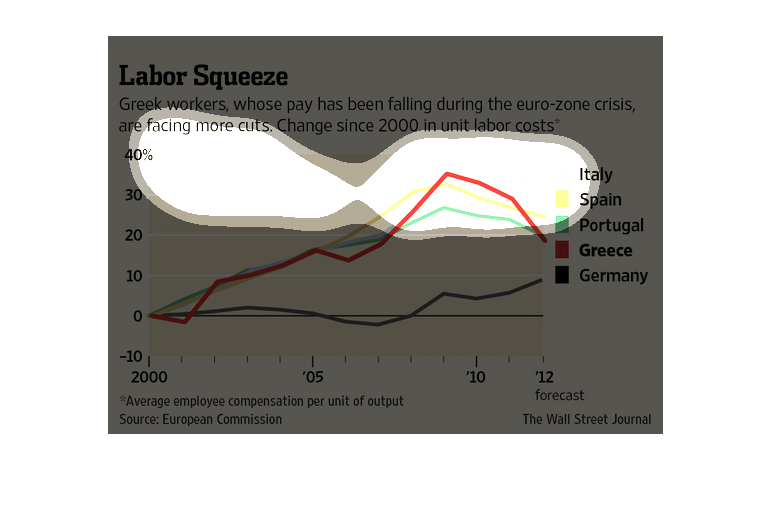
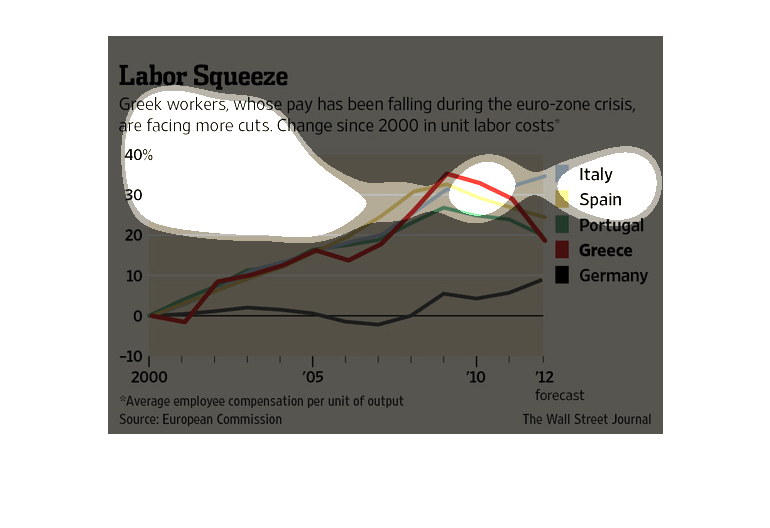
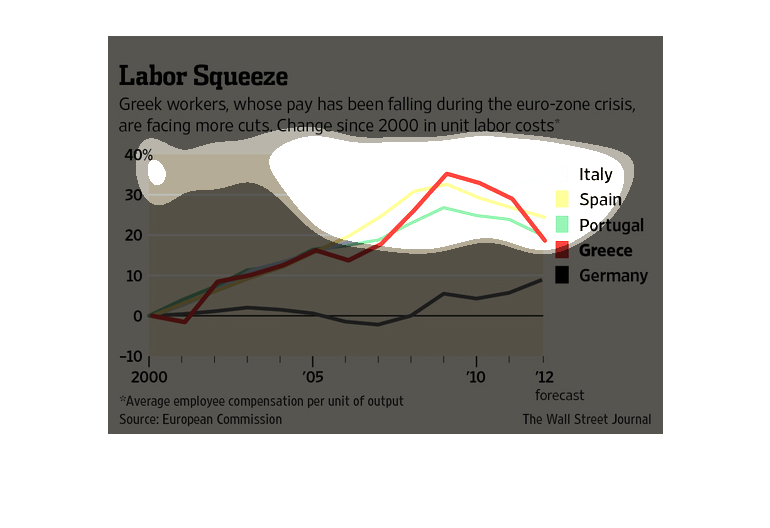
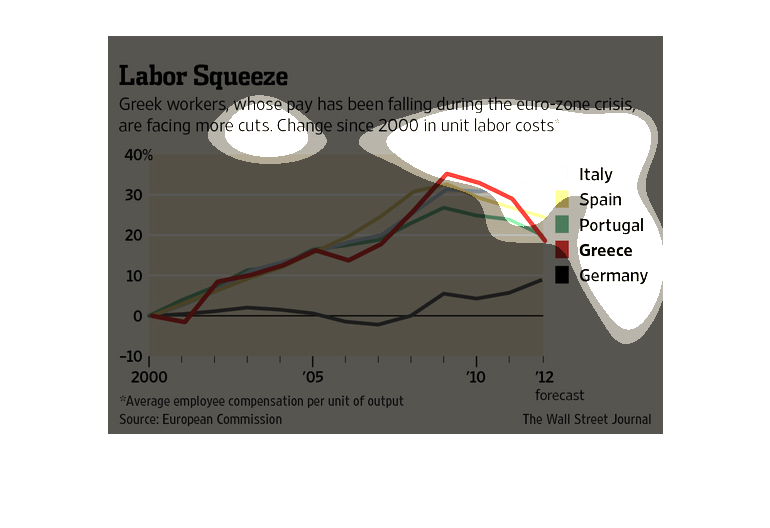
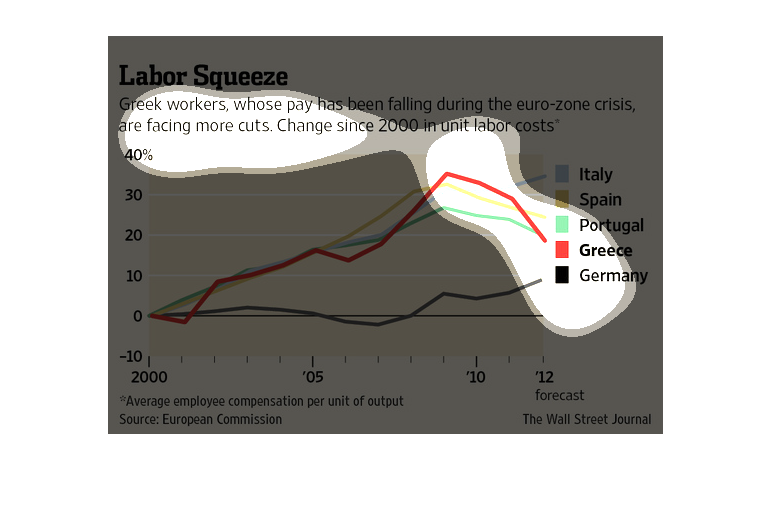
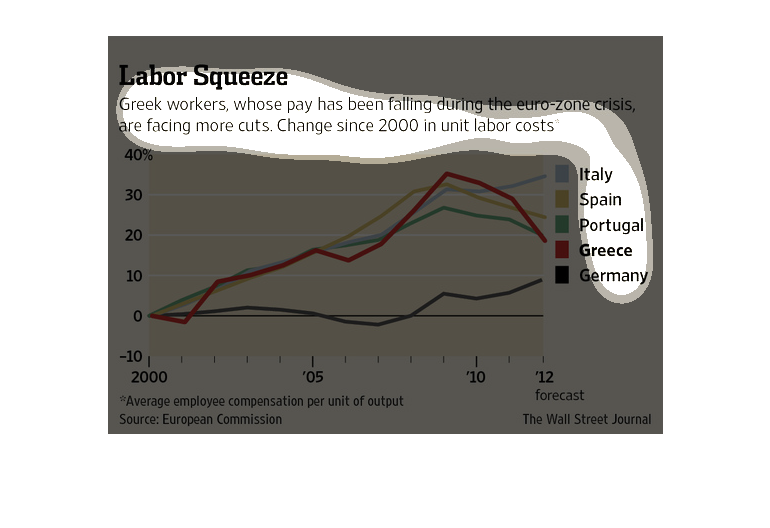
The chart shows that Greek workers' pay has fallen since 2010. Their pay change has declined
more than that in Italy, Spain, or Portugal. German workers' pay has actually increased in
the same period.
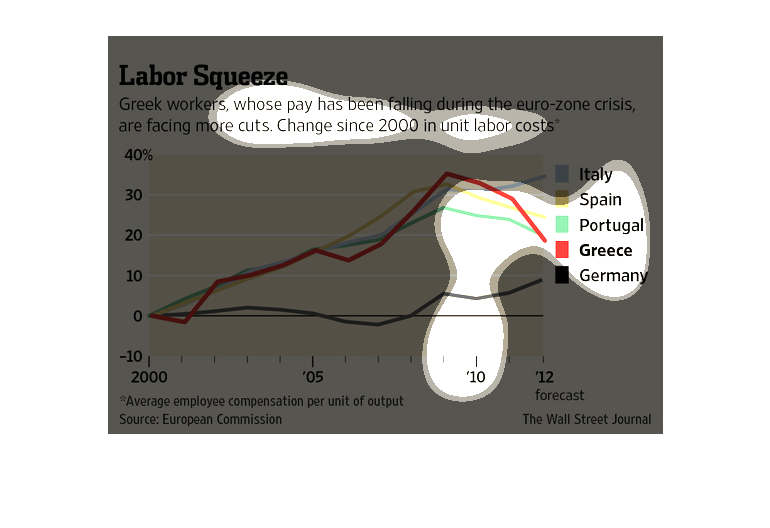
This graph details average employee compensation per unit of output in Greece,  Italy, Spain,
Portugal, and Germany as line graph comparisons to each other.
This chart describes labor squeeze. Specifically, Greek workers whose pay has been falling
during the euro  crisis, are facing more cuts. Change since 2000 in unit labor costs.
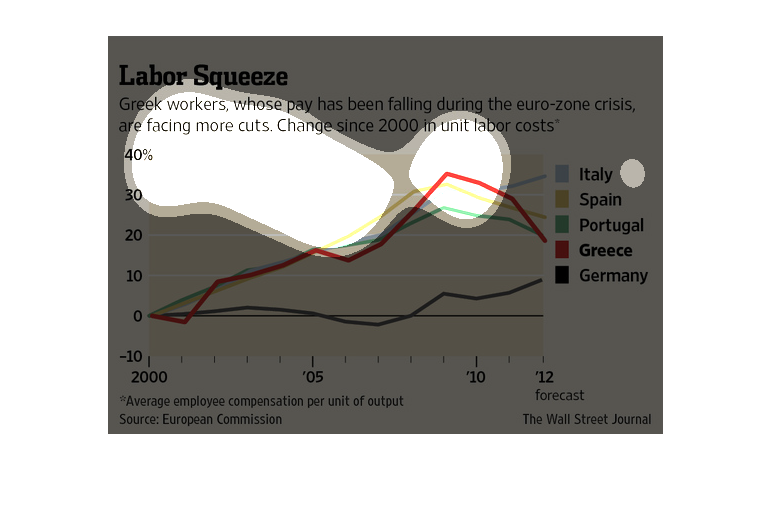
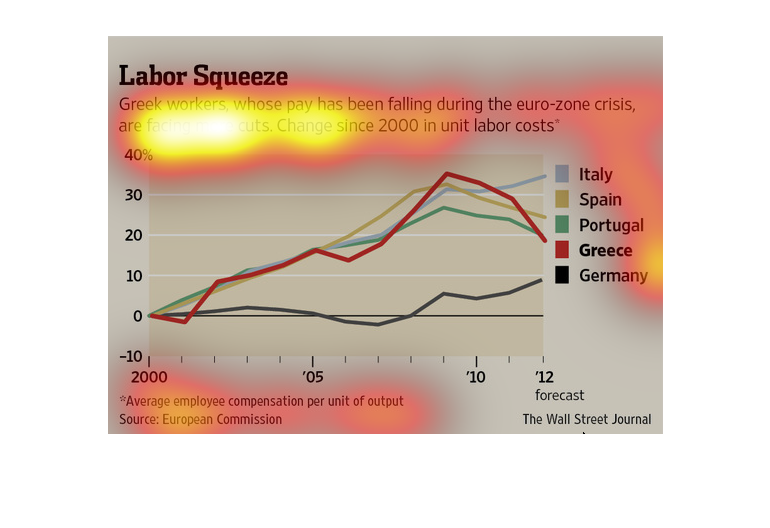
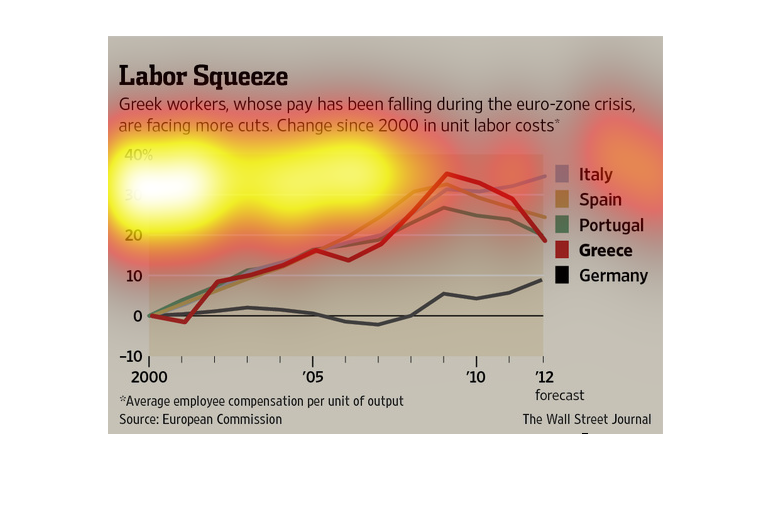
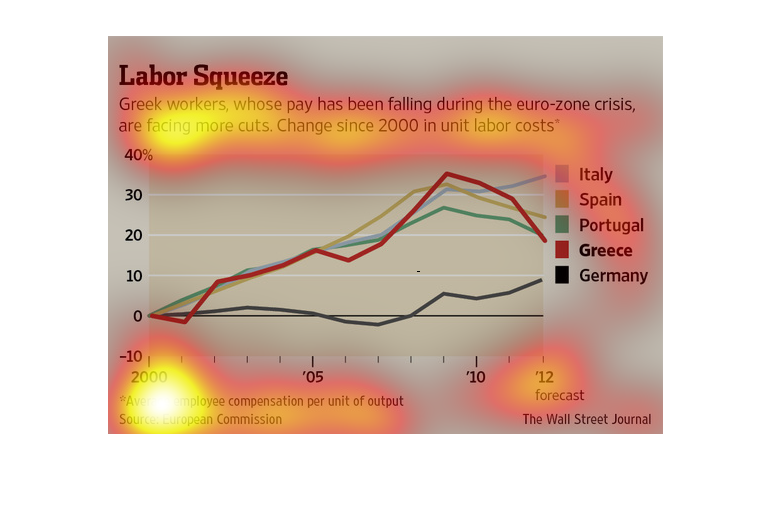
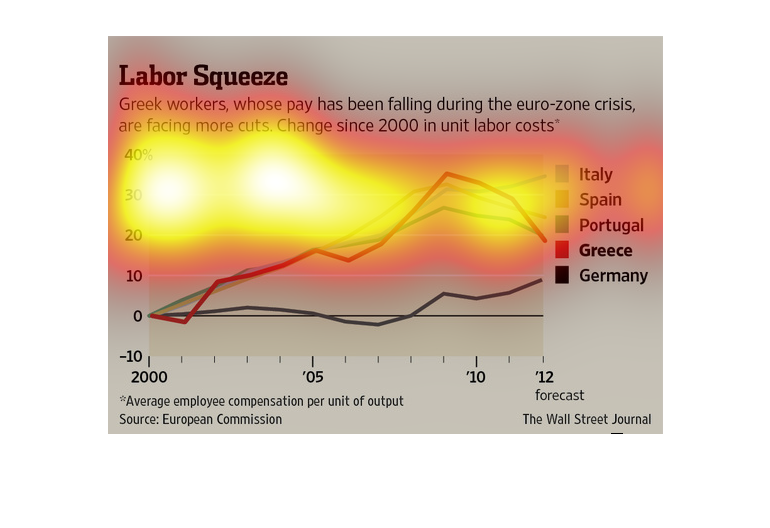
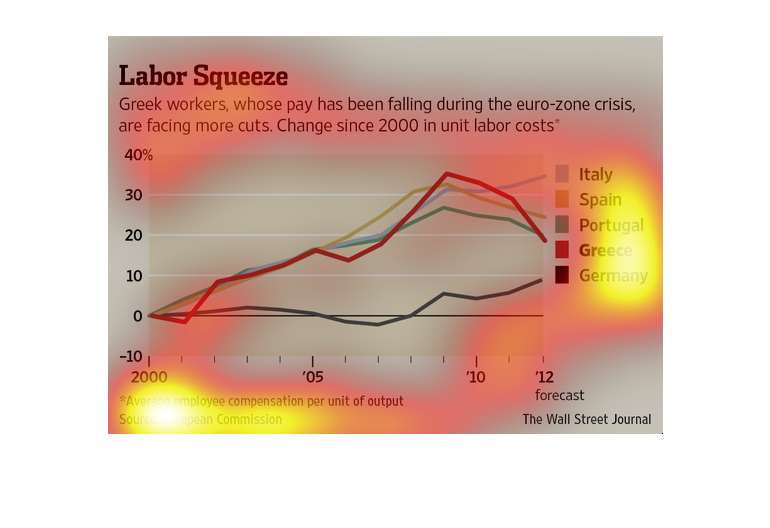
This graph shows changes in pay and the labor market for Italy, Spain, Portugal, Greece and
Germany from the year 2000 to 2012 with Greece showing the largest dip.
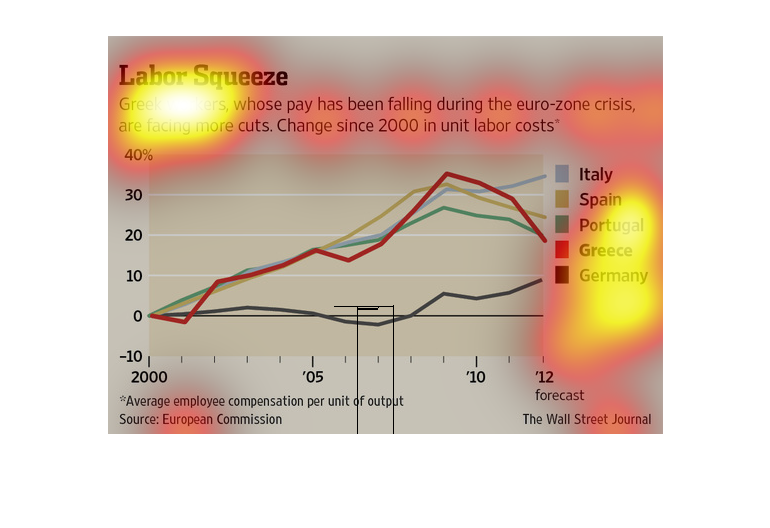
This chart from the Wall Street Journal shows how the Greek labor market is facing a squeeze
on labor income and costs of labor. It shows decreases in labor pay
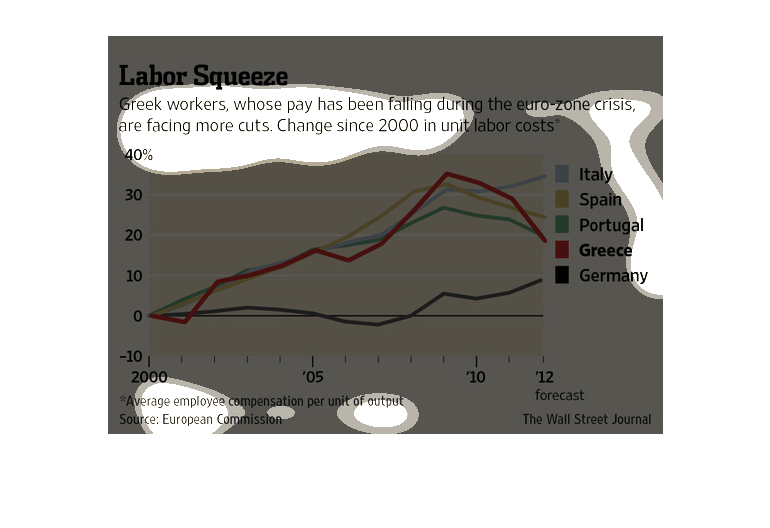
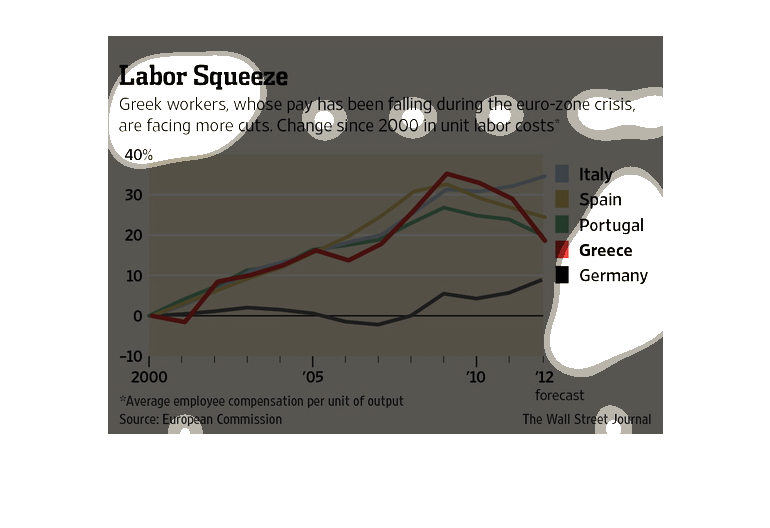
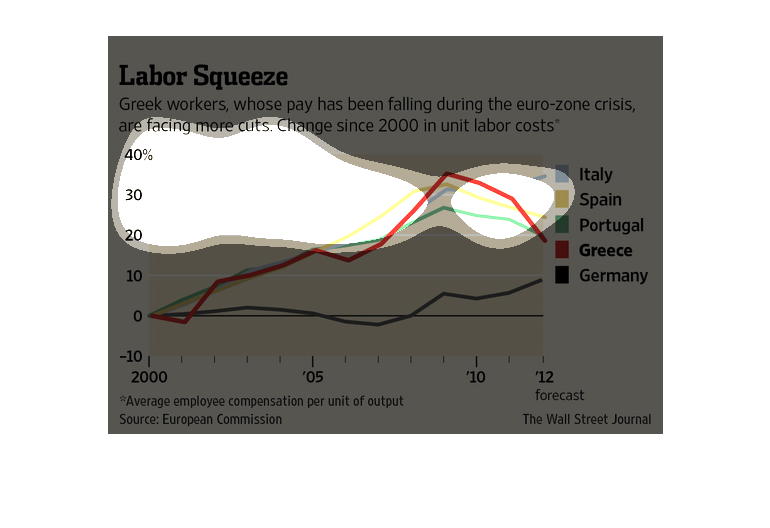
This is a series of color coded charts and related statistics depicting that Greek workers,
whose pay had been falling during the euro-zone crisis were facing more cuts.
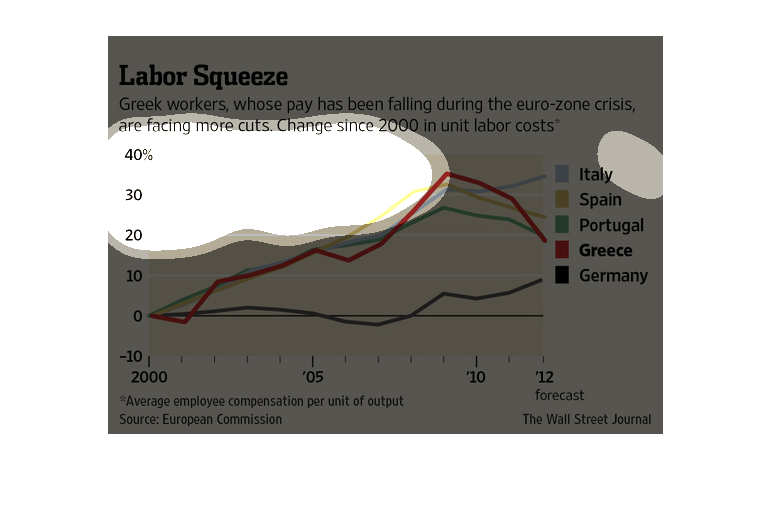
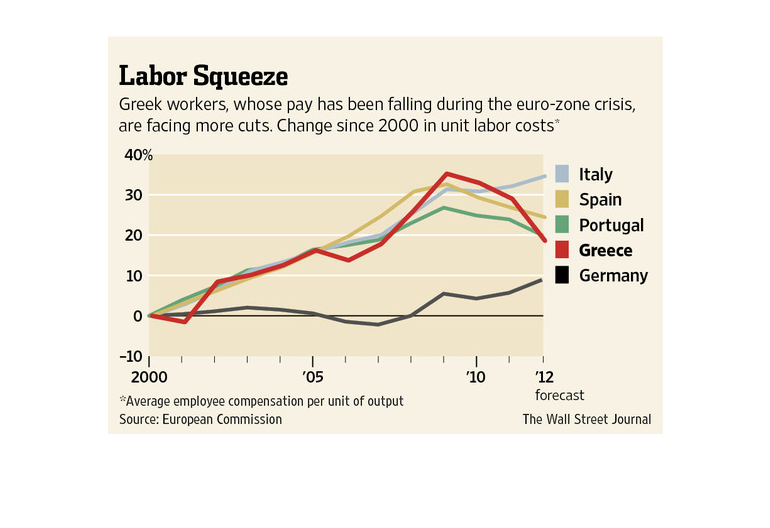
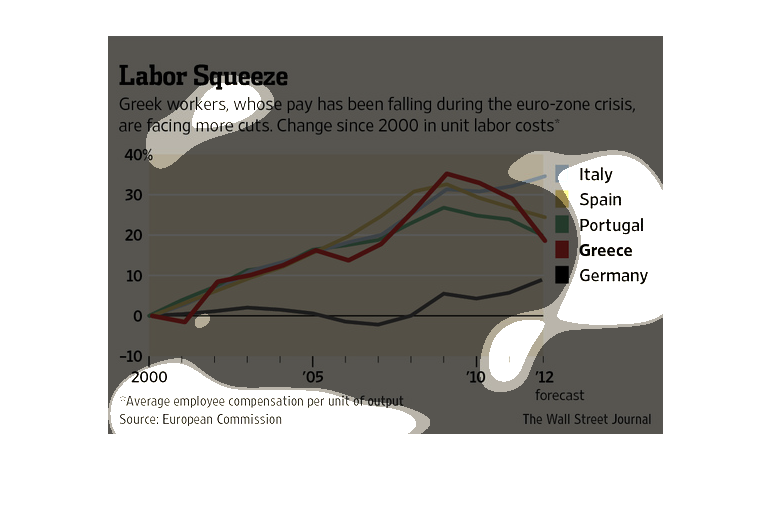
This line graph is labeled Line Squeeze. This is about the Greek workers whose pay has been
falling during the euro-zone crisis, are facing more cuts. There has been change since 2000
in unit labor cost.
In this Wall Street Journal study conducted from 2000 to 2012, we see that wages for workers
in Greece have fallen during the Euro-Zone crisis. As with other countries on this graph,
this will continue to have a huge impact on the value of the Euro going forward.
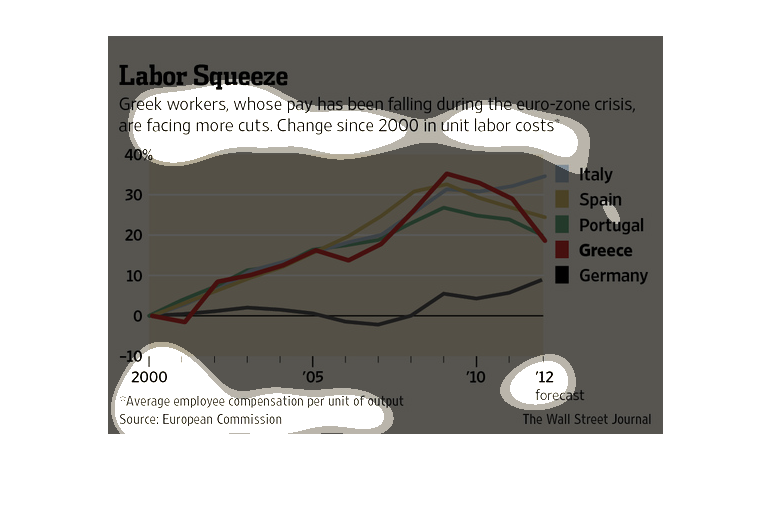
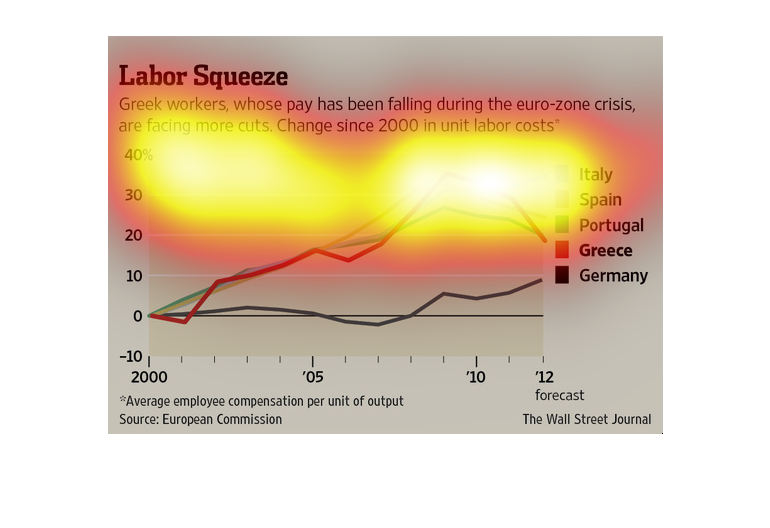
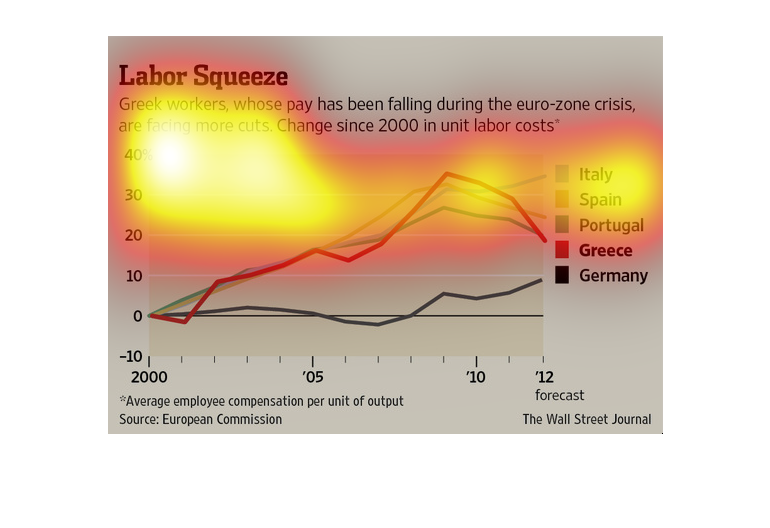
This graph shows the change in unit labor costs in several European countries. Greek workers
especially have seen falling wages due to the euro-zone crisis.
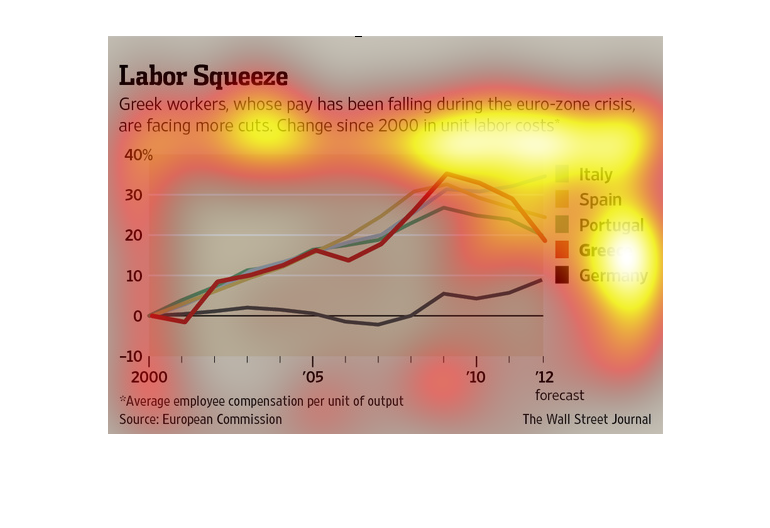
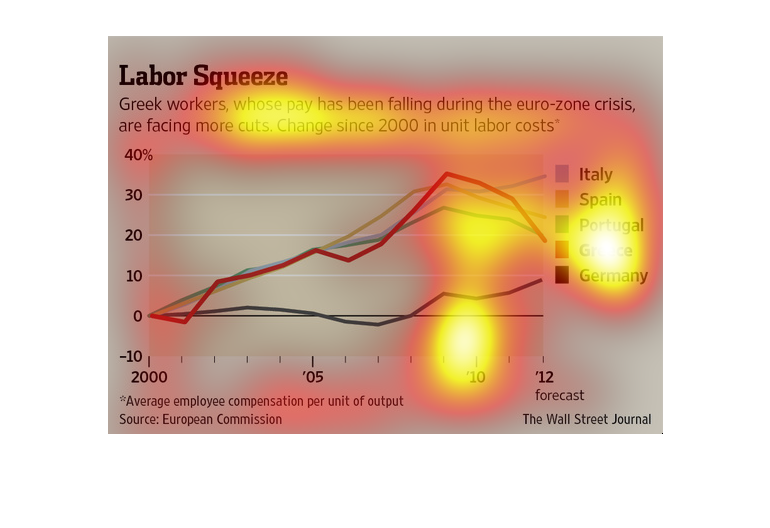
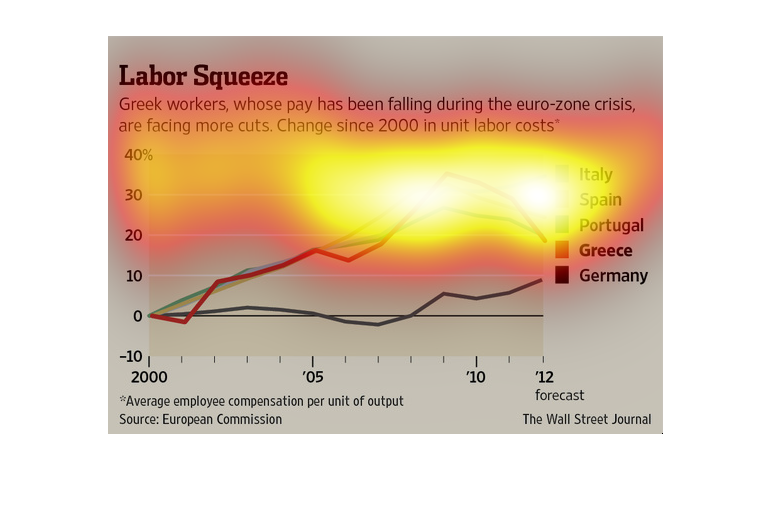
This chart from the Wall Street Journal shows how there is a labor squeeze going on in Greece
since wages are decreasing and government spending is also decreasing
The image depicts Greek workers and their shrinking income, with even more pay cuts on the
way. Unit labor costs in Greece have fallen drastically over a period of two years as Greece
faces financial difficulties.
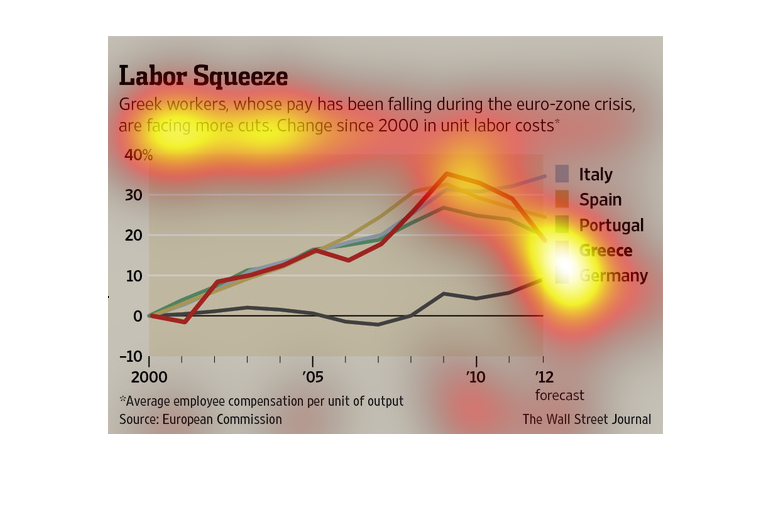
The graph represents the number of European employee compensation per unit output during the
recent labor crisis.  It shows that German workers were most affected.  Greek, Portugese,
and Spanish workforces showed signs of growth, but declined around the year 2009 onward.
Italy is the only country shown to have a steady increase in output.
The following chart is labeled labor squeeze. It shows Greek Workers whose pay has been falling
during the euro zone crisis, are facing more cuts. It shows the change in labor costs since
the year 2000. It gives data for Italy, Spain, Portugal, Greece and Germany.
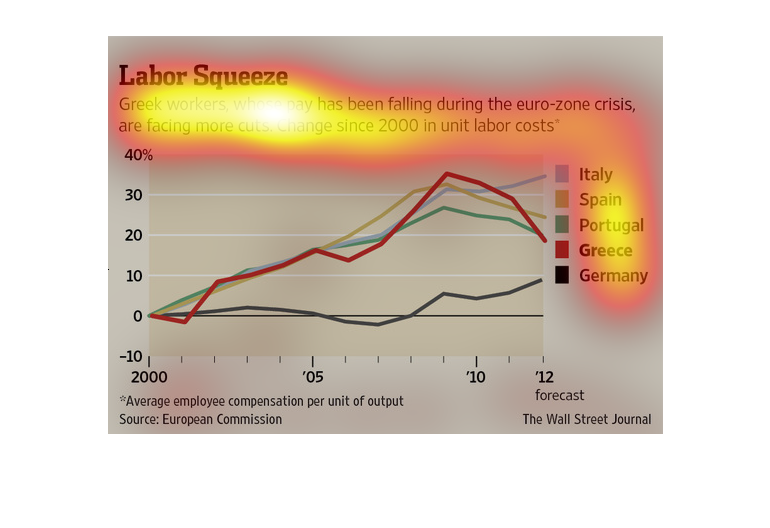
The title of the graph is labor squeeze. It says that Greek workers, whose pay has been falling
during the euro-zone crisis, are facing even more cuts.