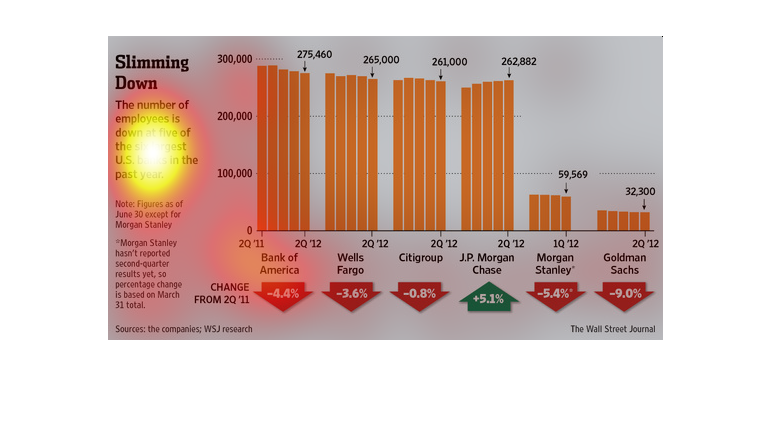
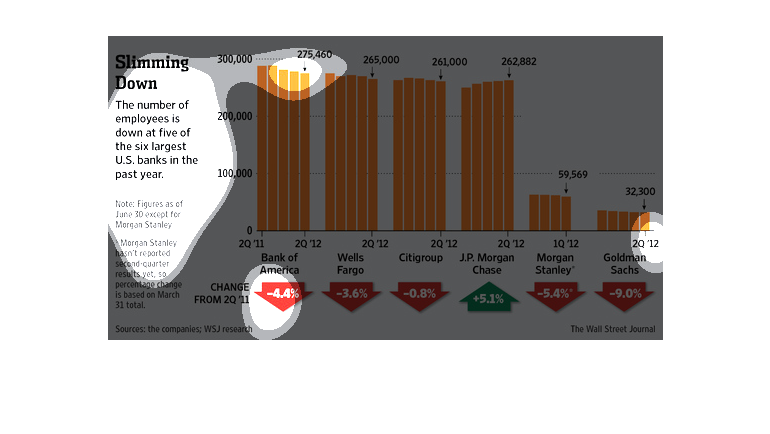
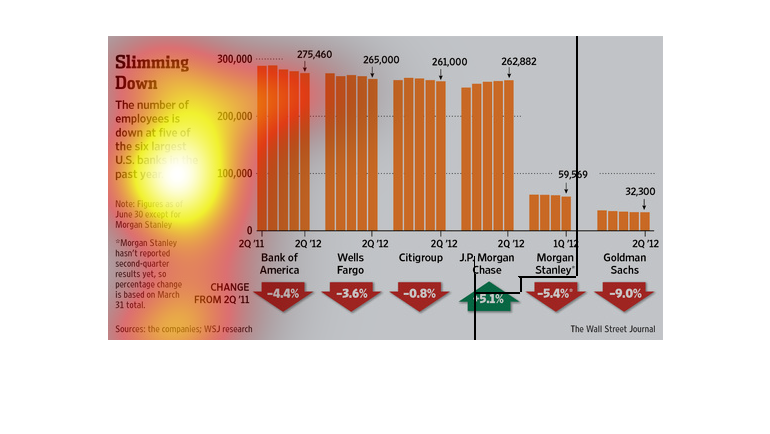
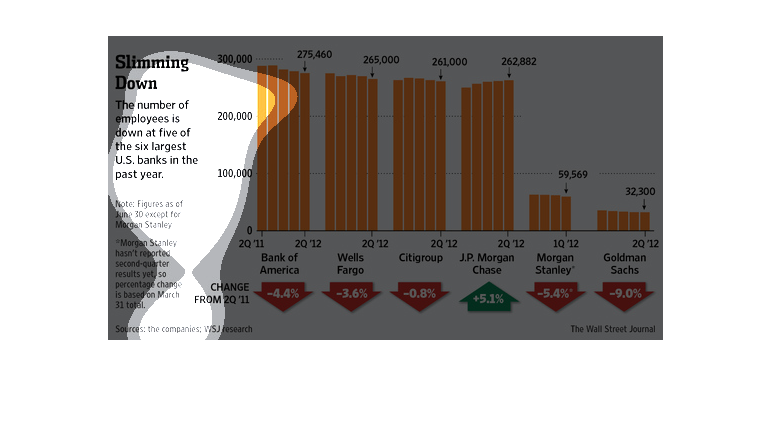
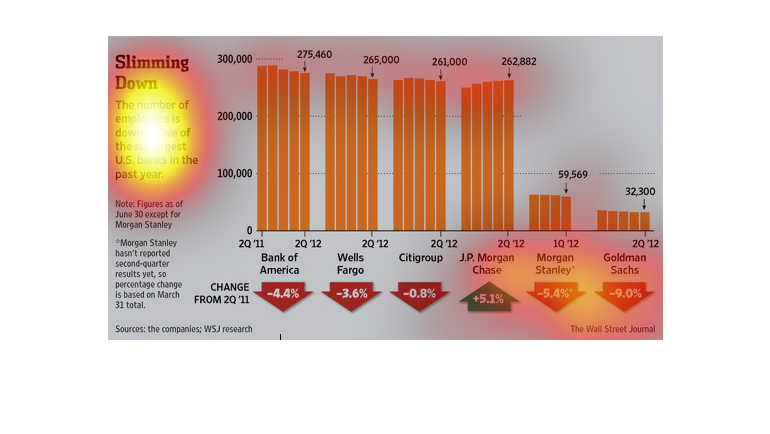
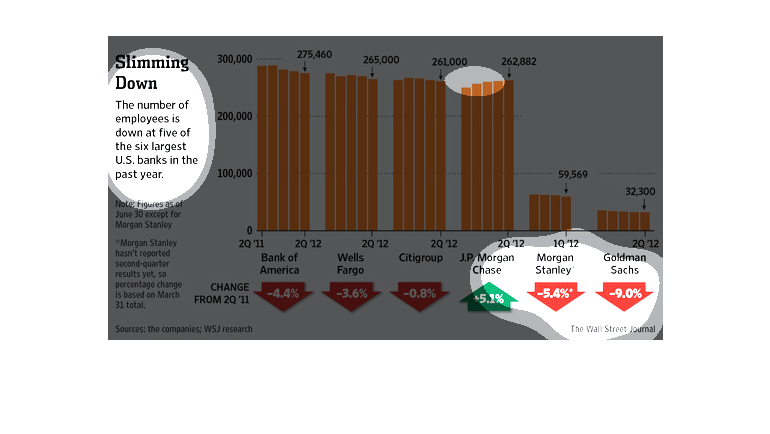
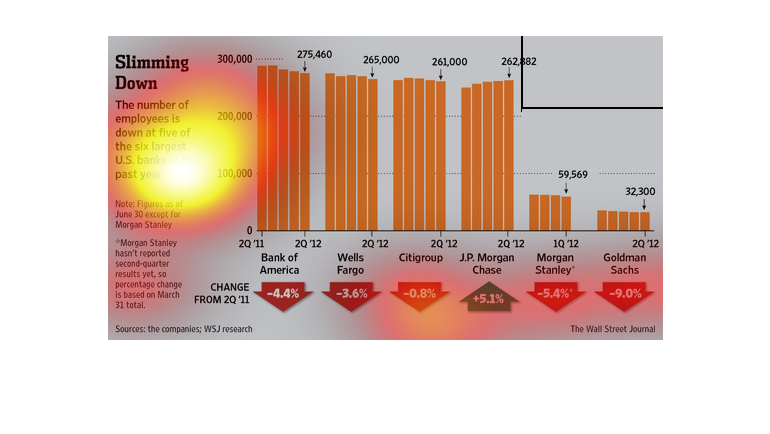
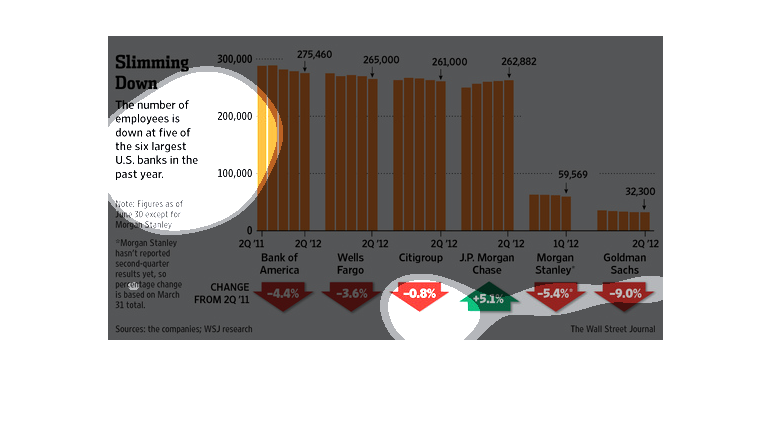
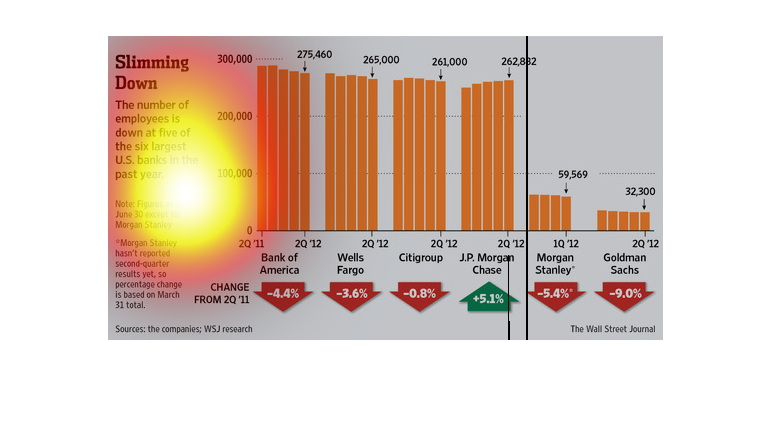
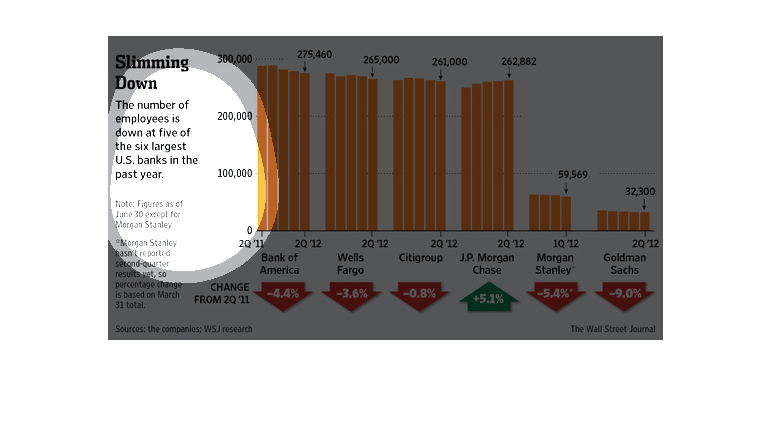
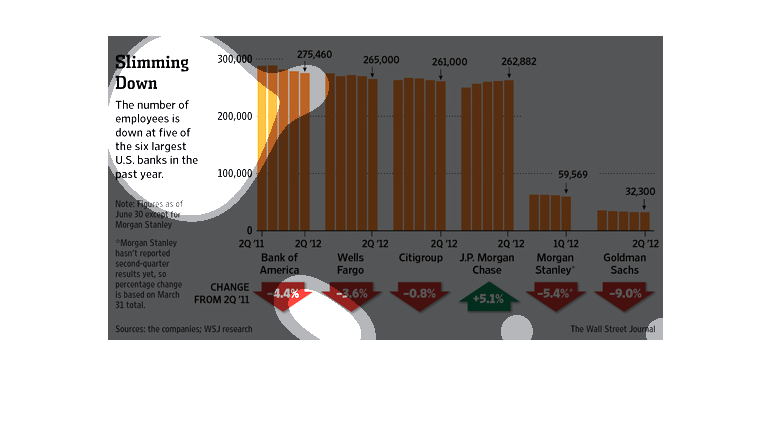
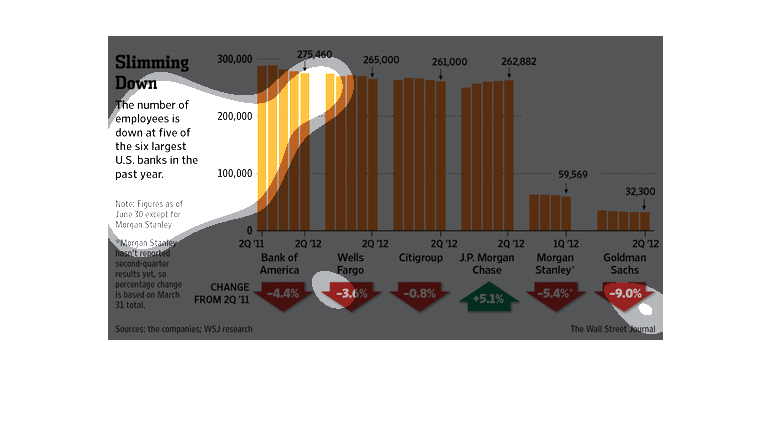
This graph is about the number of employees that have slowed down at the five of the six largest
U.S. banks in the past year which is 2011-2012. Started out with 300,000 employees in 2011
but has decreased to 32,300 employees by 2012.
This chart from the Wall Street Journal shows how the investment banks in the united states
are cutting headcount because of challenging times and business cycles
This chart from the Wall Street Journal shows how all the major investment banks in the United
States are starting to cut head count to adapt to the changing landscape
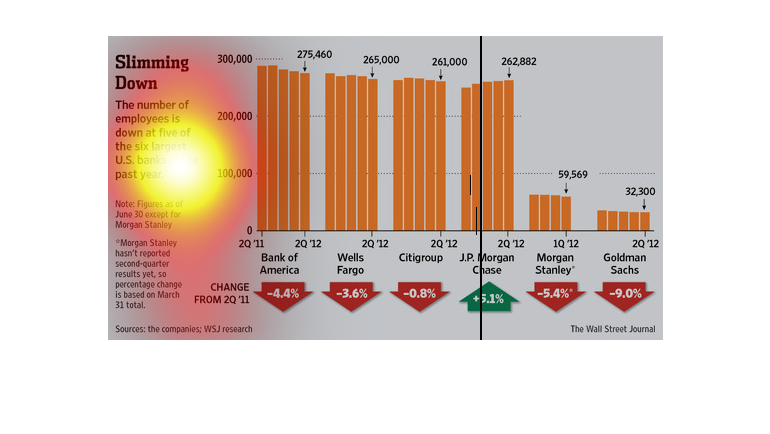
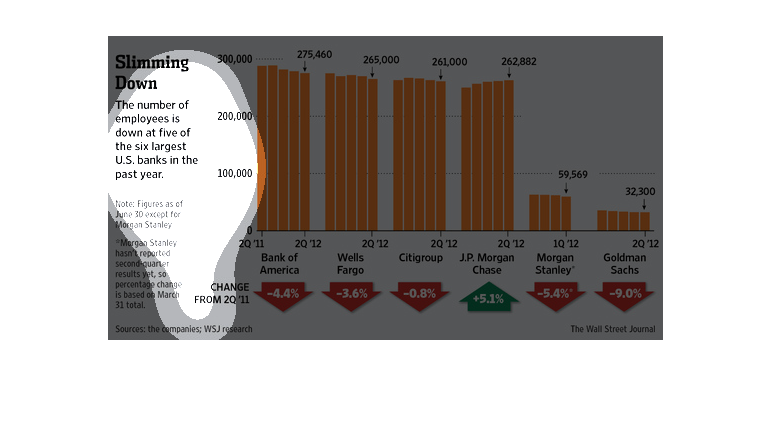
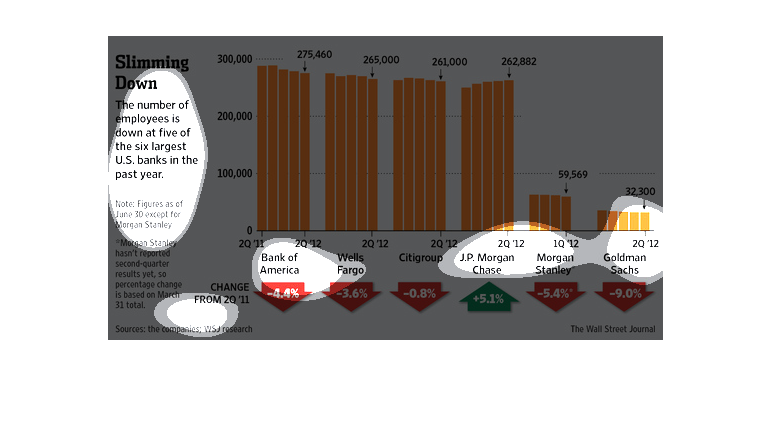
The number of employees at 5 of the 6 largest banks have been declining from the second quarter
of 2011. Only J.P. Morgan Chase has increased their employees by 5.1% for the second quarter.
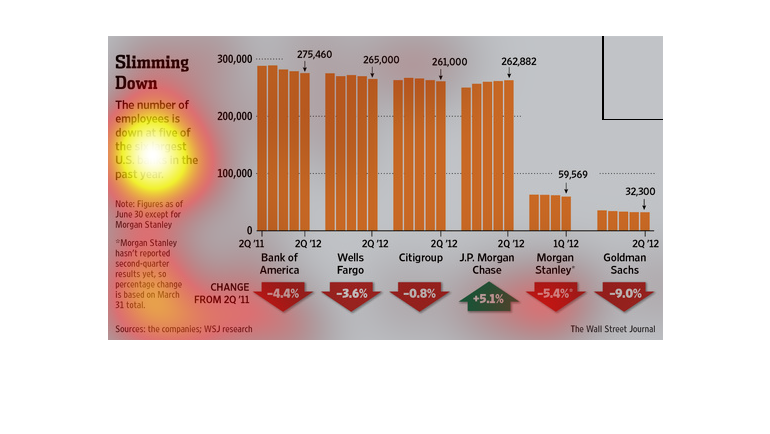
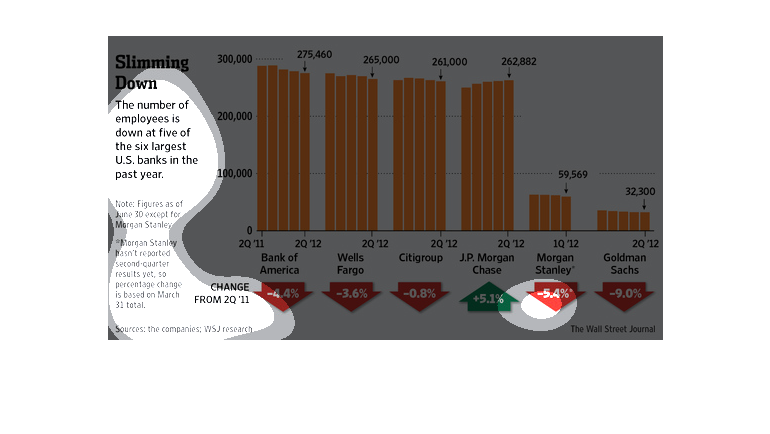
This graph depicts the decrease of employees in the top five major banks with the only increase
being at J.P. Morgan Chase. All other banks show a decrease, most significantly in Morgan
Stanley and Goldman Sachs.
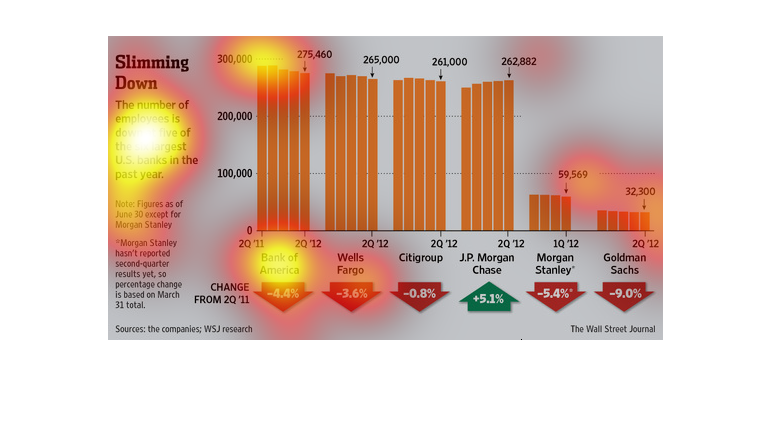
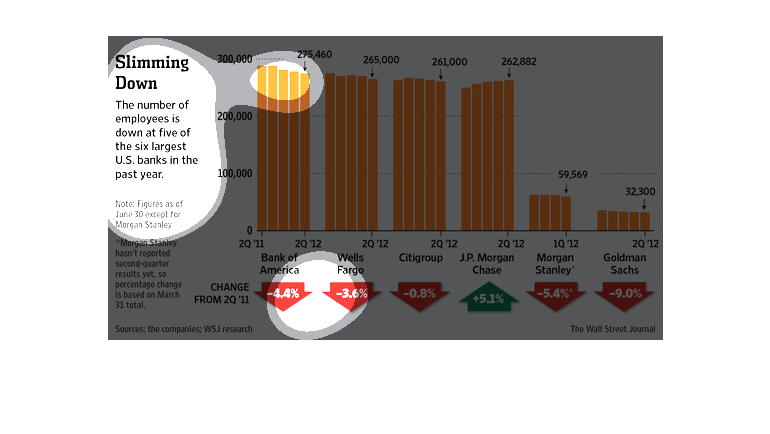
This chart shows that the number of employees has dropped in large banks in the second quarter
of 2011, every bank except for Chase has lost employees.
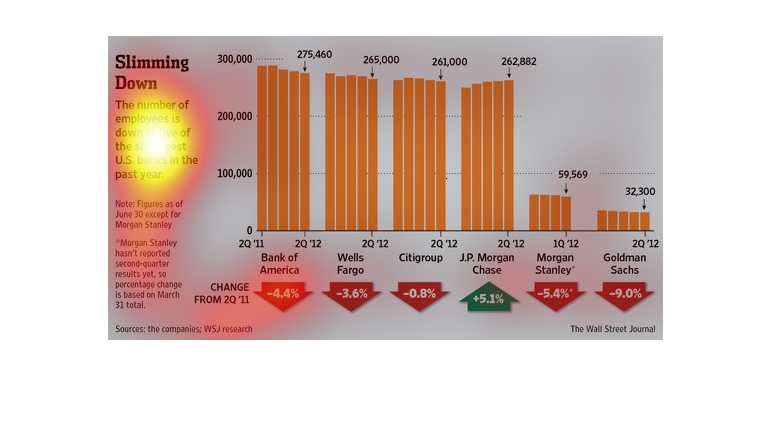
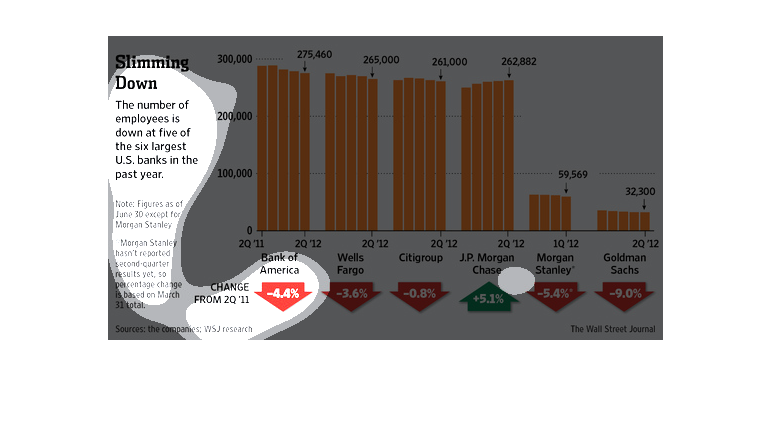
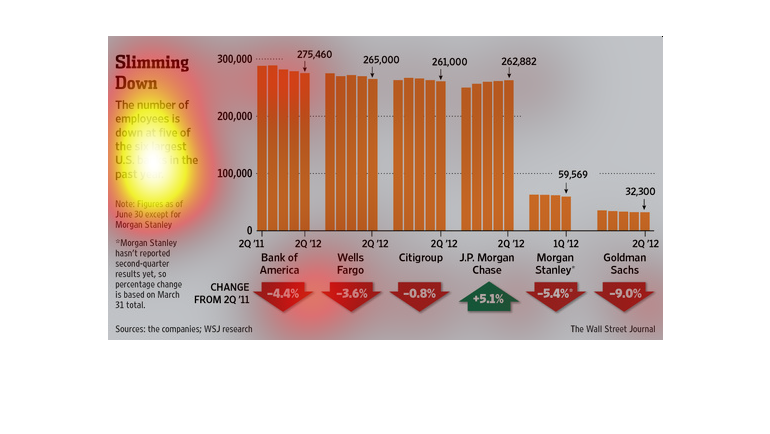
This chart shows the decrease in the number of employees for five out of the six largest banks
in the United States with Bank of America having the largest cuts at 4.4%.
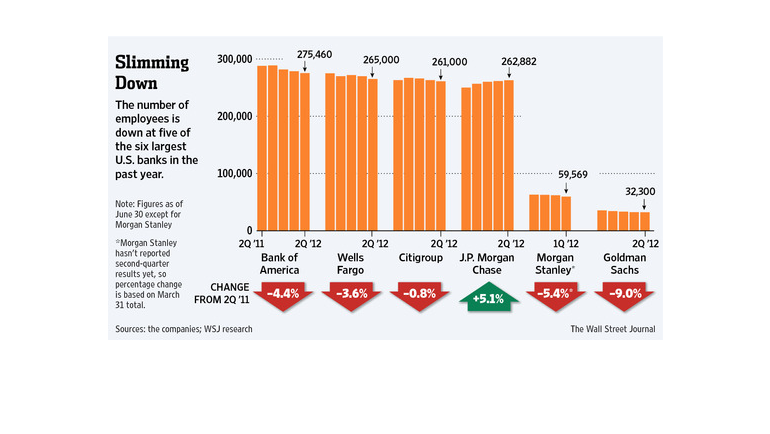
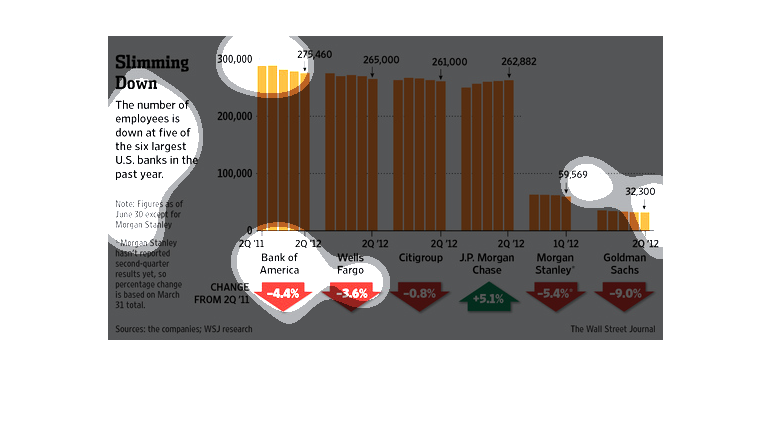
This chart describes slimming down . Specifically, the number of employees is down at five
of the six largest banks. Different categories are represented by different colors.
This is a bar graph that is showing the amount of people that were fired and in the different
companies as well as the years. The chart is titled "Slimming Down"
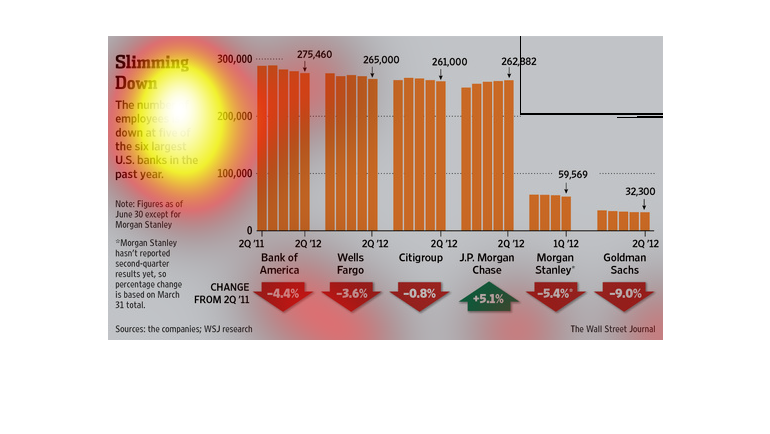
Title is Slimming Down Subtitle is The number of employees is down at five of the six largest
US banks in the past year.  A bar chart is used to support this claim.  It used to be 300,000
employees in second quarter 2011. Now (second quarter 2012) it is down to 32,300   Also, there
is a bar chart comparing Bank of America (employees down 4.4%), with Wells Fargo (3.6%) and
other banks.
This graph shows the number of employees in each of the major US banks. They all are down
in percentage, except for chase, which has risen by 5 percent.
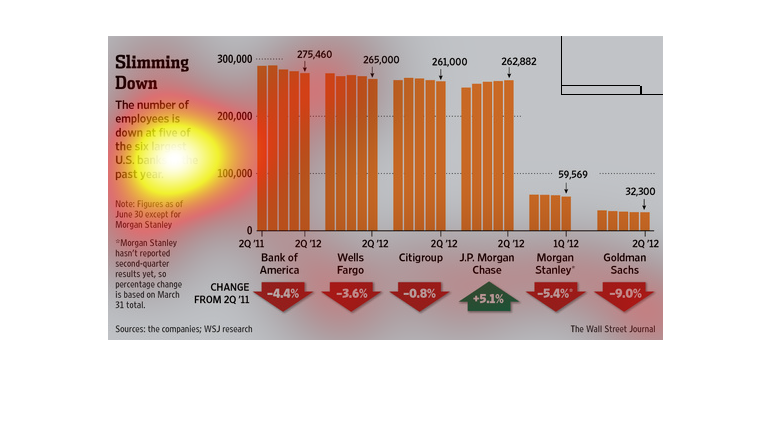
This chart clearly displays that the number of employees is down at five of the six largest
 United States banks in the past year. Bank of America is credited with the most employees.
In this study conducted by the Wall Street Journal, from research obtained from these six
banks listed, the cost of doing business has gone up. From the second quarter of 2011 to the
second quarter of 2012,  these banks have let got of a lot of personnel to keep cost down.
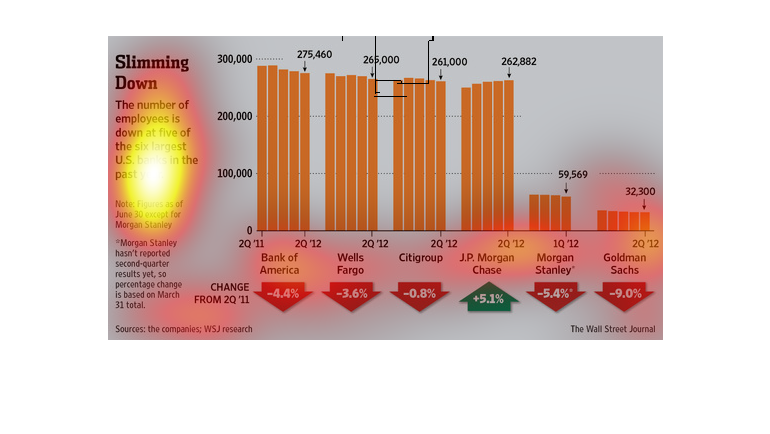
The number of employees is down at 5 of the 6 largest banks in the U.S. in the past year.
 The graph shows each of the 6 largest banks (Bank of America, Wells Fargo, Citigroup, J.P.
Morgan Chase, Morgan Stanley, Goldman Sachs) and the decrease in employees over the years.