This chart from the Wall Street Journal shows how student debt levels are at an all time high
in the united states and the potential burden this has
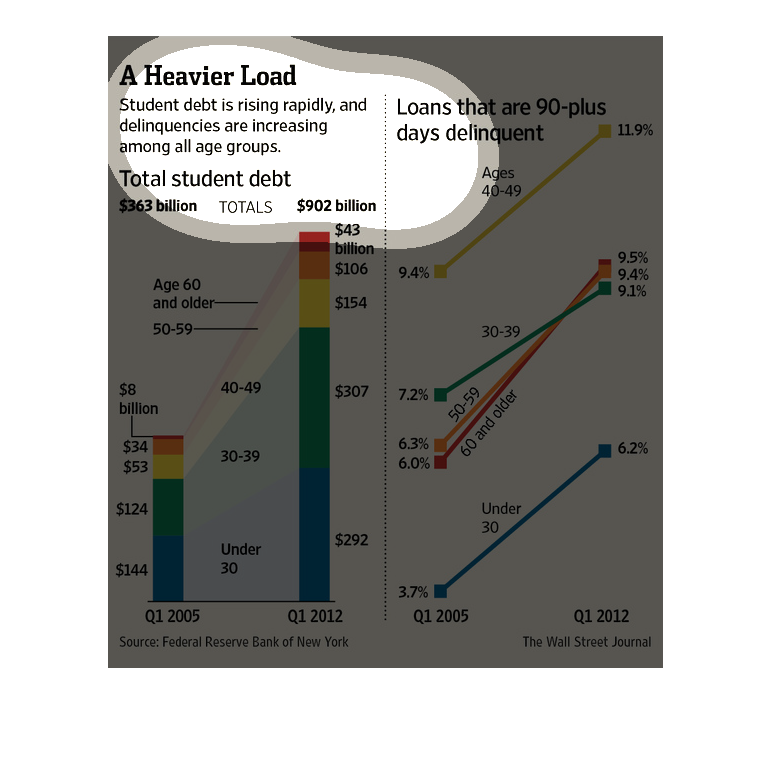
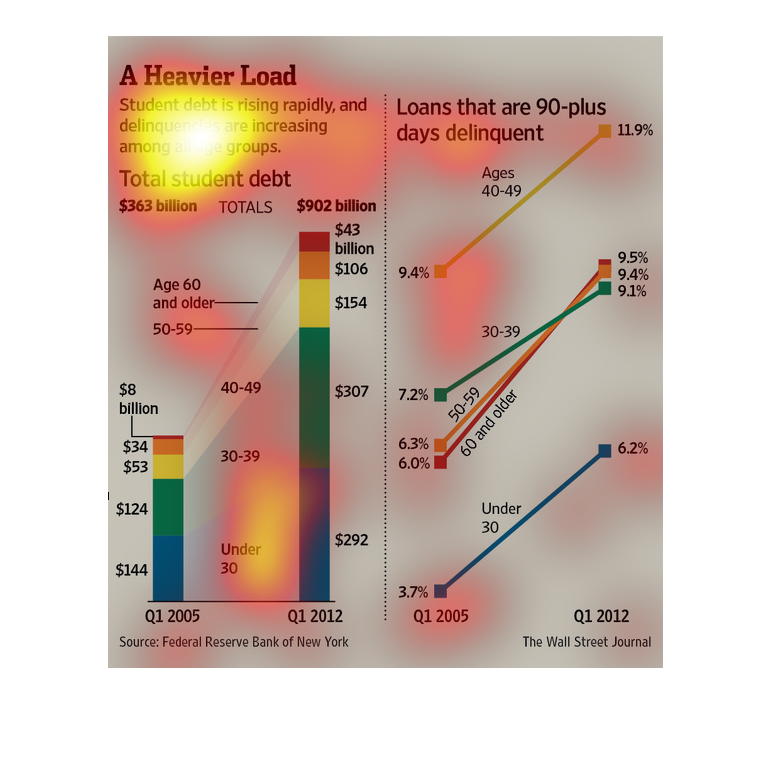
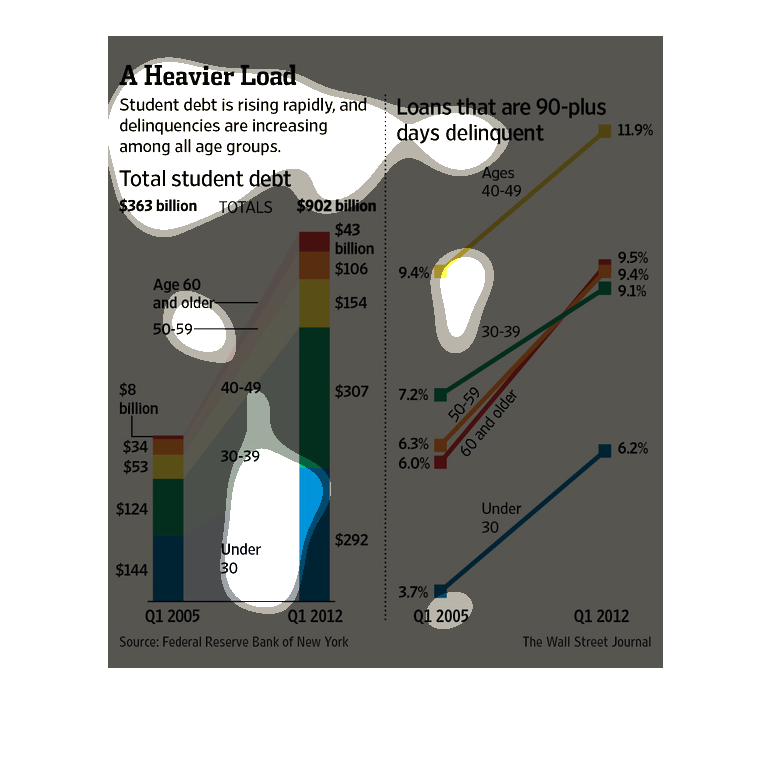
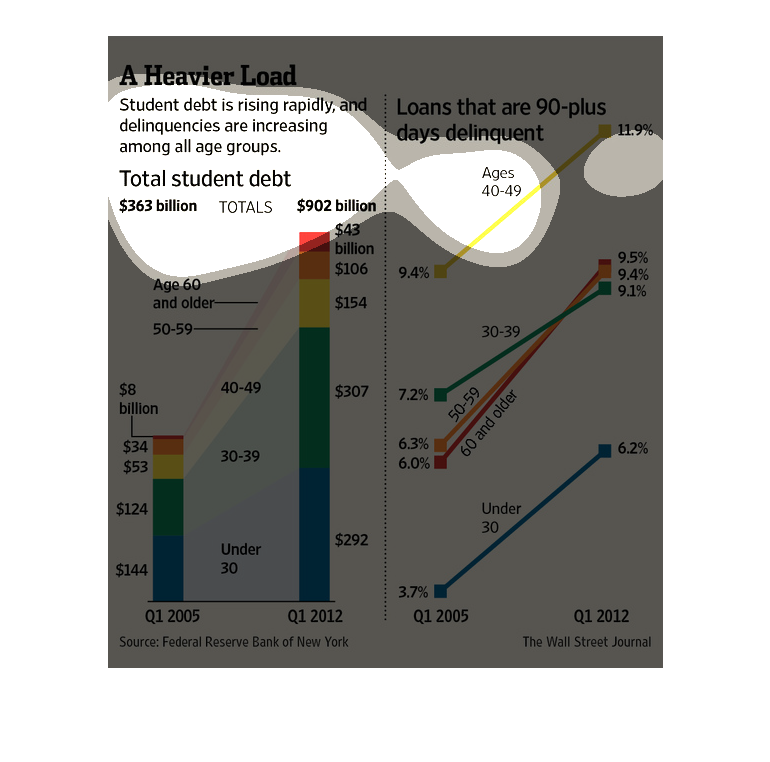
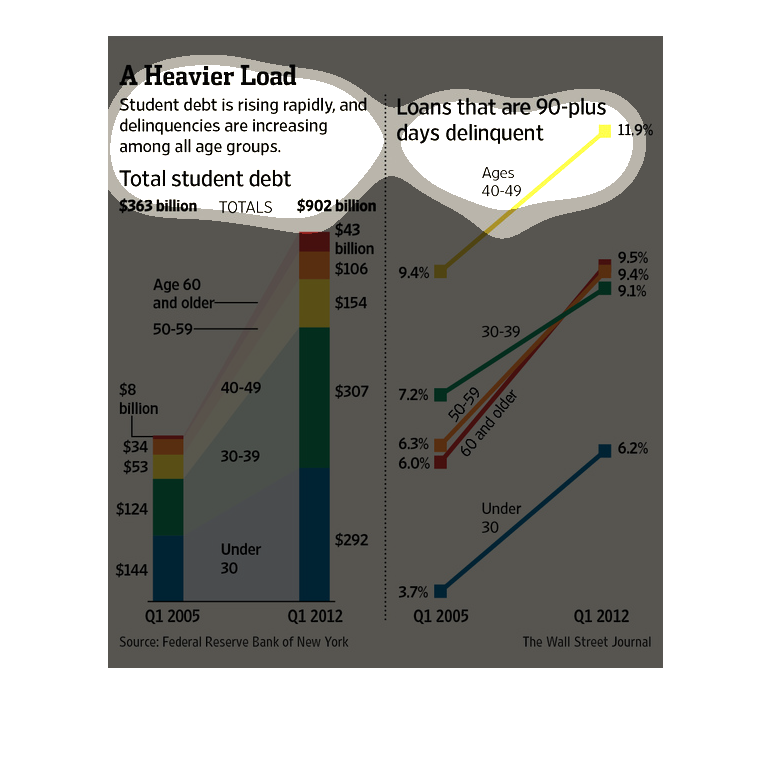
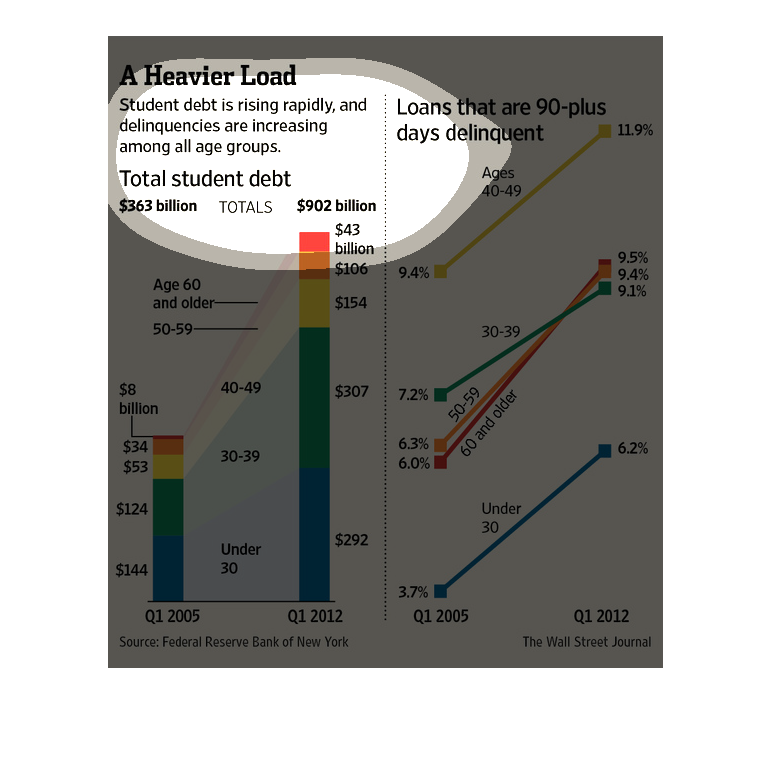
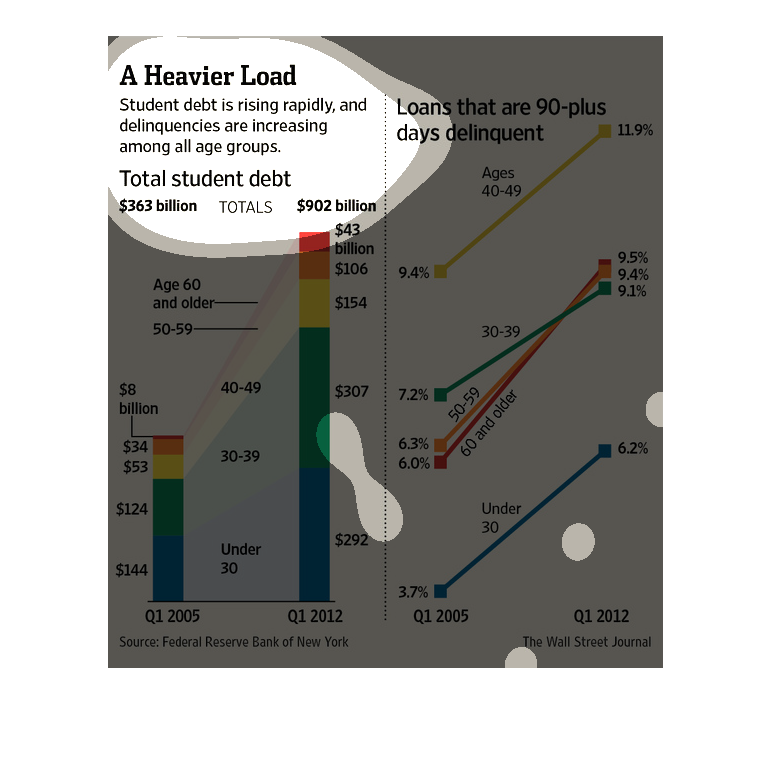
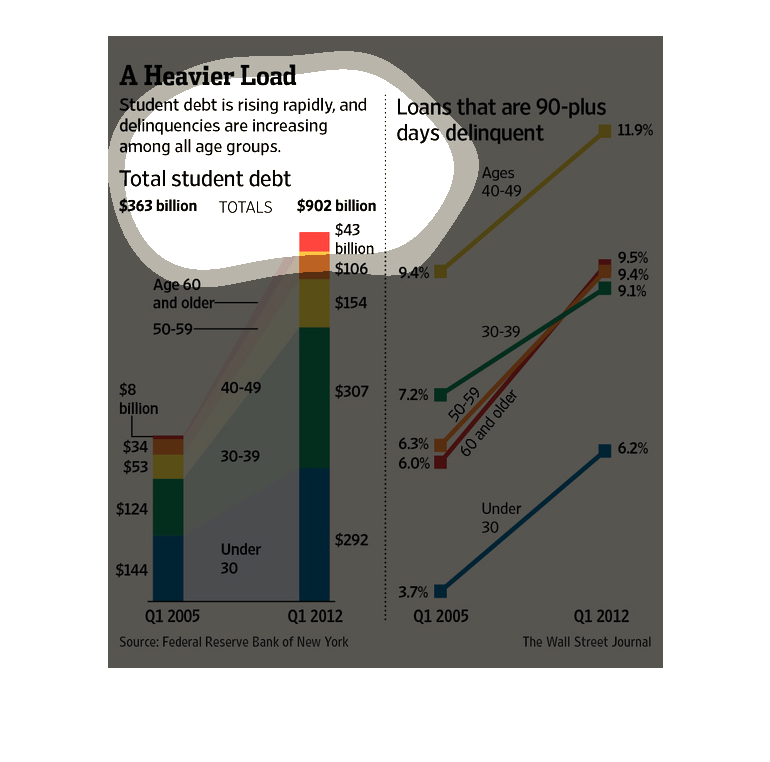
This graph depicts the increasing amount of student loan debt, comparing 2005 vs. 2012.  The
data are subdivided by age group, and the graph shows both the total amount of debt in 2005
vs. 2012, and the rate of delinquency over 90 days.
This is a series of graphs and charts with related statistics depicting the rise of both student
debt, and the number of mortgages that were over 90 days late.
This chart from the Wall Street Journal shows how student debt in the United States is rising
rapidly because of increases in cost of higher eduction.
This chart details a possible link between increasing student debt and delinquencies on loans.
The chart suggests that people are no longer able to pay back their student loans.
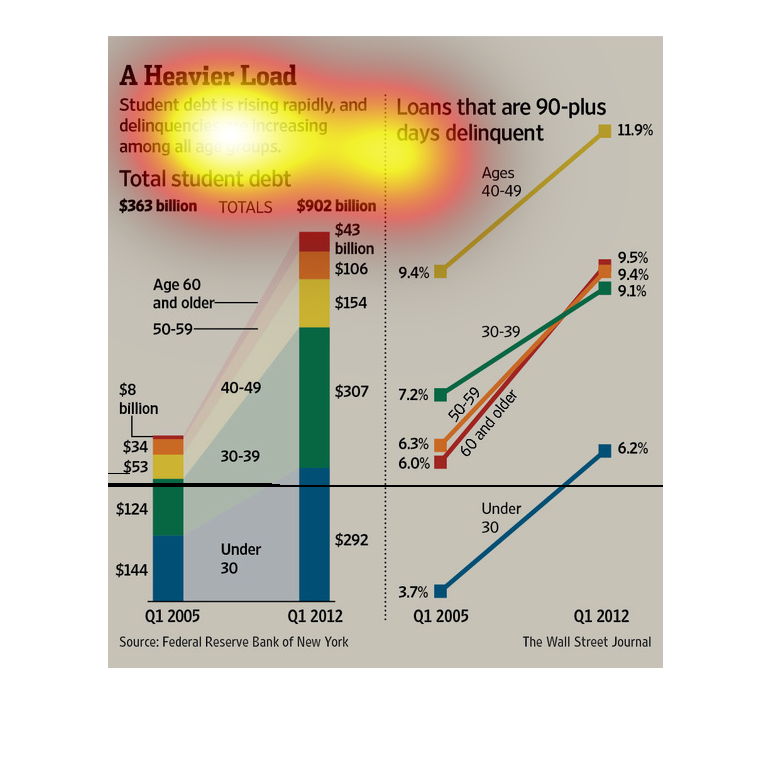
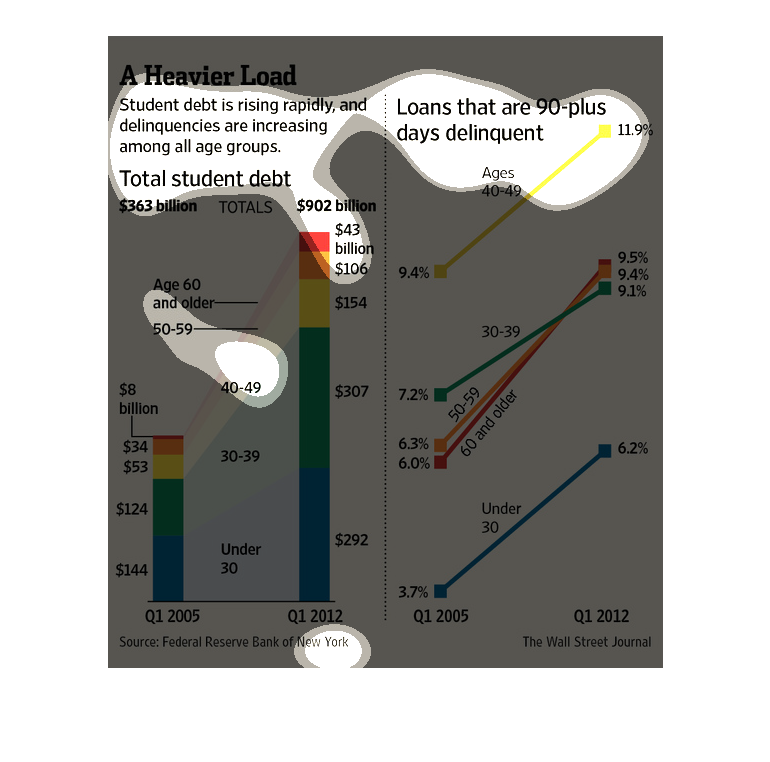
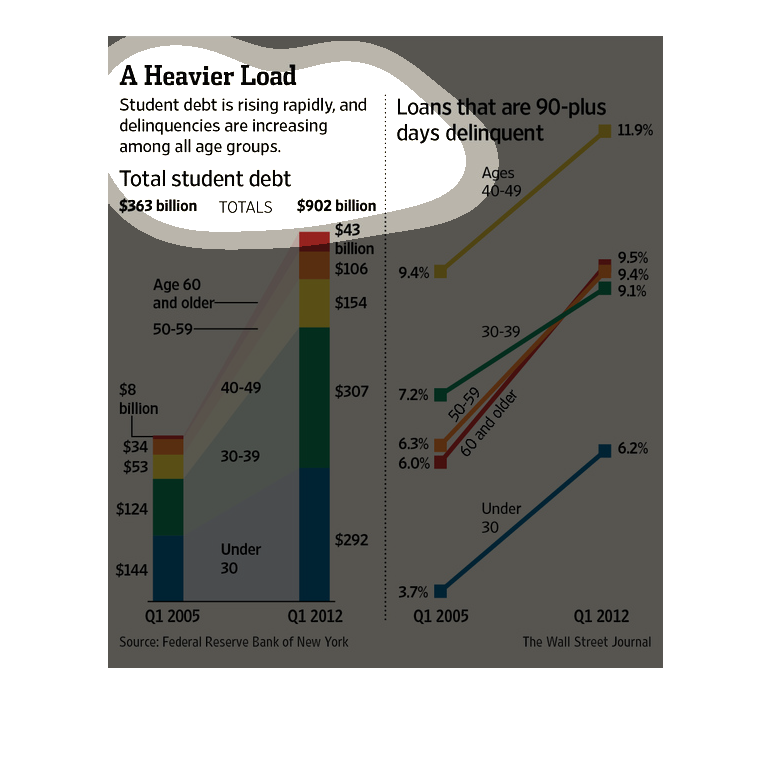
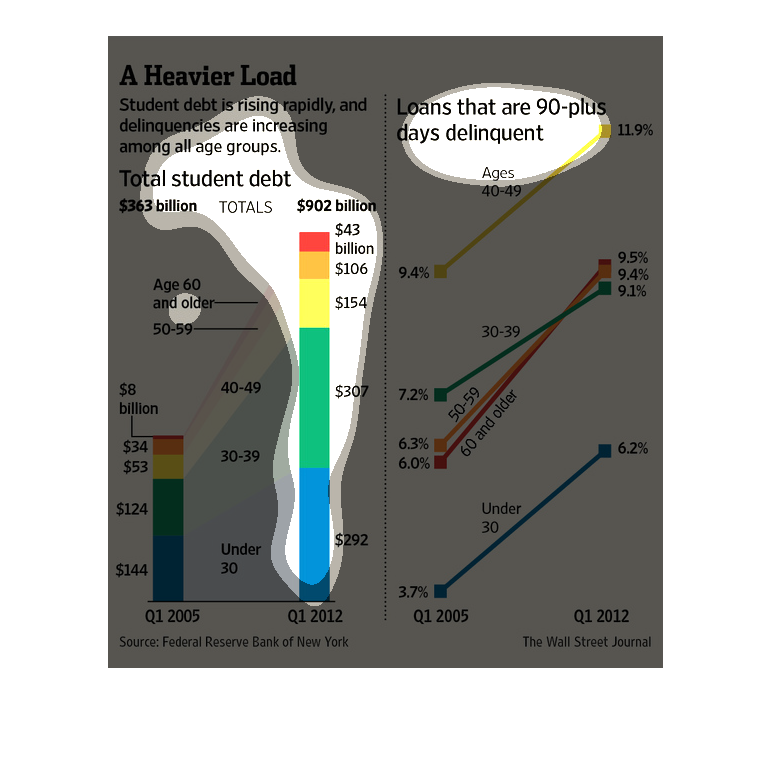
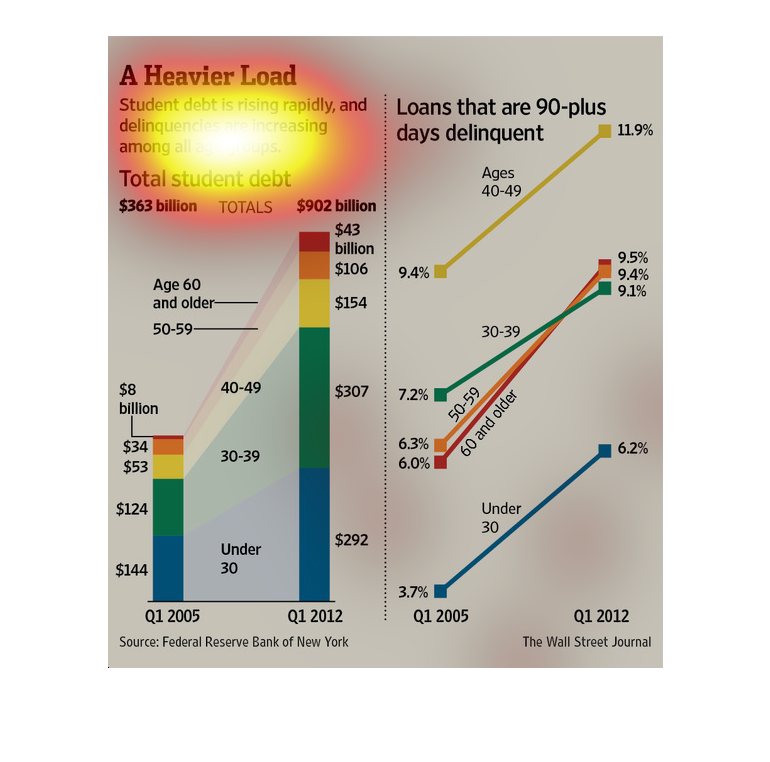
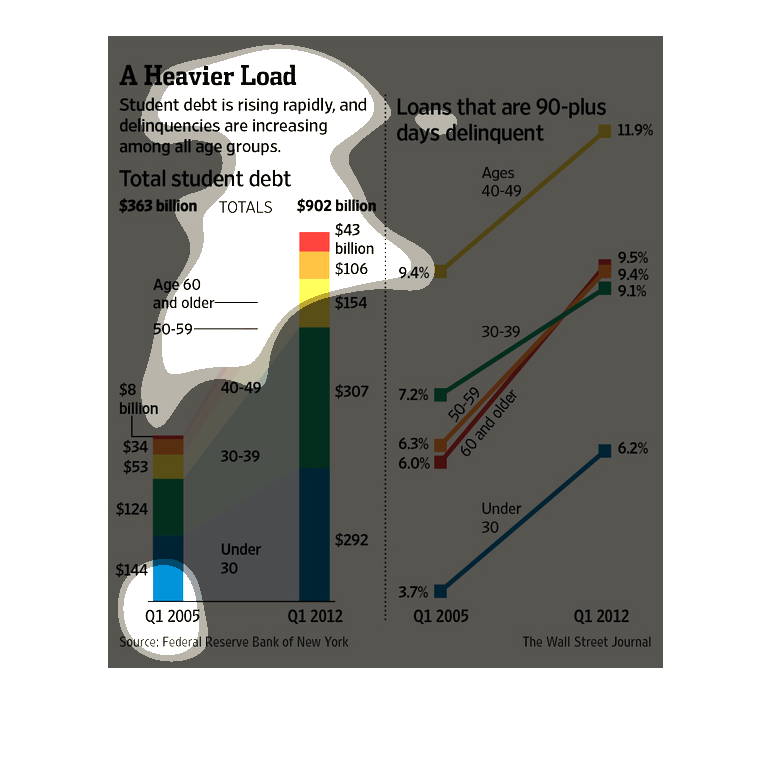
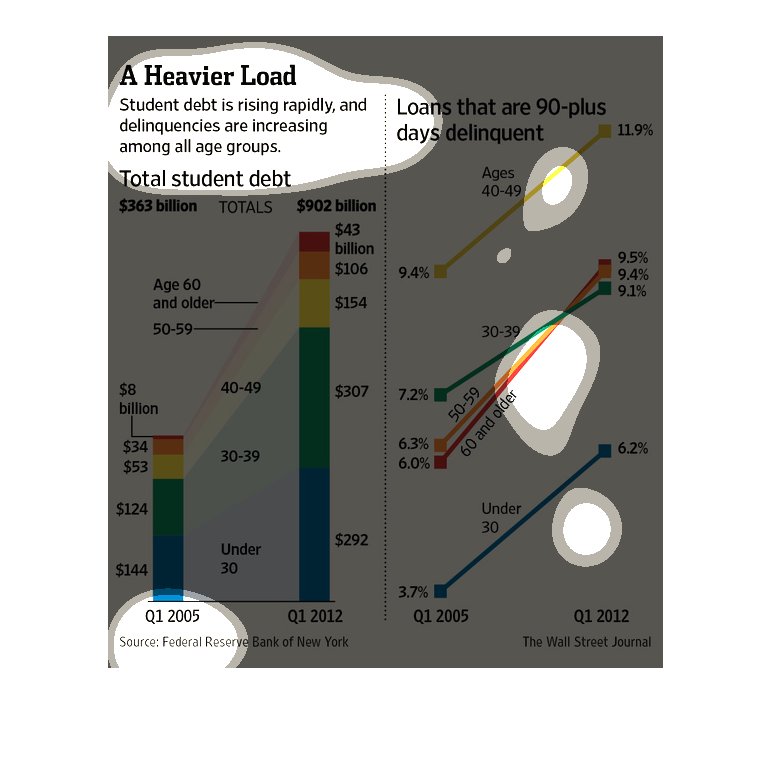
The Graph shows the rising student debt over time, and the rise in loans that are 90 days
or more delinquent. All age groups follow the same trend for delinquent loans, while the age
groups under 40 have the majority of debt in the US.
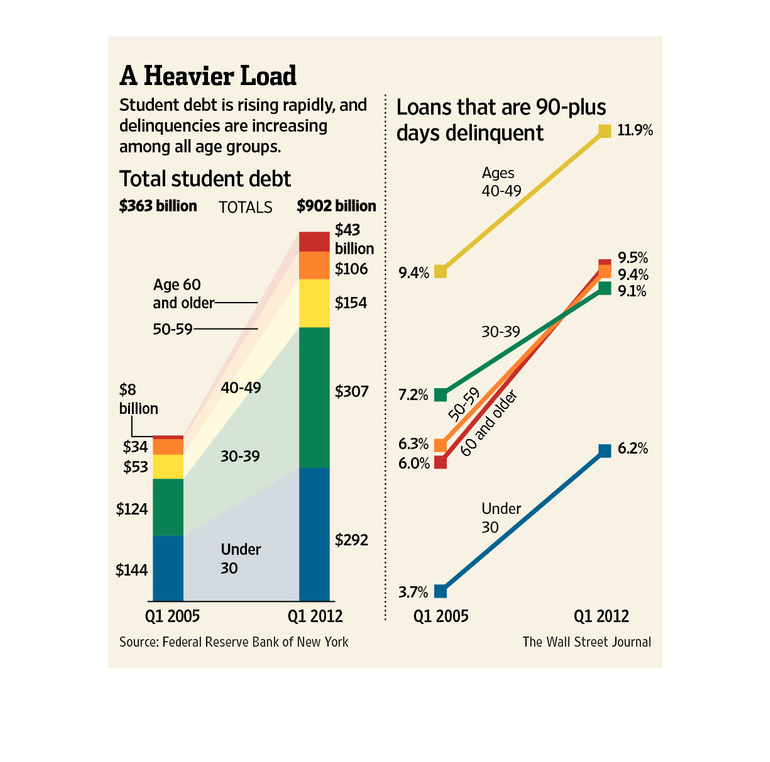
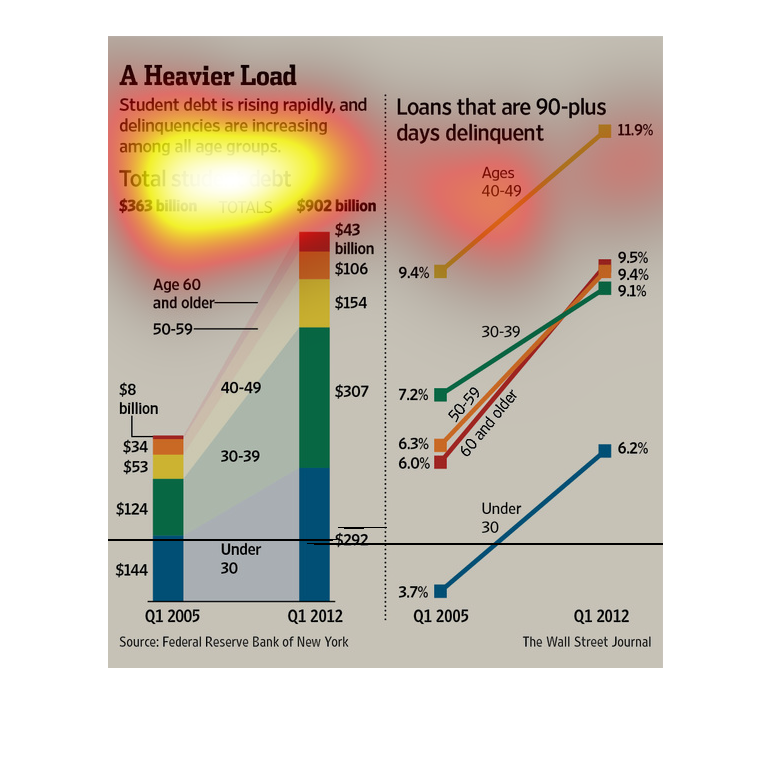
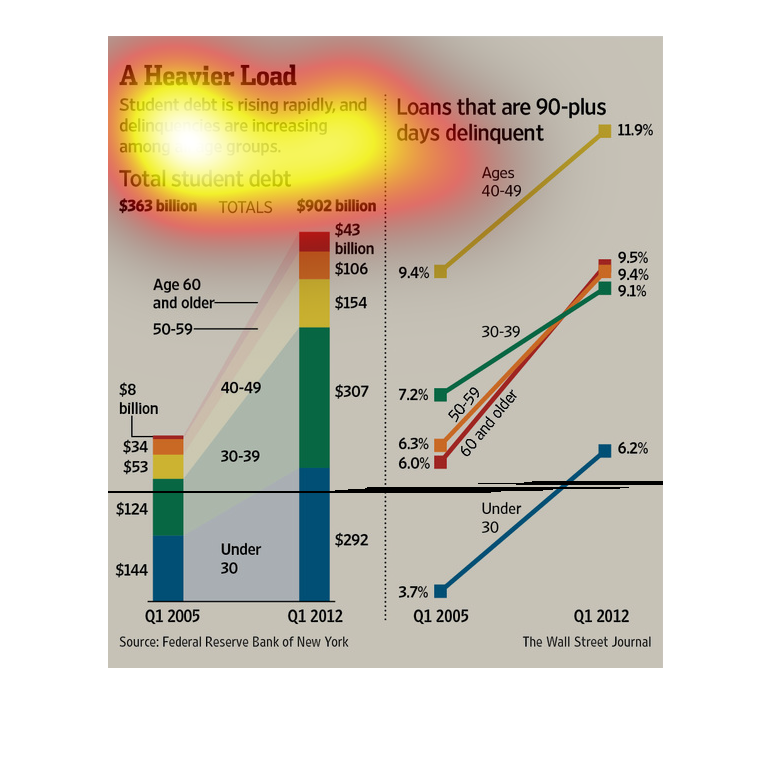
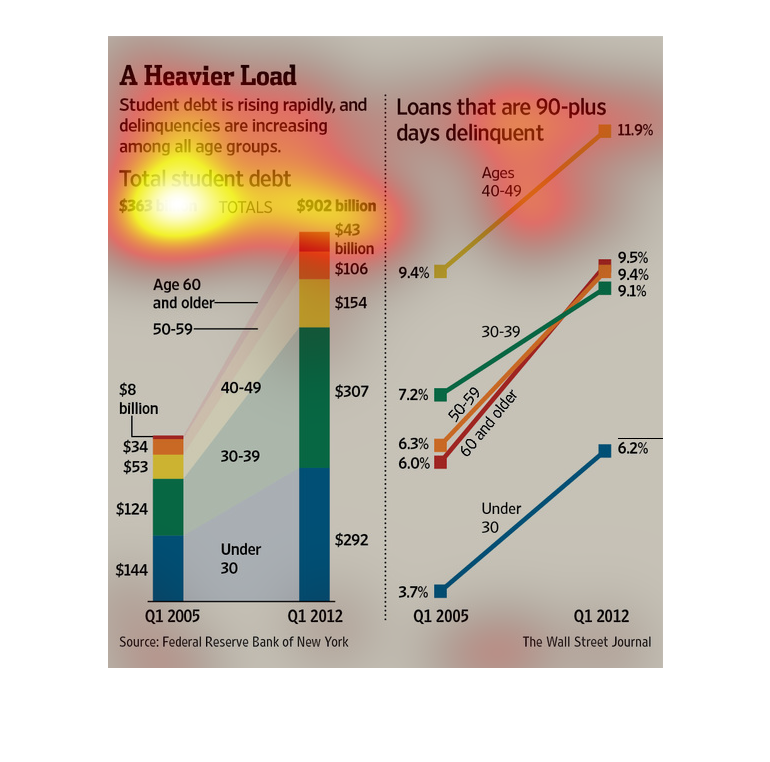
This chart describes a heavier load. Specifically, student debt is rising rapidly, and delinquencies
are increasing among all age groups. Different colors represent different categories.
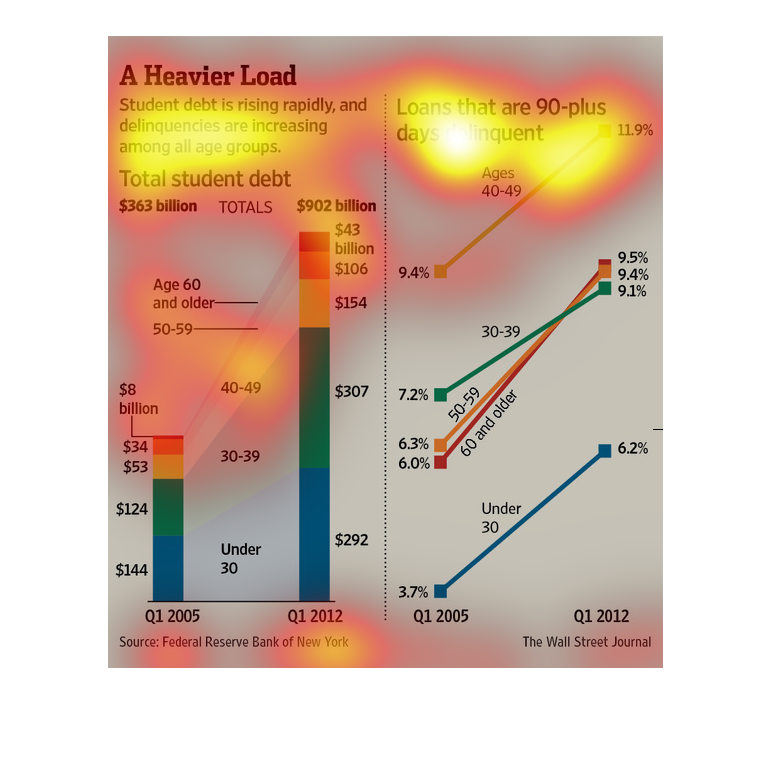
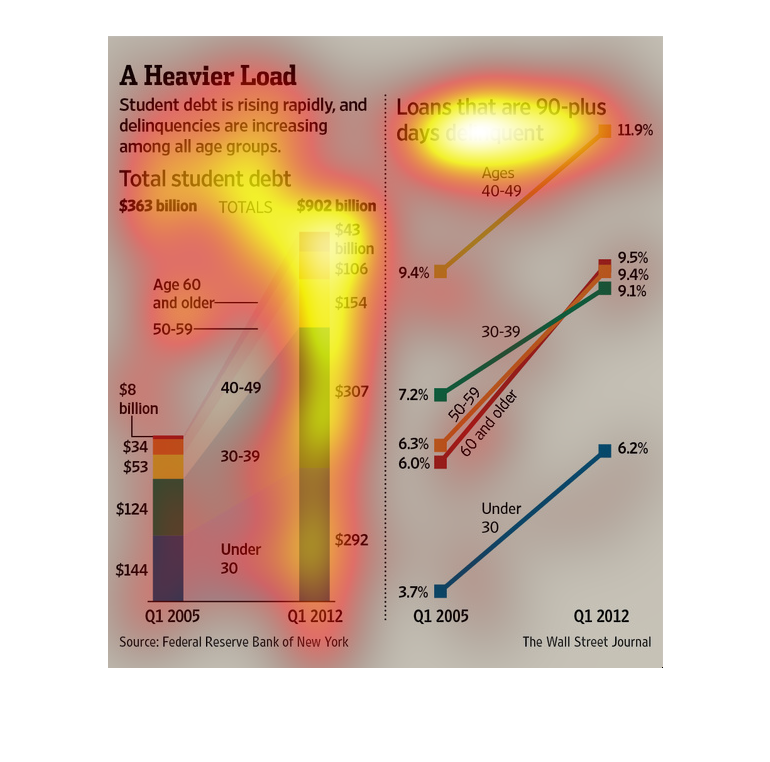
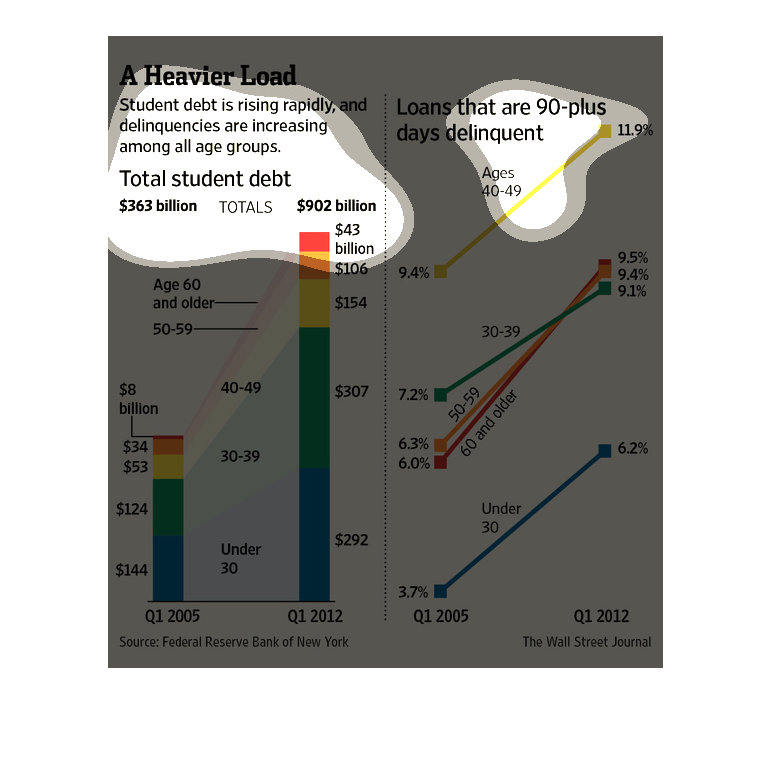
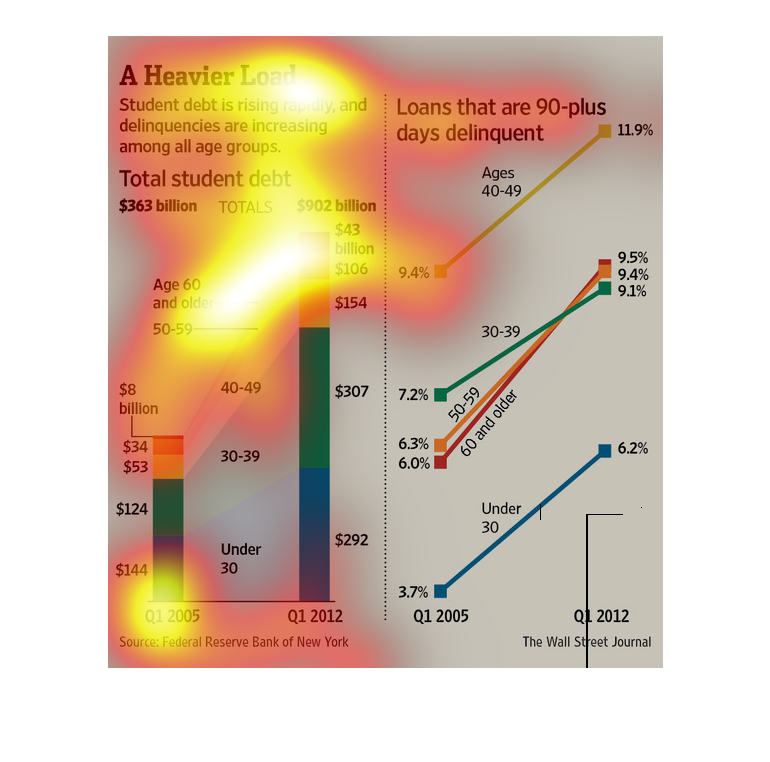
This graph is showing us how in debt students are between 2005-2012.  Total student debt is
$902 billion. It also shows us how many student loans are in delinquent 90 plus days between
the ages of 40-49.
This image shows or depicts in statistical bar and line graph formats information concerning
how student debt has risen rapidly and how delinquencies are increasing among all age groups.
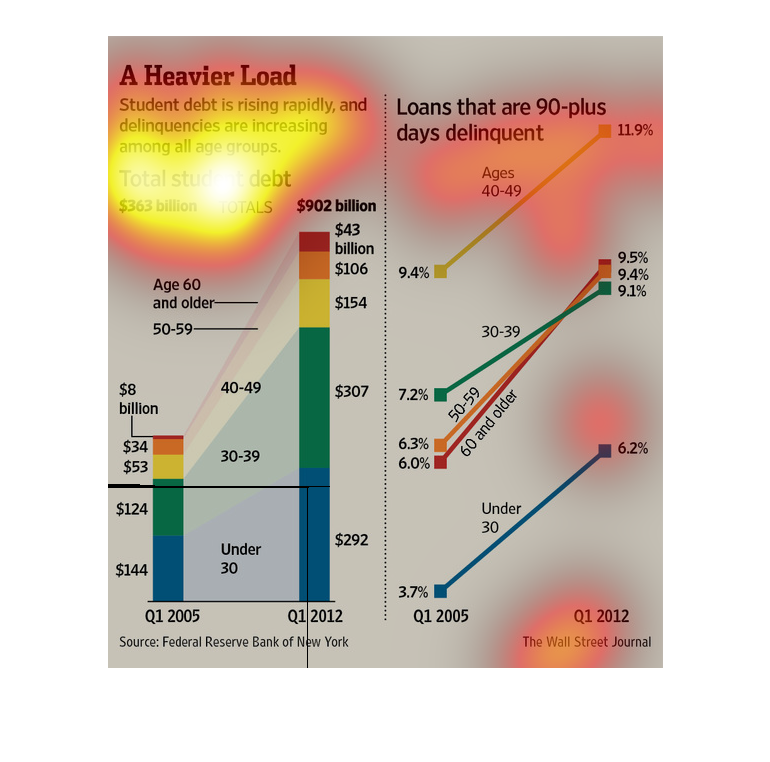
Student Debt has made a steady climb, now at all time high.  This is a graph chart displaying
the amount of student debt by the age of the debt holders and how much debt they have by what
age they are.
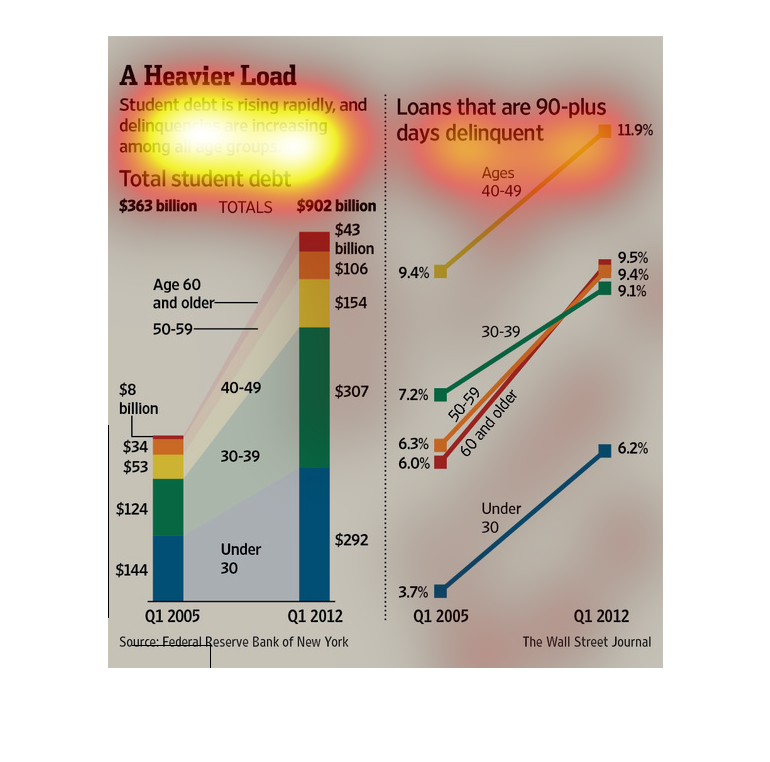
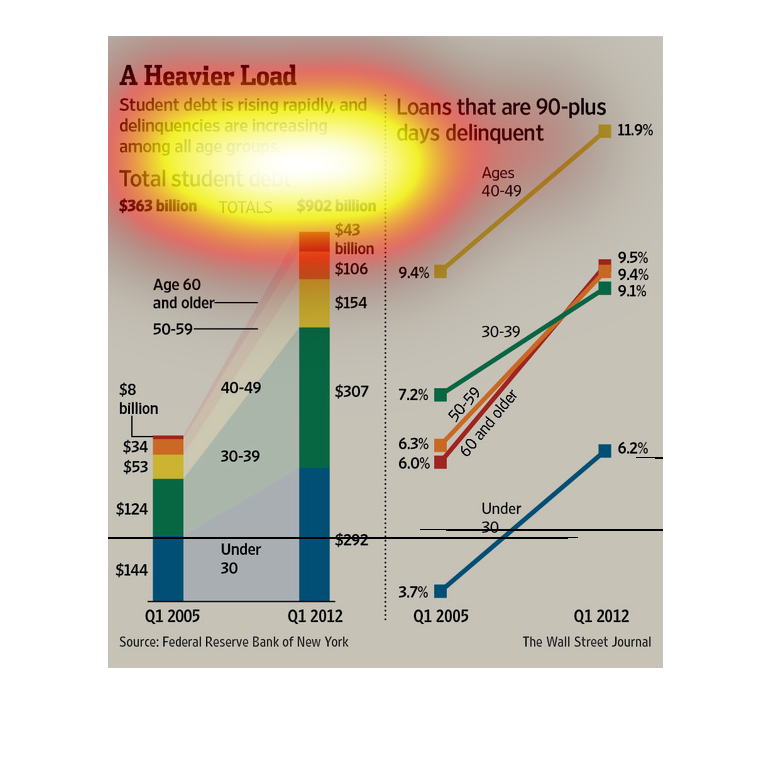
The title of the graph is heavier load. It says that student debt is rising rapidly, and delinquencies
are increasing among all age groups. It shows the total student debt.
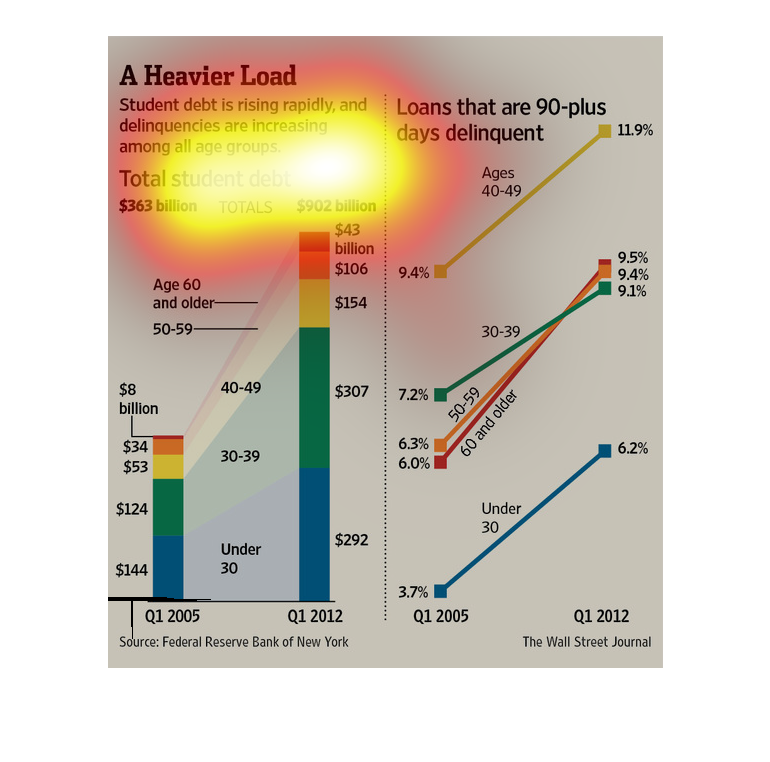
A Heavier Load. Student debt is rising rapidly, and delinquencies are increasing among all
age groups. Qurater one of 2005 compared to 2012. It appears rapid and indiscriminate.
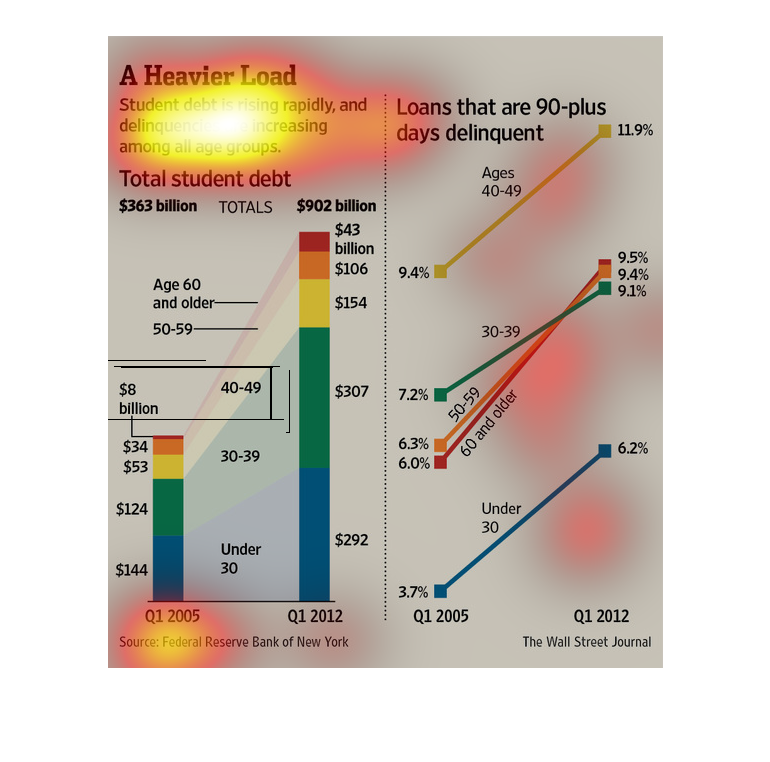
This graph illustrates how student debts for school loans are rising and there are big differences
between different groups.  Loans that are 90 plus days delinquent are highest among 40 to
49 year olds.
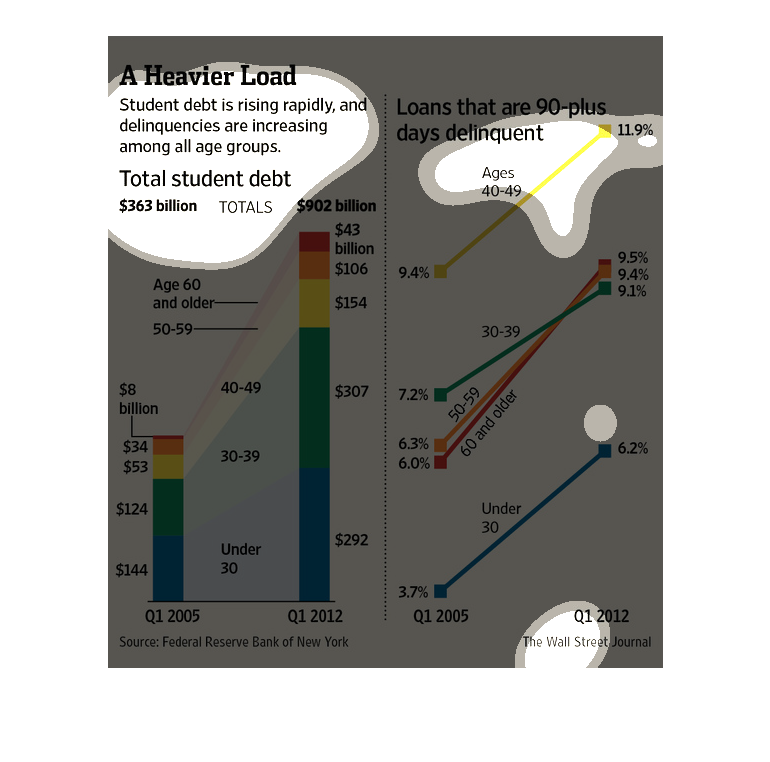
This chart shows how student debt is rising rapidly and the inability to pay is increasing
among all age groups. In 2005 the total student debt was at 363 billion and by 2012 it was
up to 902 billion. Increases were seen among all age group with the highest proportion in
those under 30 and from 30-39. The amount of lans delinquent over 90 days has increased by
at least 2.5% for all age groups during the time period.