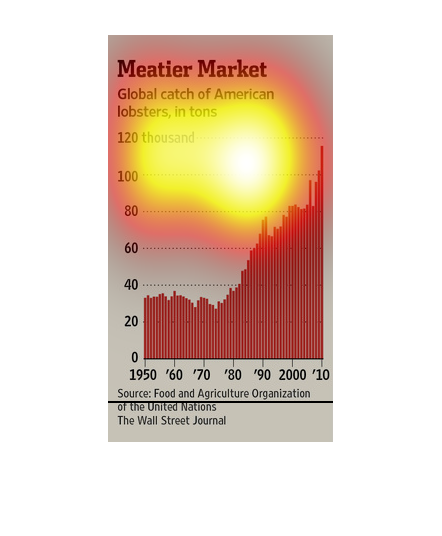
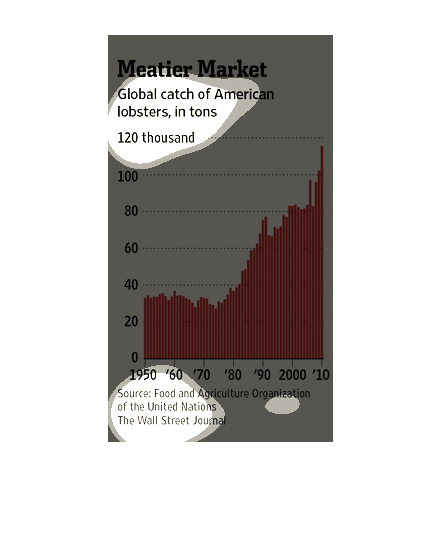
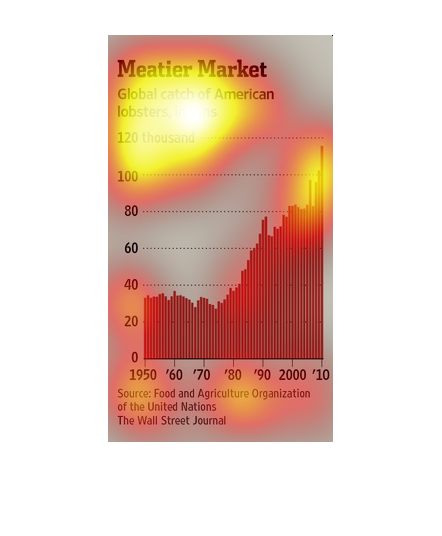
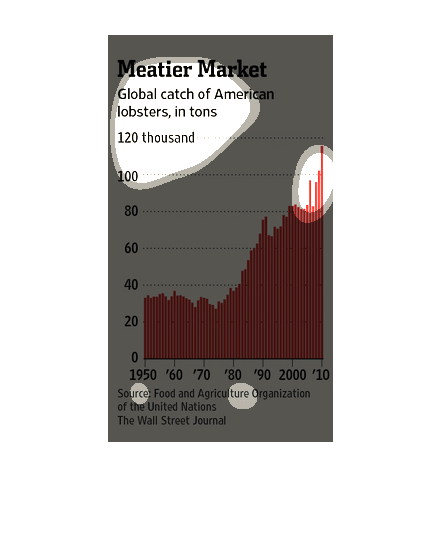
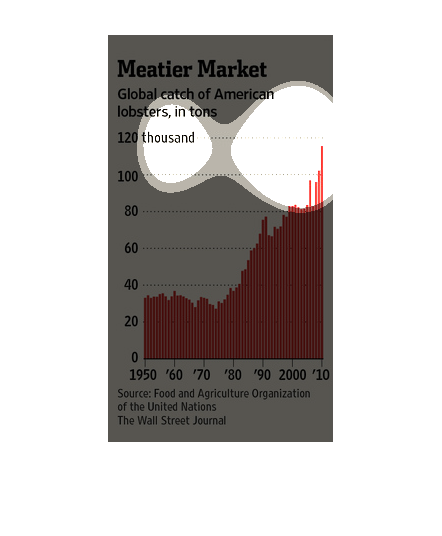
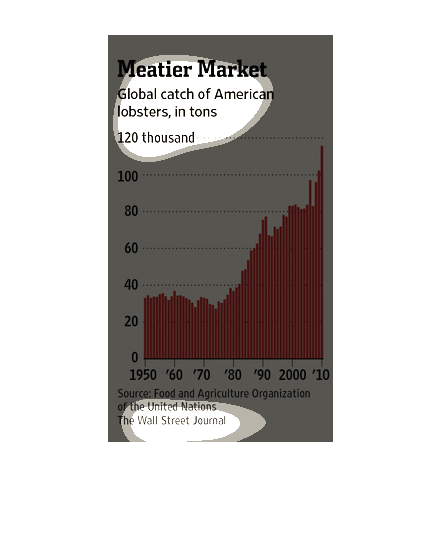
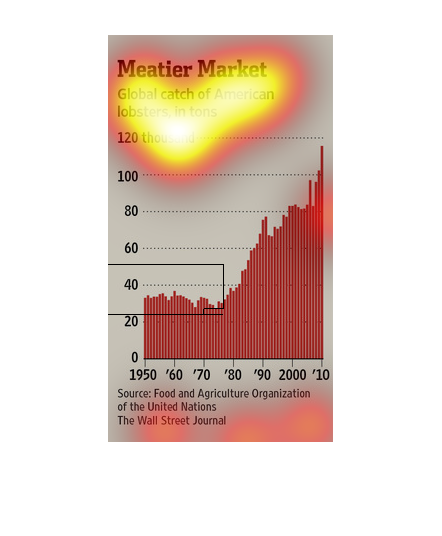
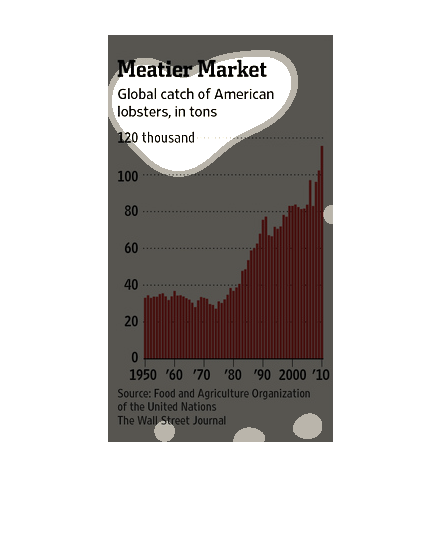
This chart describes meatier market. Specifically, global catch of American lobsters, in tons.
The chart covers the years 1950 through to the year 2010.
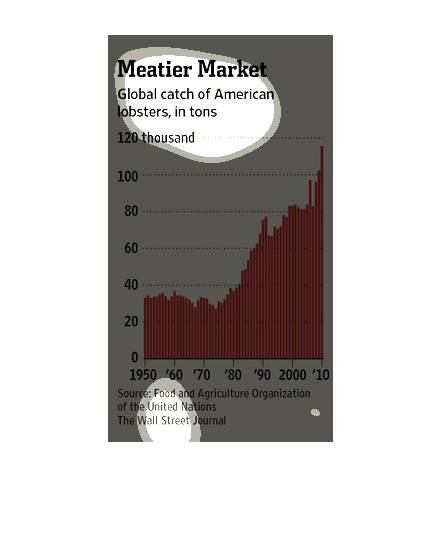
The image depicts the global catch of American lobsters, in tons. The data indicates that
numbers have been greatly increasing from 1950-2010, nearing 120 thousand tons.
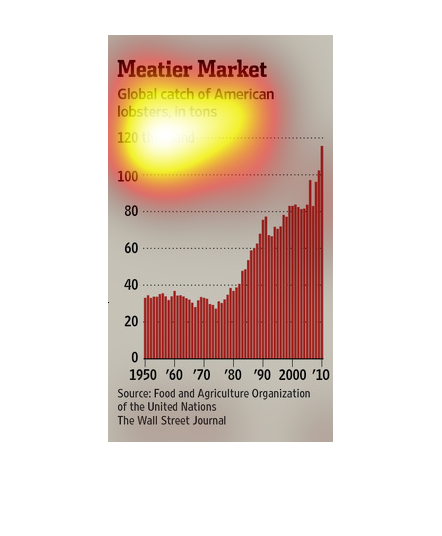
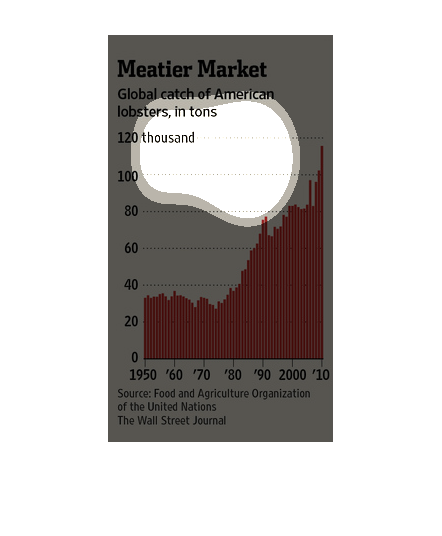
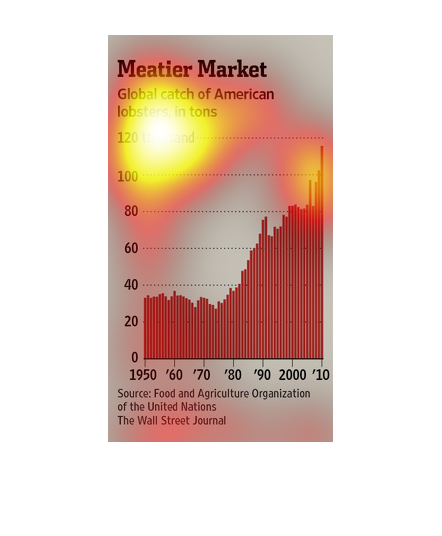
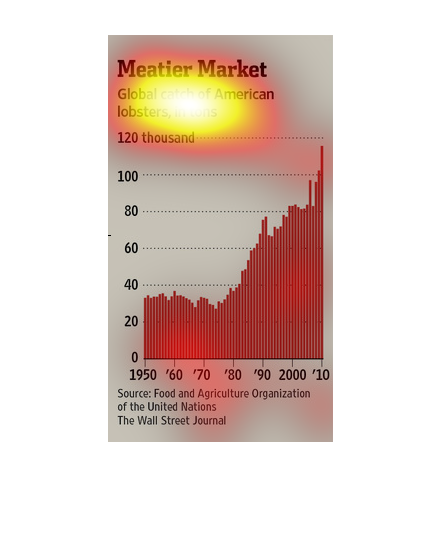
This is a chart with related statistics depicting the global catch, measured in tons, of American
lobsters spanning from the years 1950 through the year 2010.
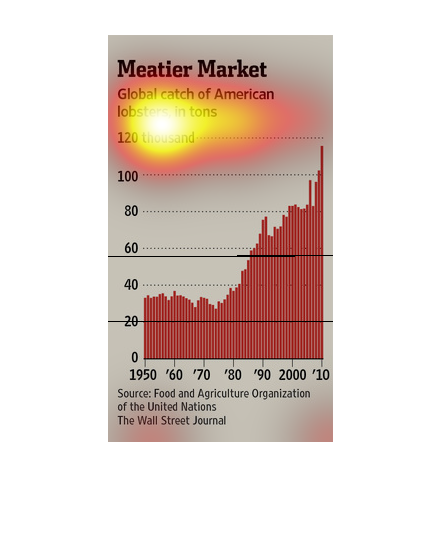
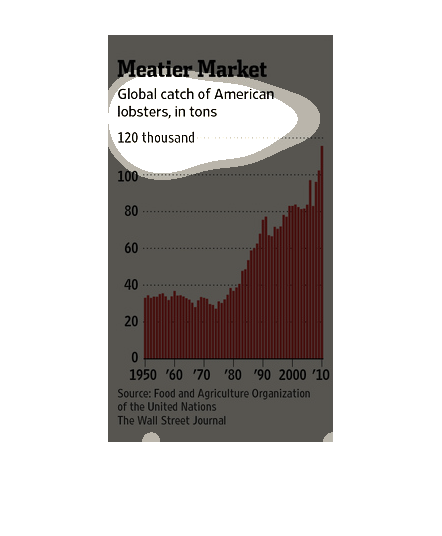
Chart on the global catch of American Lobsters. From 1950 to 2010. Chart show almost steady
amounts from 1950 to the mid 1980's with a sharp increase Between 1990 and 2010.
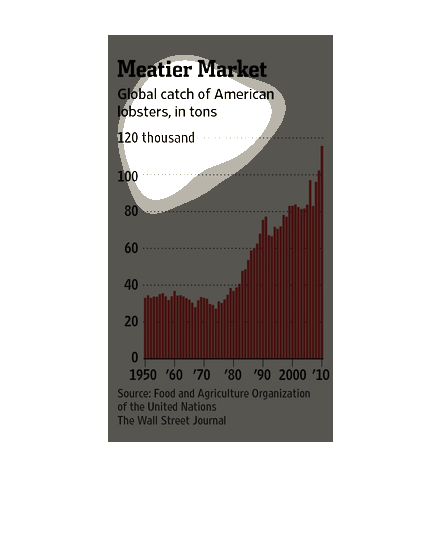
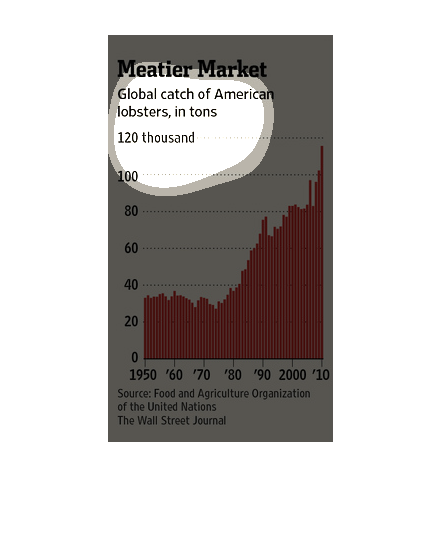
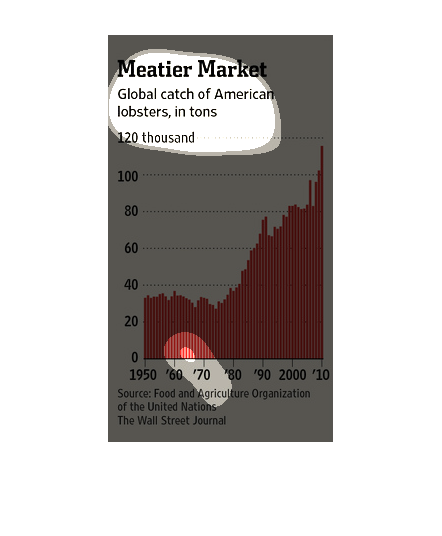
This is a very simple chart which shows lobster catching in the United States of America.
It is in thousands and shows the difference of lobster fishing from 1950 to 2010, lobster
fishing has increased extremely drastically.
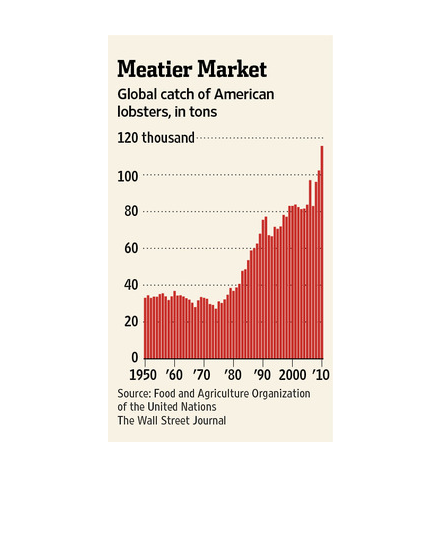
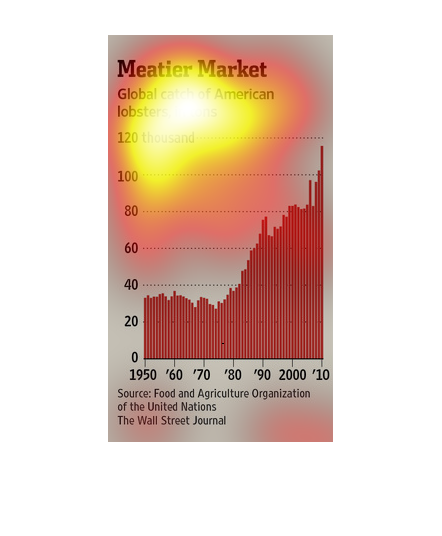
This image shows or depicts in statistical bar graph format data concerning Meatier Market.
Global catch of american lobsters measured in tons. Source is the WSJ.
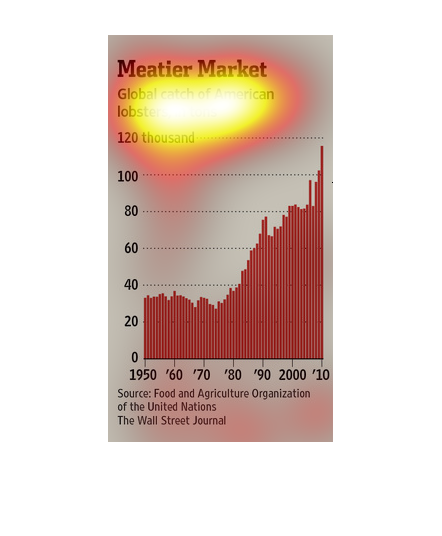
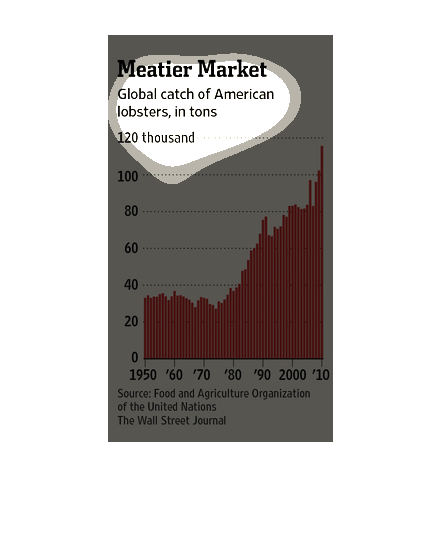
The graph shows the global catching of American lobsters in tons. It starts at 1950 at about
33,000 tons and increases almost every year until 2010 where the graph ends at about 118,000
tons.The midway point is at 1980 with about 40,000 tons.
This graph shows us the Global catch of American lobsters, in tons form 1950-2010. The graph
shows us that the numbers only increased throughout the years reaching almost 120 thousand
tons.
This chart from the Wall Street Journal shows how the lobster catch in the United States is
growing rapidly every year and every year is a new harvest record
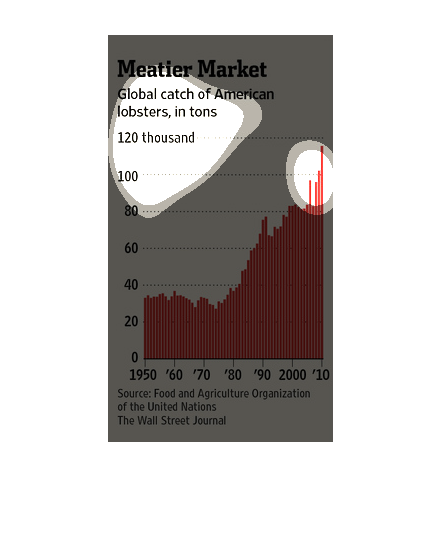
The title of the graph is meatier market. It shows the global catch of American lobsters in
tons. The global catch of lobsters has increased dramatically since the 70s.
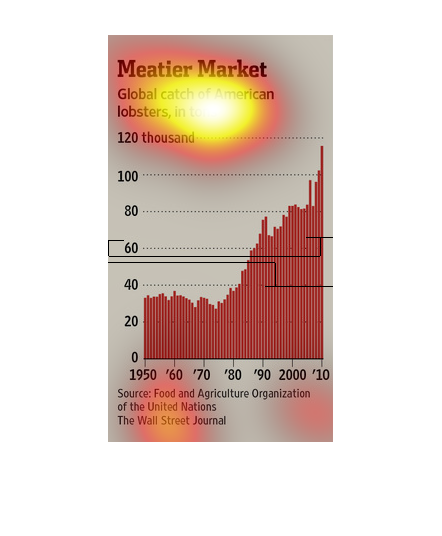
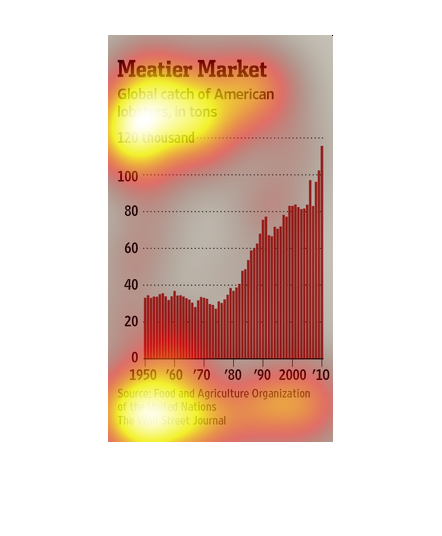
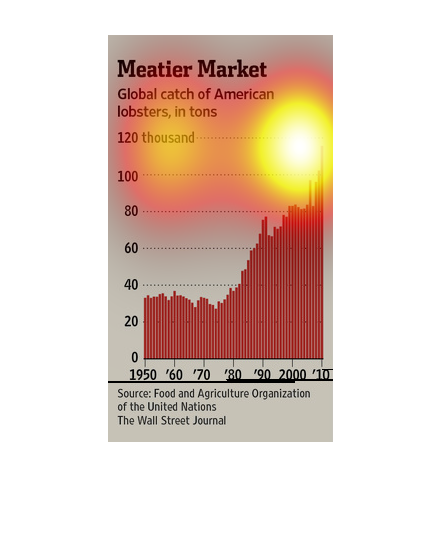
The graphs is titled "Meatier Market".  The graphs illustrates the global catch of American
lobsters by tons.  The time frame of the graph is from 1950 to 2010 and the source of the
information is Food and Agricultural Organization of the United Nations.
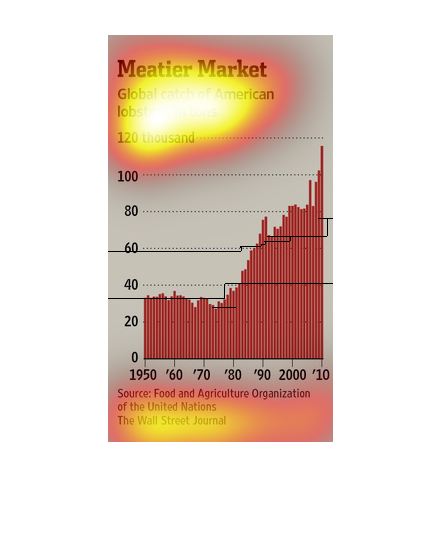
Meatier Market is the name of the company.  This graph represents the growth of the lobster
industry through the decades.  It also indicates the source of the information that is listed.
This chart from the Wall Street Journal shows how the global catch of lobsters in the United
States has grown rapidly over the past few years. it is largest on record