This is a chart based on the television channel NBC's broadcasting of the Olympics. It shows
the time they broadcaster versus the place the Olympics was held.

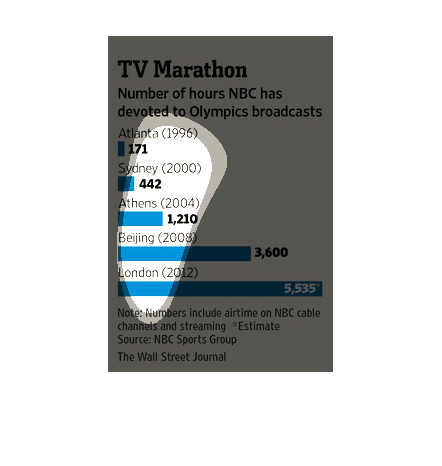
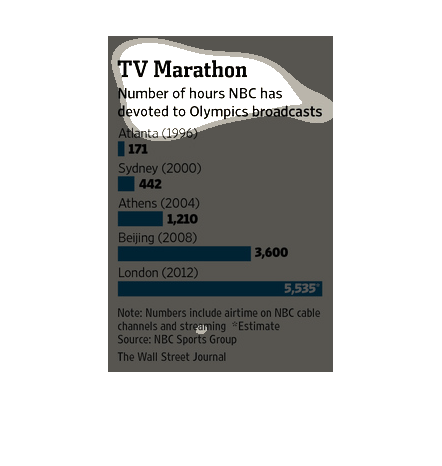
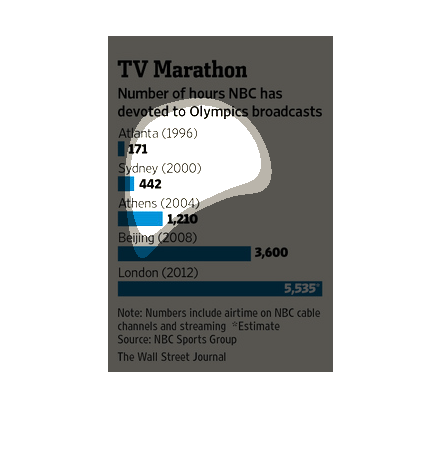
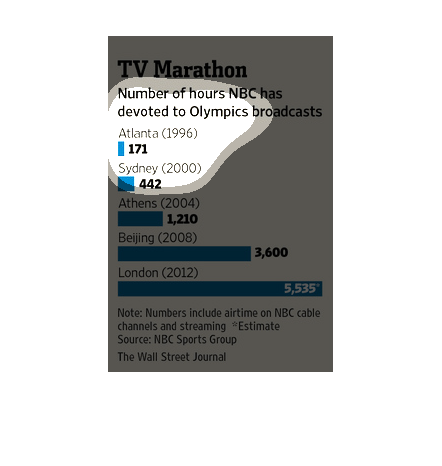
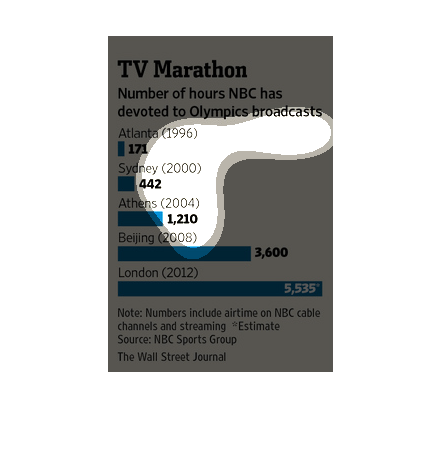
This graph show the number of hours that NBC has devoted to covering the Olympics from Atlanta
in 1996  to London in 2012. A steady increase of hours of coverage has been recorded.
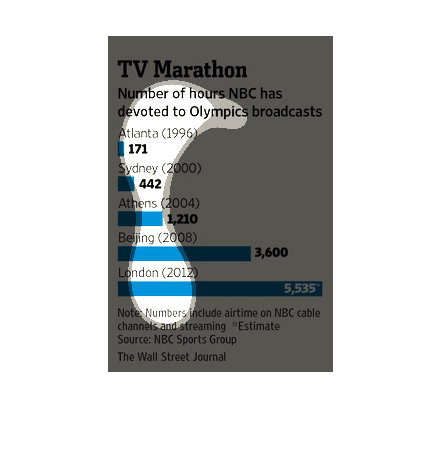
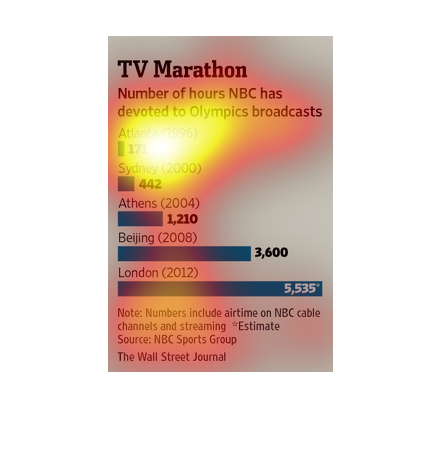
The image shows how NBC has been broadcasting the Olympics since 1996. From 1996 to 2012,
the channel has been increasing its number of hours of broadcasts from 171 to 5535. This shows
a large increase and steady incline of these hours from olympic to olympic
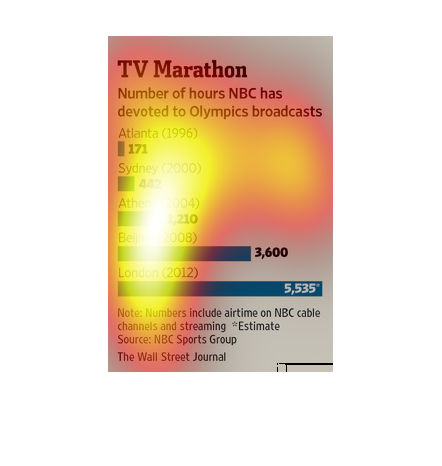
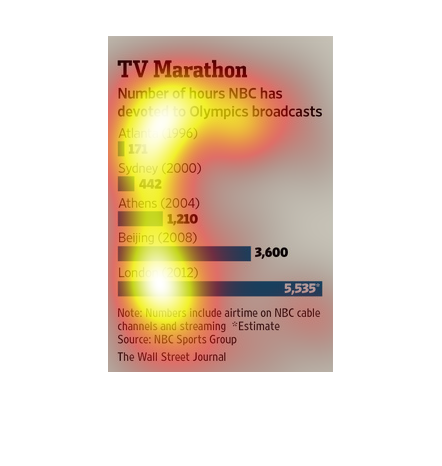
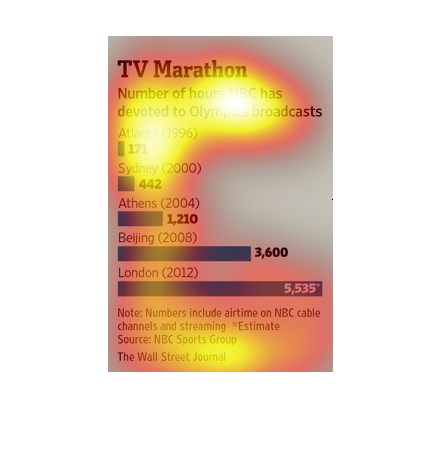
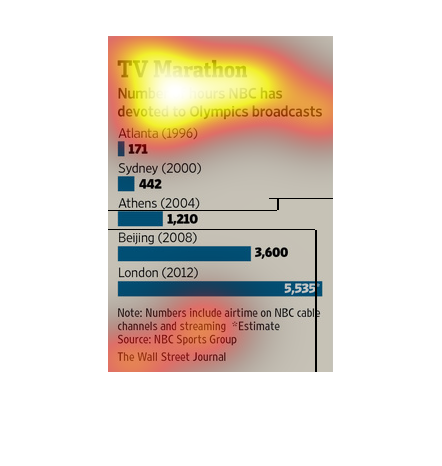
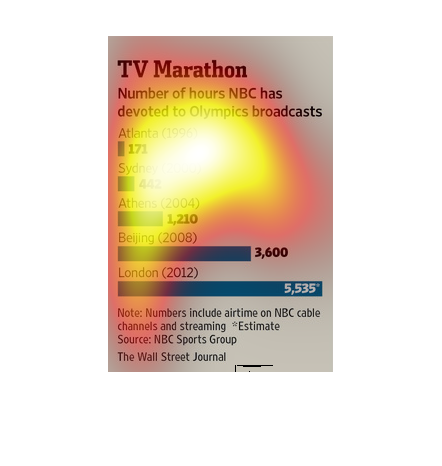
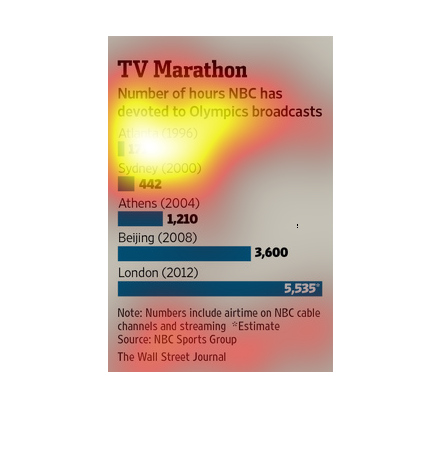
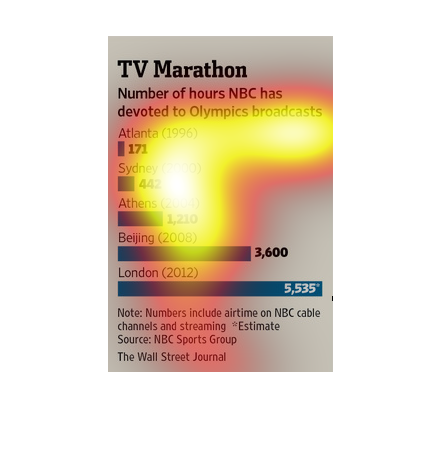
Graph depicting number of hours NBC has devoted to Olympic broadcasts for each Olympic event
in the past 20 years. These numbers include both streaming and live airtime. Atlanta comes
in at 171. Sydney comes in at 442. Athens comes in at 1201. Beijing at 3600. Finally London
at 5535.
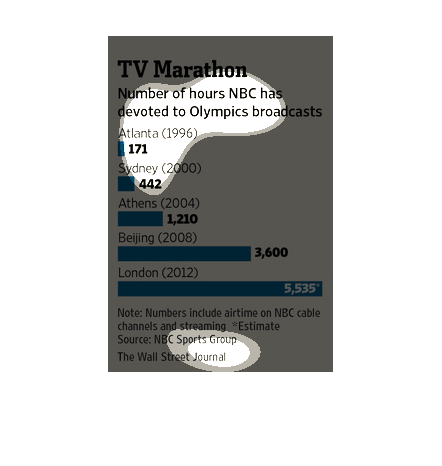
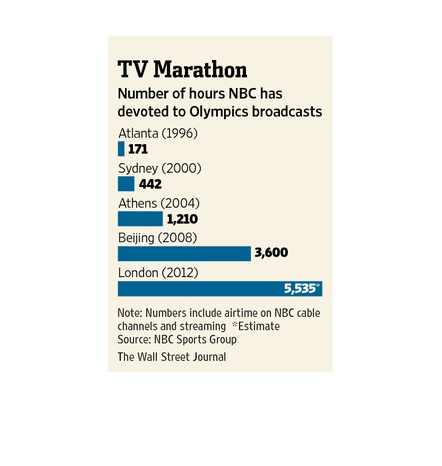
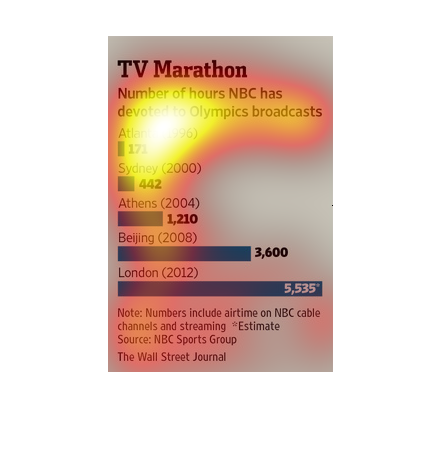
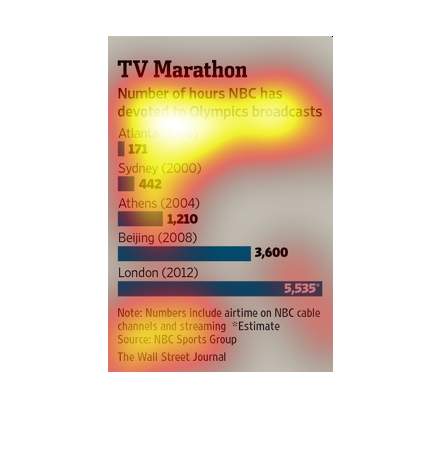
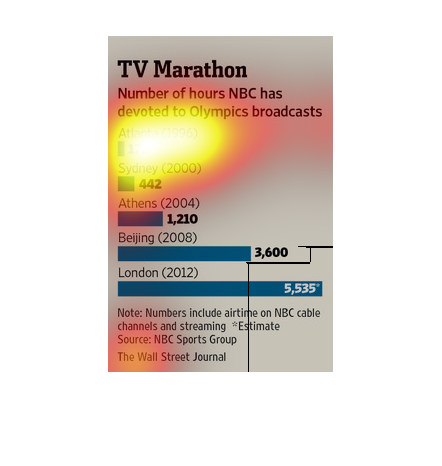
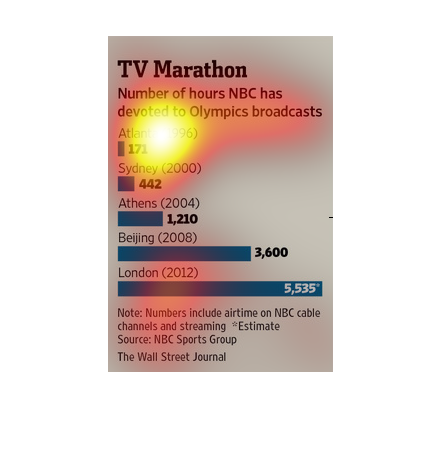
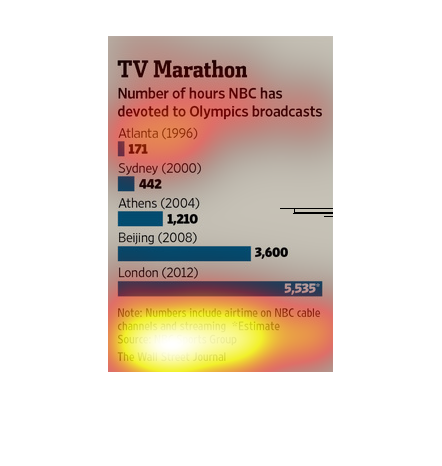
This chart shows the number of hours NBC has devoted to the Olympics broadcast for 1996 -
2012.  NBC broadcast the least amount of hours in 1996 (171 hours) and the highest amount
of hours in 2012 (over 5000 hours).
This chart from the Wall Street Journal shows how NBC networks have allocated time to olympic
coverage over time and how it has increased significantly.
This is a series of  gar graphs and related statistics depicting the number of hours NBC had
devoted to Olympic broadcasting from the years 1996 to 2012.
This chart describes TV marathon. Specifically, number of hours NBC has devoted to Olympic
broadcasts. Categories on the chart include Atlanta and Sydney.
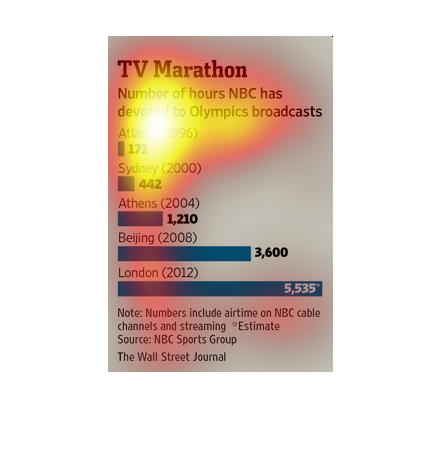
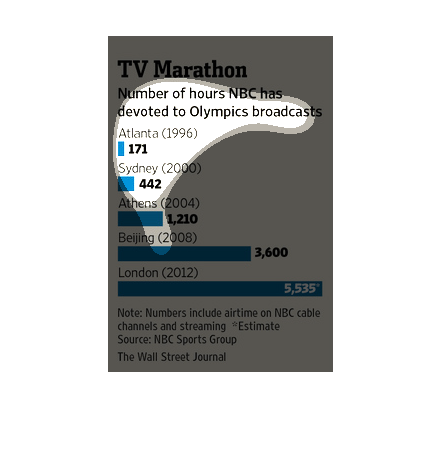
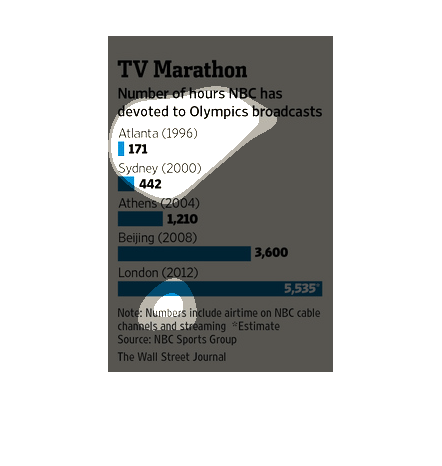
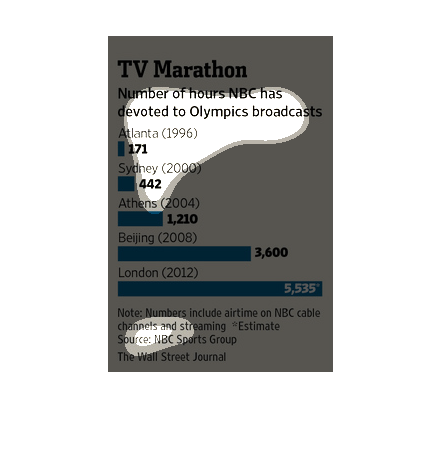
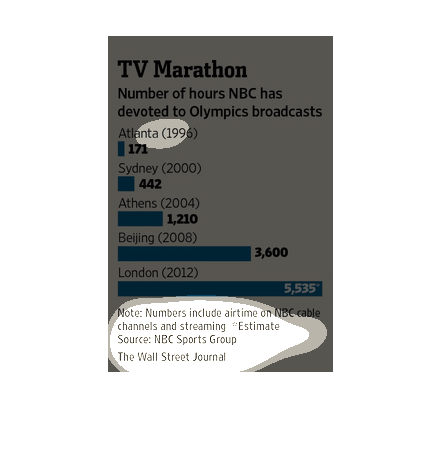
This chart illustrates the number of hours NBC has devoted to Olympic games broadcasts for
Olympic games held in different years and cities with London being the highest on the chart.
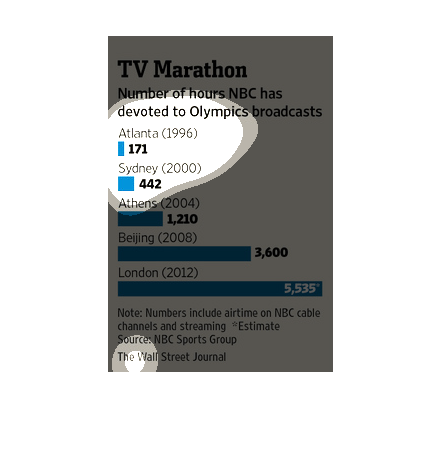
This chart shows the number of hours the tv channel NBC has dedicated to the olympics over
the years, from 1996 to 2012. It features the location of the olympics and the number of hours,
which has increased dramatically overtime.
In a study conducted by the Wall Street Journal- using NBC records- shows that NBC and its
affiliates have ramped up Olympic coverage considerably from 1996 to 2012
This chart shows the amount of hours that nbc dedicated to the Olympic Games. The times are
broken down by the events location. USA had the least amount of time dedicated
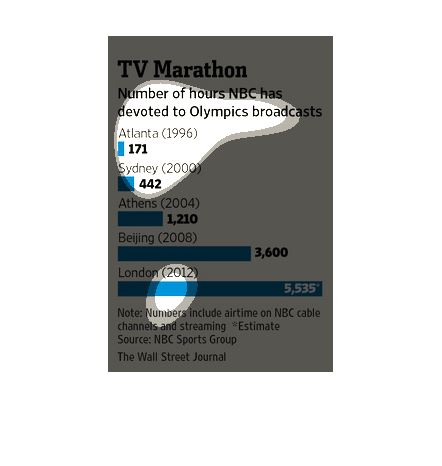
This graph depicts the number of hours NBC has shown the Olympics, from the 1996 Atlanta Olympics
to the 2012 London Olympics.  With the advent of viewing via online streaming, availability
to the viewer has increased significantly.
This chart describes tv marathon. Specifically, number of hours NBC has devoted to Olympic
broadcast. Categories on the chart include Atlanta and Sydney.