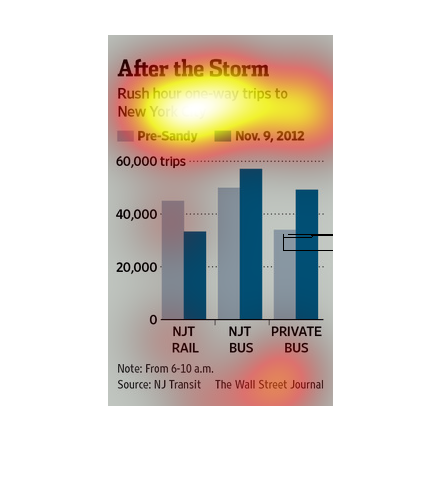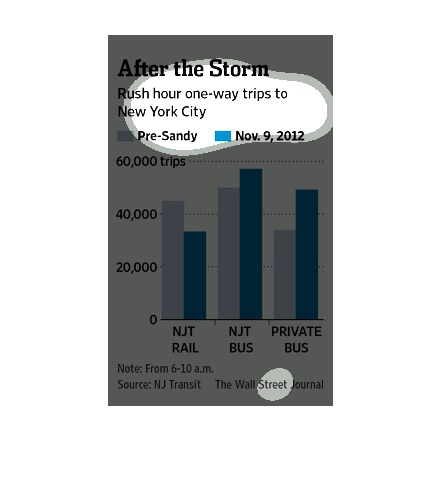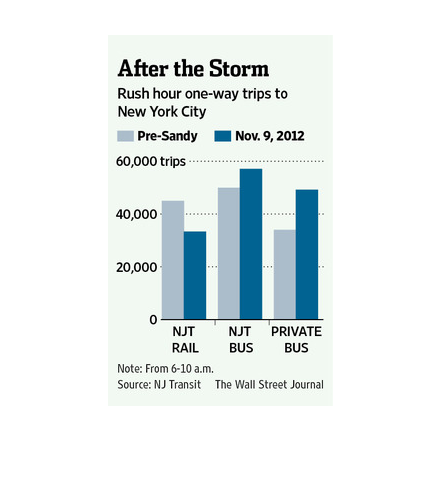
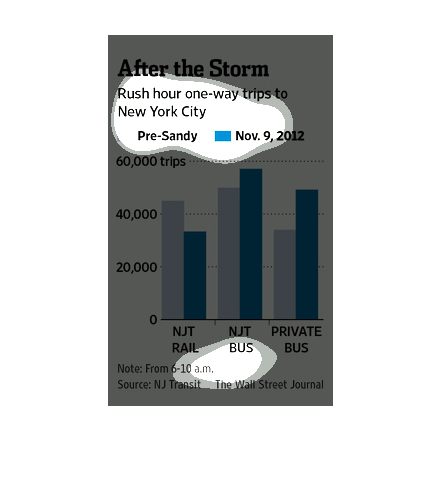
The chart shows the growth of the different modes of transportation used for rush hour one
way trips to New York City after the hurricane Sandy. NJT Bus remains the most popular transport
mode, and it saw a significant uptick of usage after the storm. Private bus also increased,
surpassing the 40,000 trips line. There was a decrease in the usage of NJT Rail after Hurricane
Sandy.
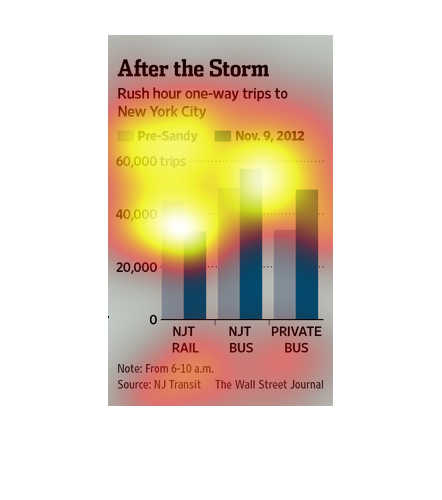
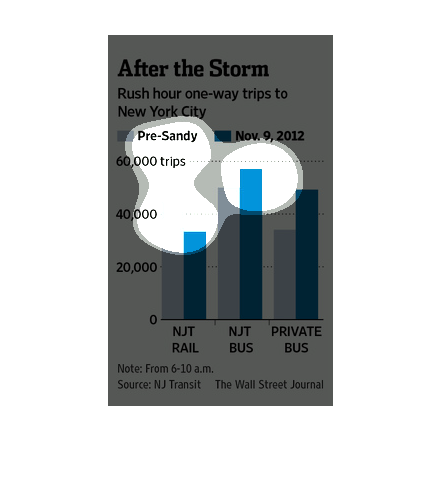
This is a series of bar graphs with related statistics depicting the number of rush-hour one
way trips to New York City separated by route and public/private flights.
This chart shows the number of daily one-way trips to New York City during the morning rush
hour before and on November 9, 2012, after Hurricane Sandy. The chart breaks down the trips
by rail, bus and private bus and shows that rail trips decreased after Sandy but bus trips
increased.
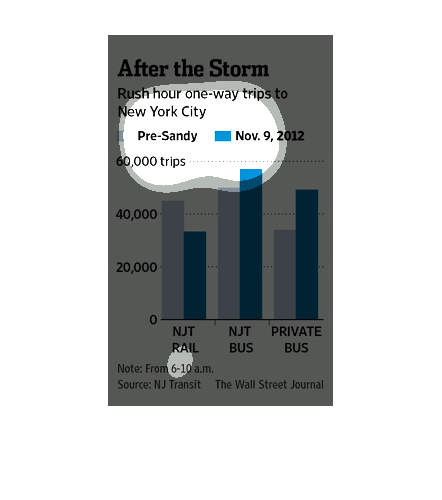
This chart from the Wall Street Journal shows how rush hour trips on the new york city subway
lines have increased despite hurricane sandy and other natural disasters
This chart compares rush hour trips via different forms of transit into New York City before
Sandy and Nov 9, 2012. More people took the rail before Sandy than after, and more people
took a bus after Sandy than before. There were almost 60,000 trips via NJT bus on Nov 9, 2012.
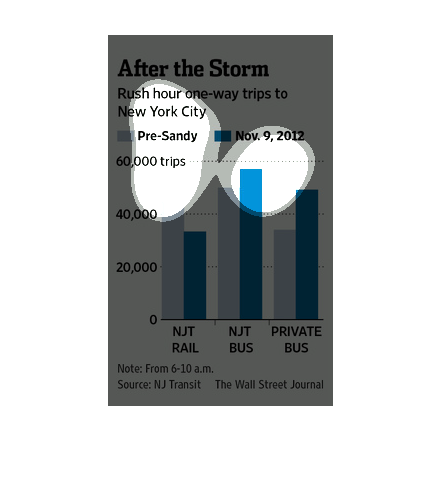
After the Storm | Rush hour one way trips to new york city. More people started taking Public
and private busses after Hurricane sandy as seen in this bar graph.

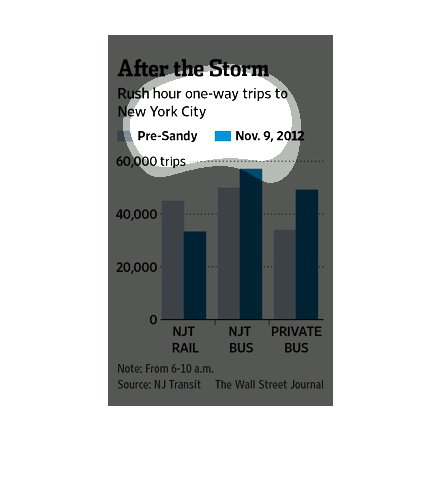
This image shows how the number of rush hour one way trips to New York city increased dramatically
after Hurricane Sandy. Methods of travel include NJT Rail, NJT Bus, and private bus.
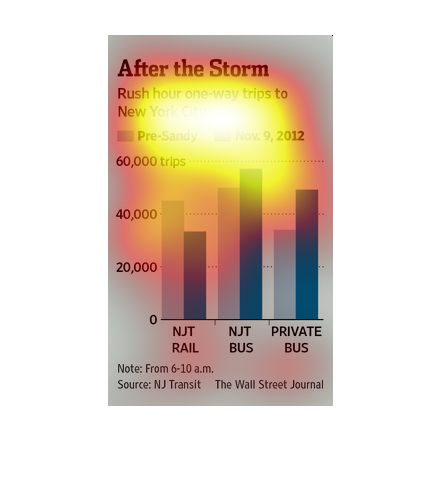
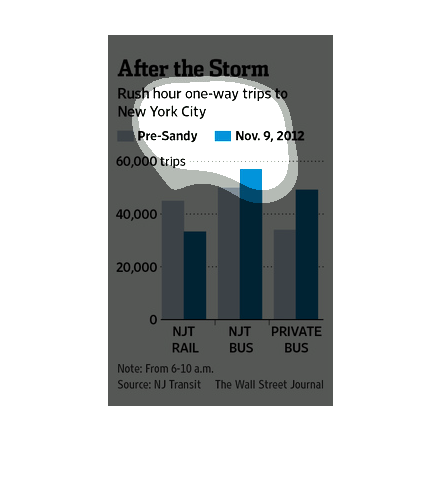
This chart describes after the storm. Specifically, rush hour one-way trips to New York City.
Categories on the chart include New Jersey Transit Rail and private bus.
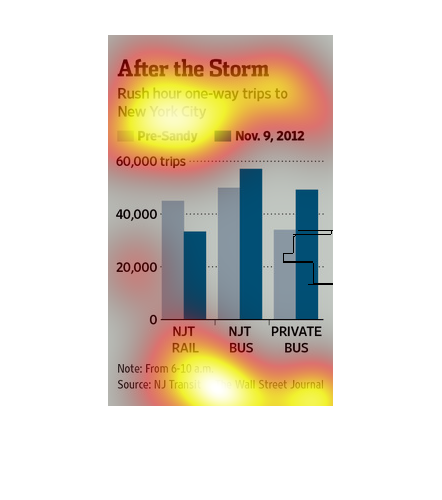
This graph describes rush hour one way trips to New York City pre-Sandy and on November 9th
2012.  It has columns for NJT rail, NJT bus, and private bus.
This chart from the Wall Street Journal shows how the number of rush hour trips in New York
City has started to decrease since the superstorm Sandy.
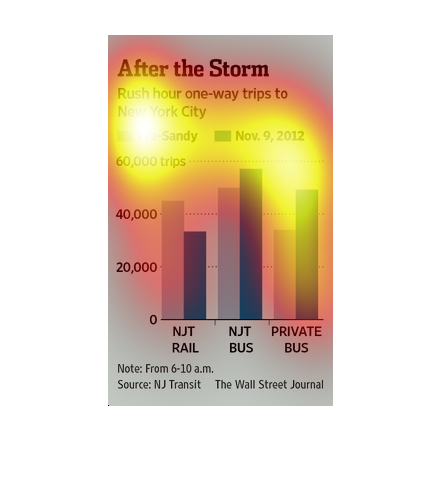
The image depicts the rush-hour one way trips to New York City, pre-natural disaster and post.
Trips increased post-natural disaster across multiple transportation methods.
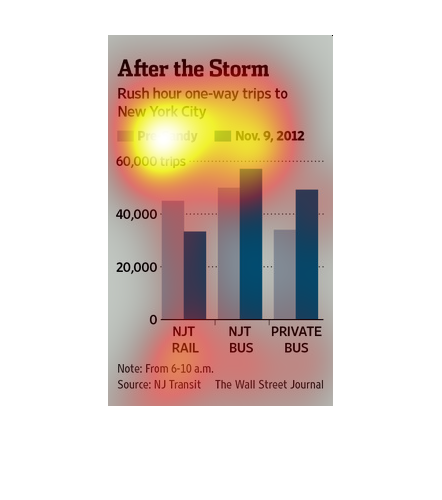
This graph is a bar graph and its small in size the name of this bar graph is called. After
the storm. This graph us from November 2012 and the colors are.
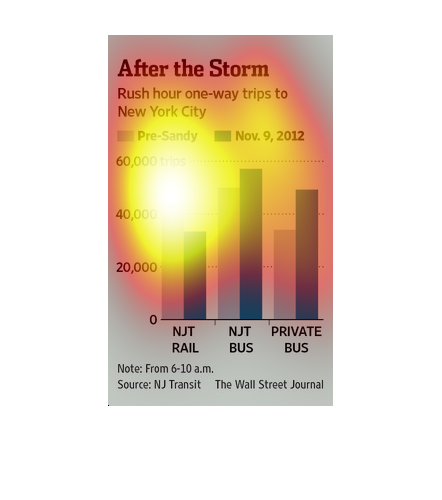
This chart describes after the storm. Specifically,rush hour one way trips to New York City.
Categories on the chart include New Jersey Transit Rail.