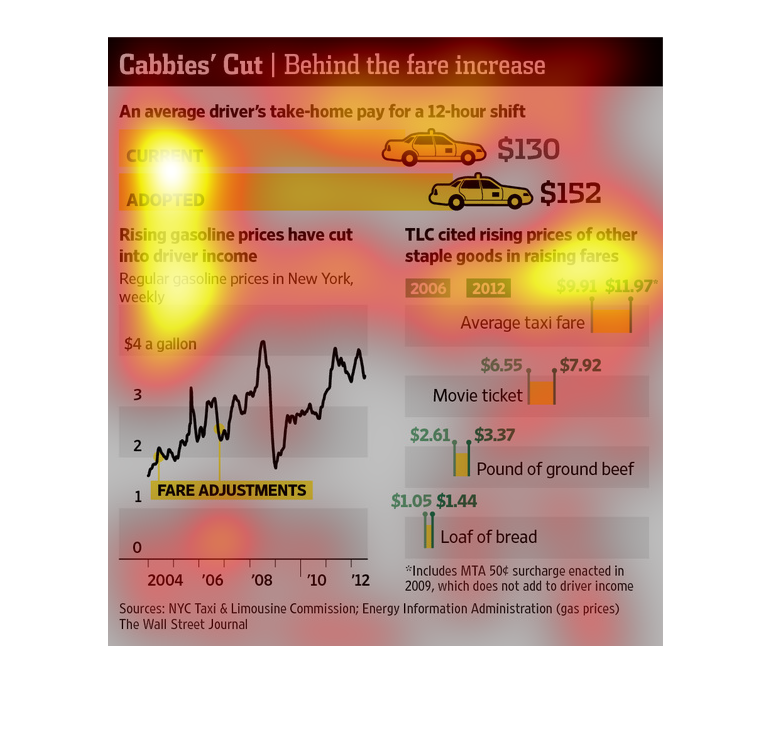
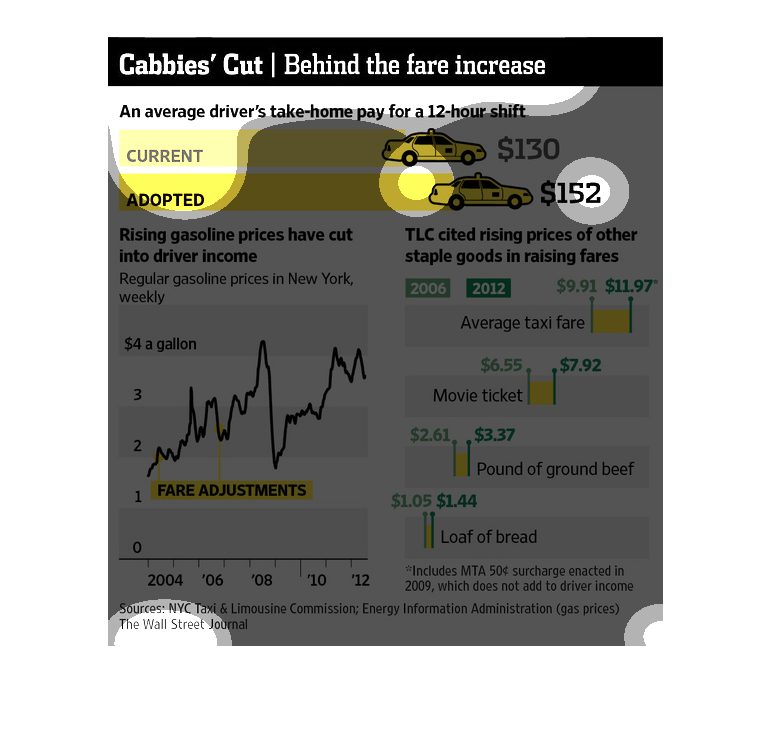
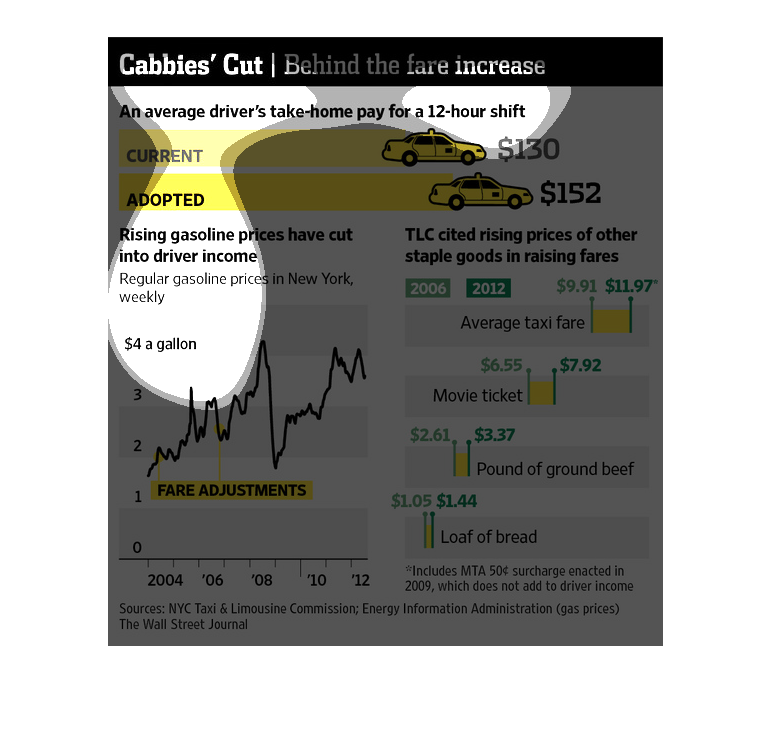
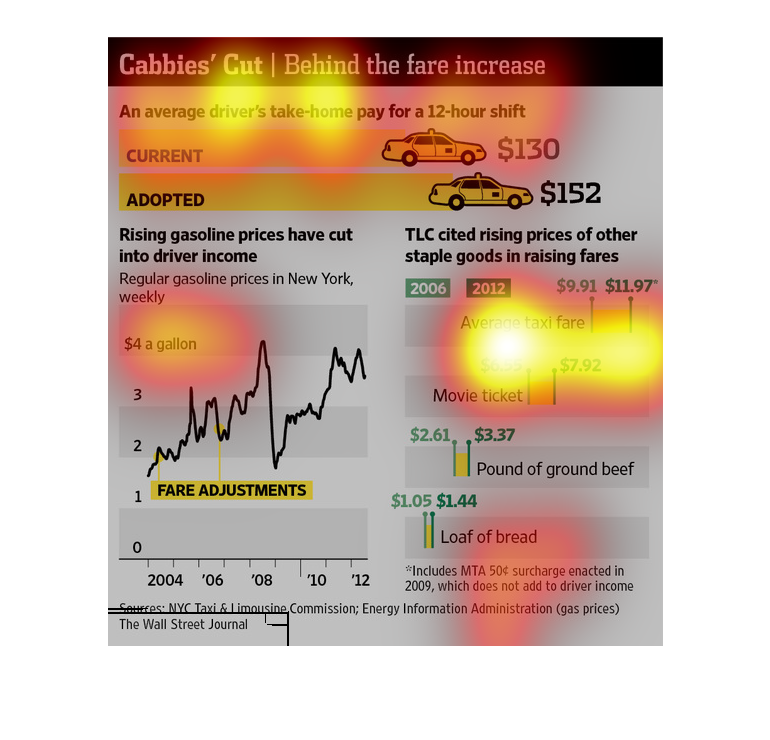
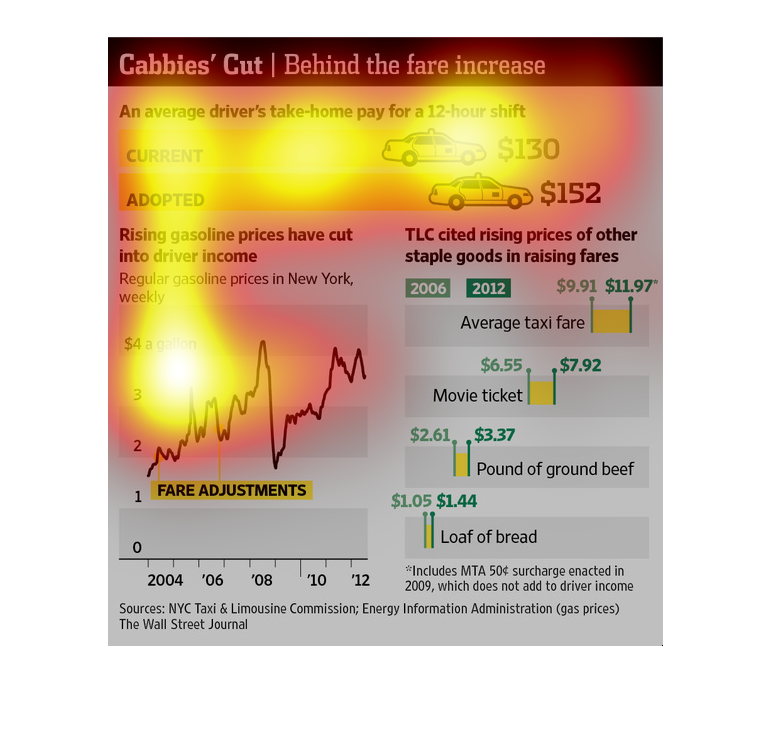
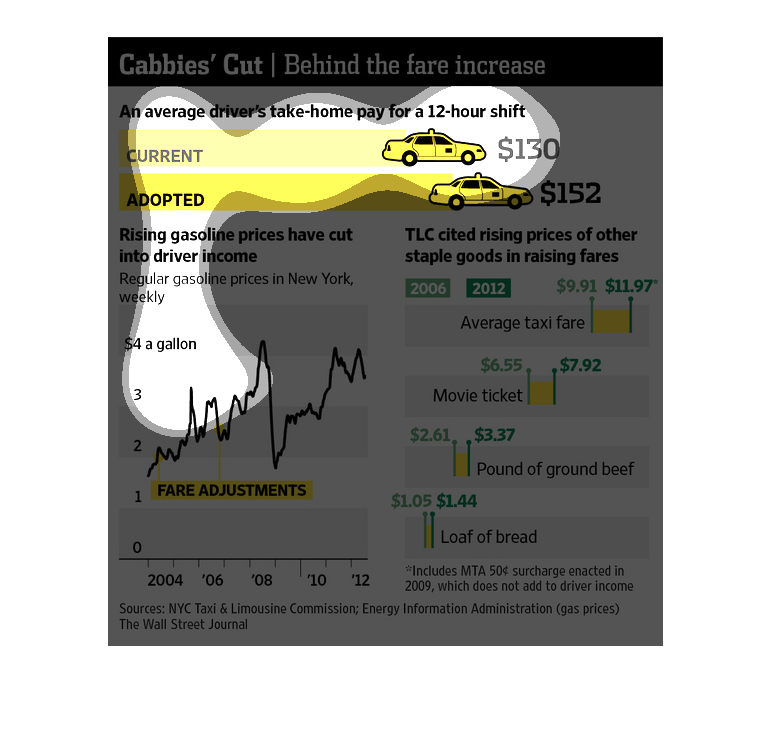
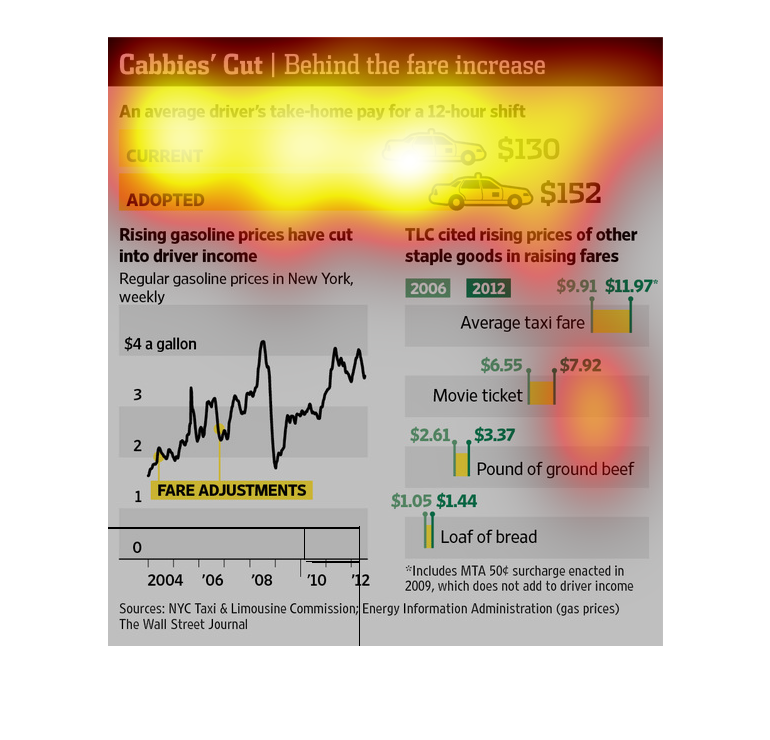
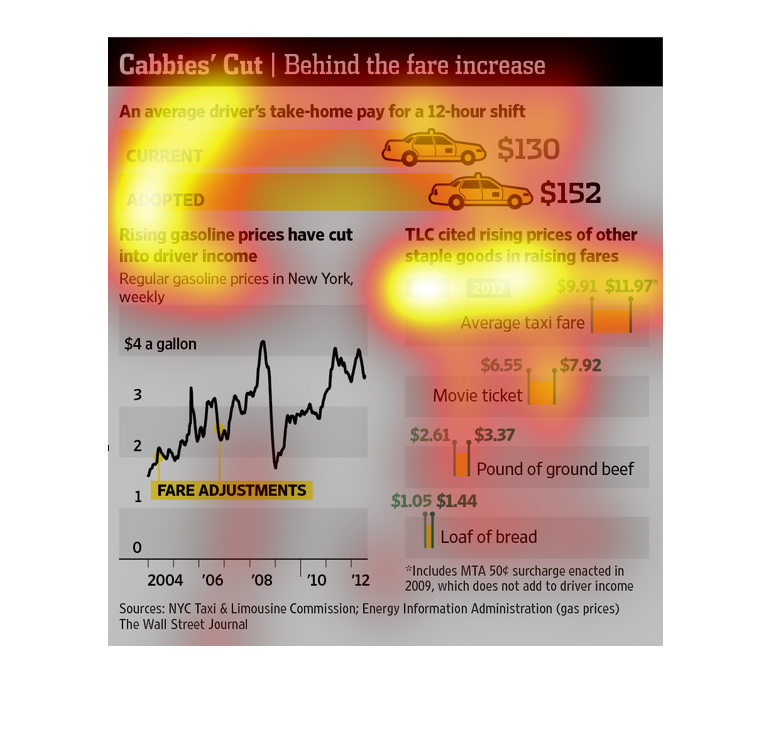
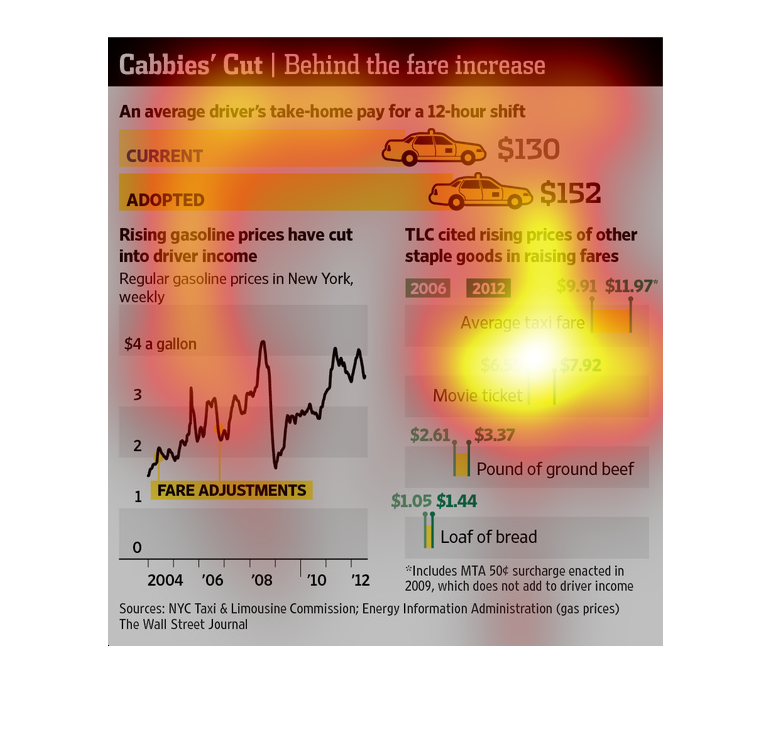
The image cites the data behind the fare increase by cab companies. Individual cabbies take-home
pay for 12 hours of work will increase from $130 to $152. Gasoline prices are cited and taken
into effect, as well as other goods rising in prices in comparison to cab fares.
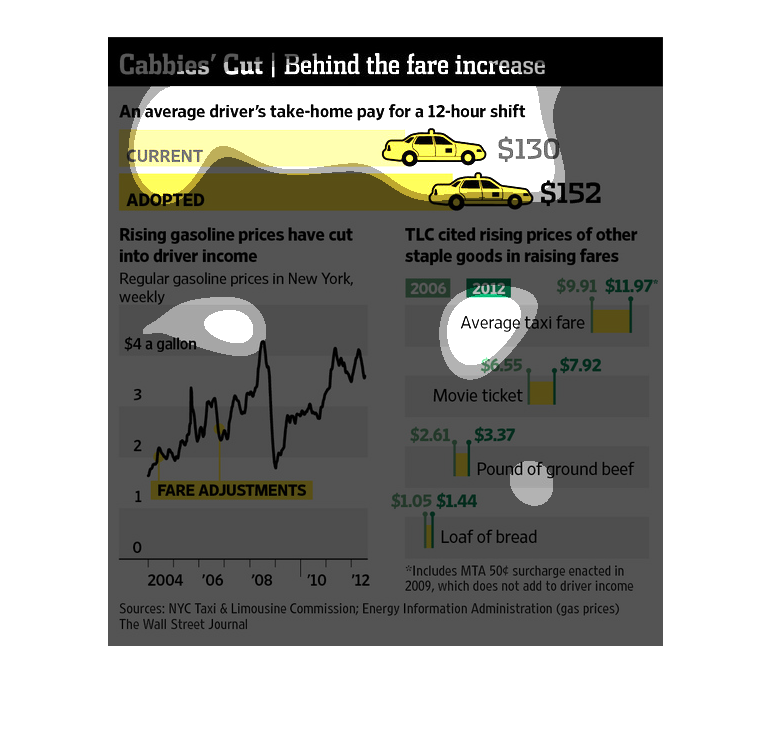
According to the NYC Taxi & Limousine Commission, the Energy Information Administration, and
The Wall Street Journal, rising gas prices have cut into taxi driver income. Drivers typically
make $130.00 for a 12-hr shift. A proposed increase in fares, due to a rise in other consumer
goods, such as movie tickets, bread, and ground beef, would increase a taxi driver's take-home
pay to $152.00 per 12-hr shift.
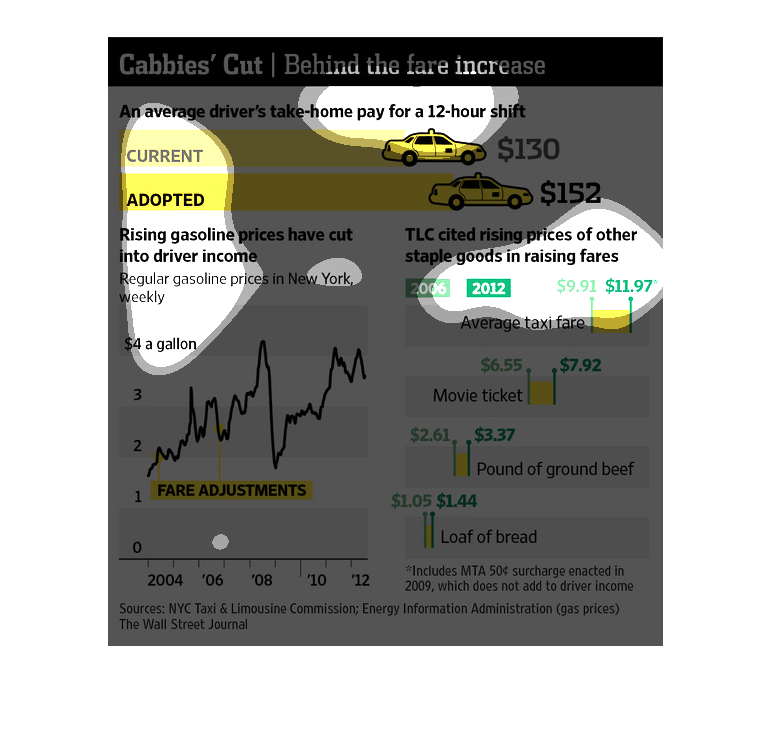
This chart from the Wall Street Journal shows how the cab drivers change in income is affected
due to the increase in rates paid to cab drivers
This is information about cab drivers in new york and how much money that they are able to
earn in a twelve hour long shift. There are graphs showing more information about this.
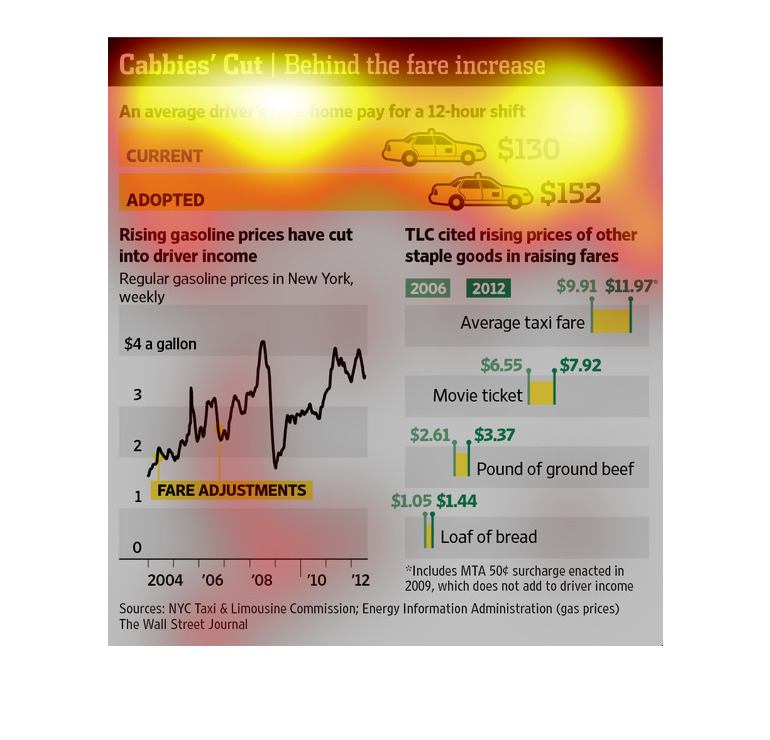
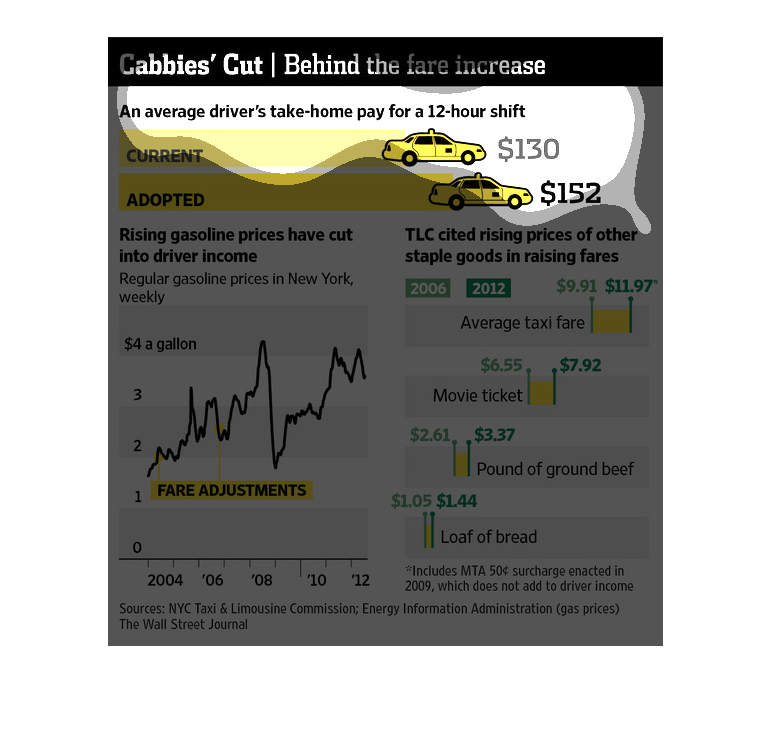
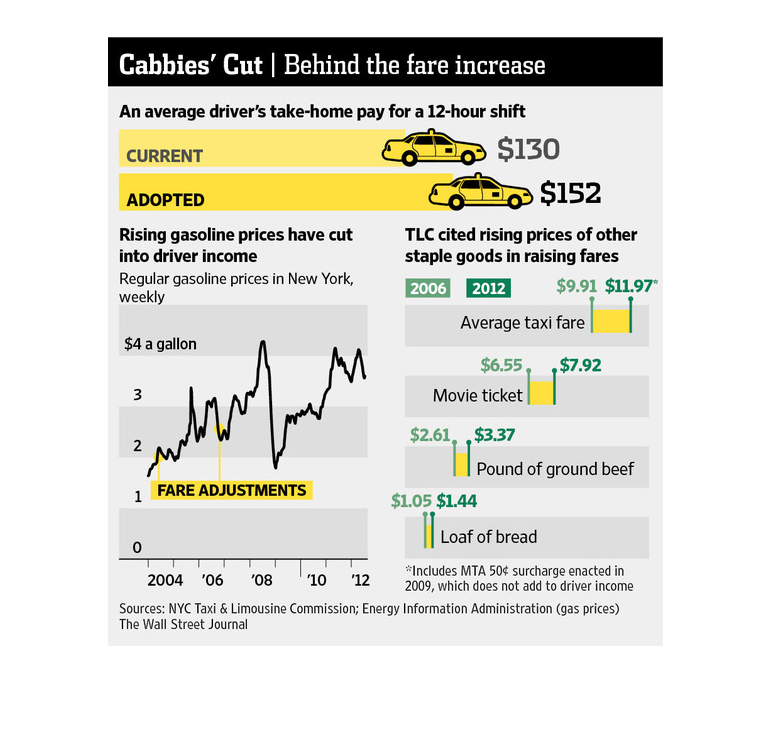
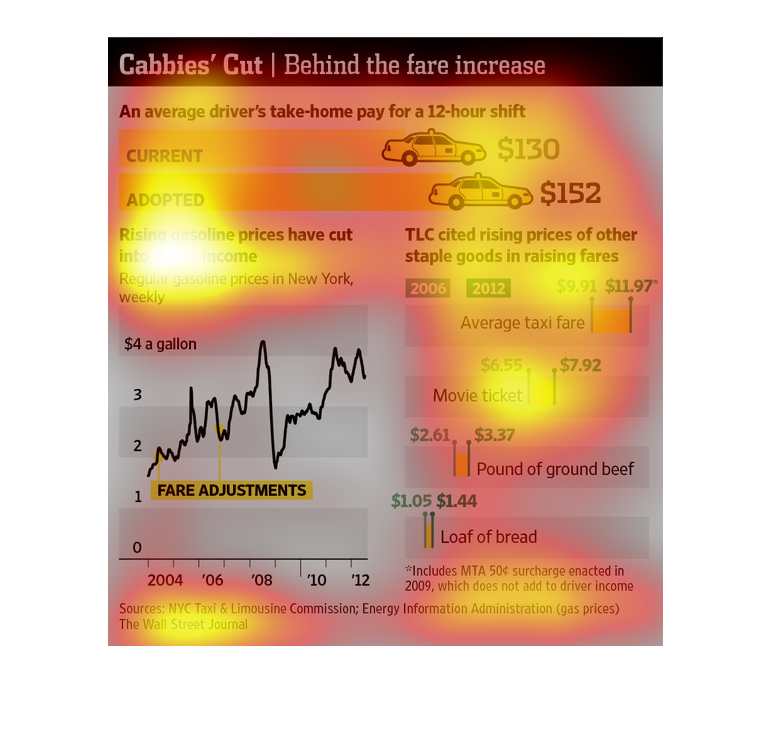
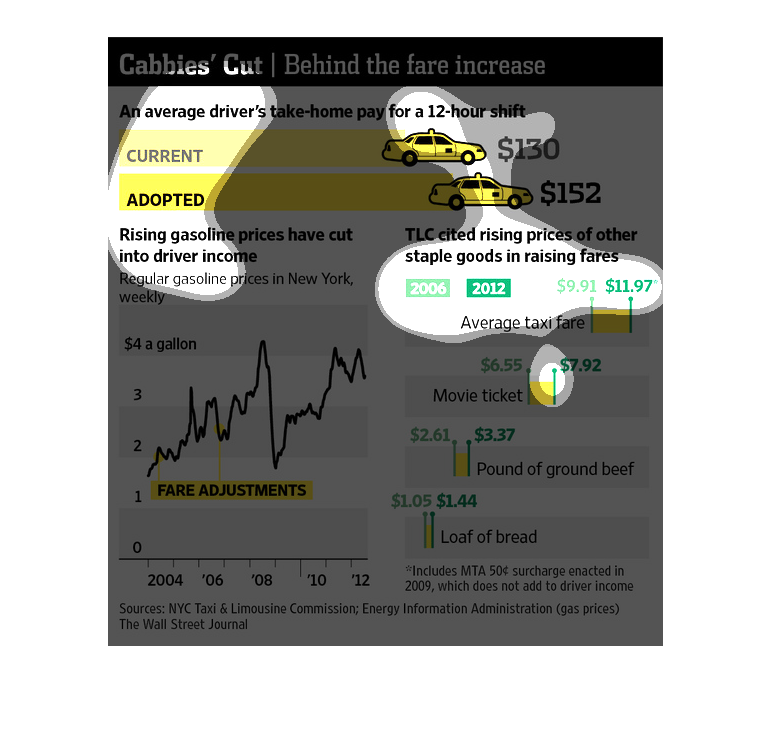
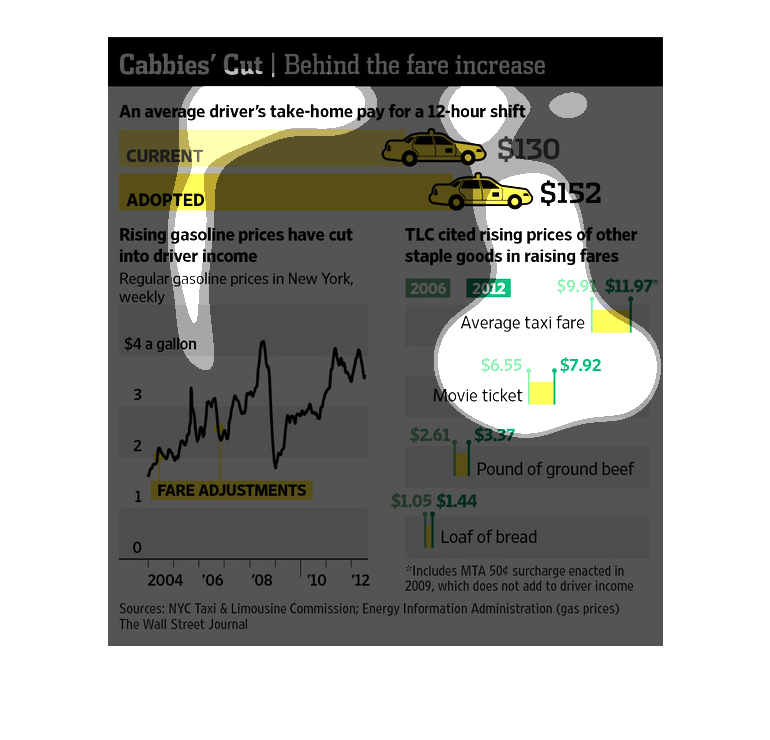
This chart describes cabbies' cut. Specifically, behind the fare increase. Categories on the
chart include current and adopted. The chart includes illustrations.
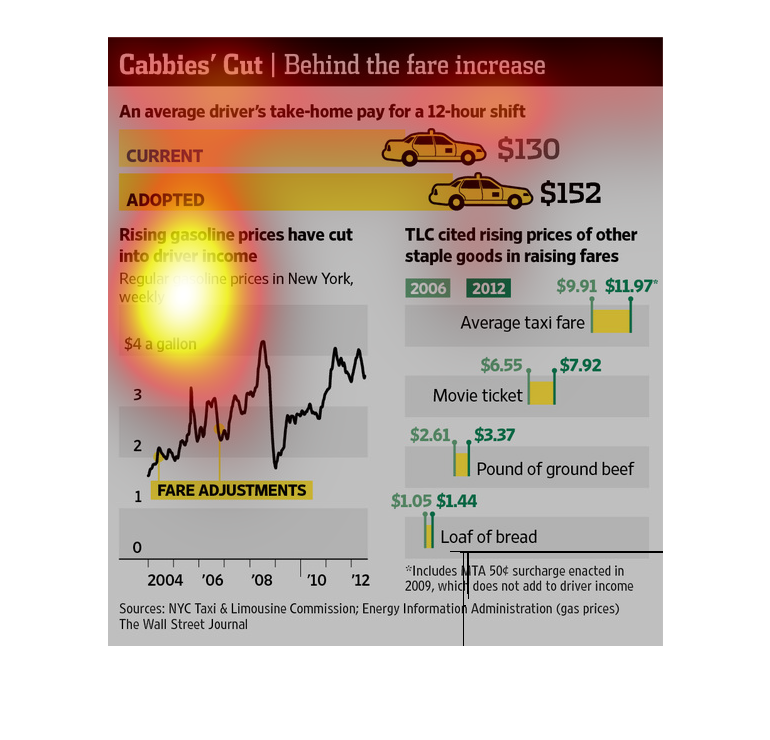
This chart illustrates the philosophy behind the fare increase in cab fares.  It details average
driver take home pay, rising cost of gasoline, and rising price of other staple goods.

This chart clearly displays the average pay for a cab driver's twelve hour shift. The chart
shows how the rise in gasoline prices have lowered the driver's income.
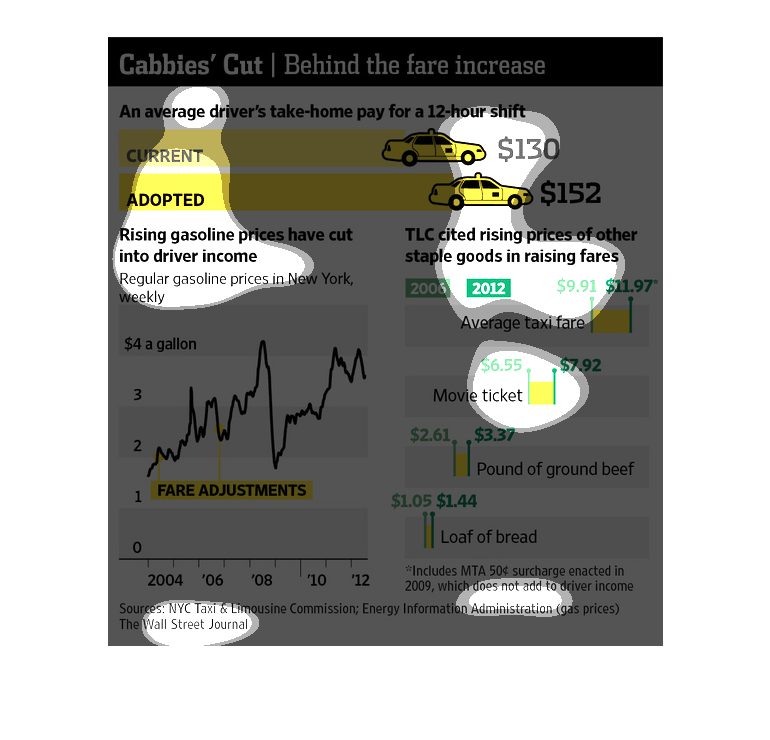
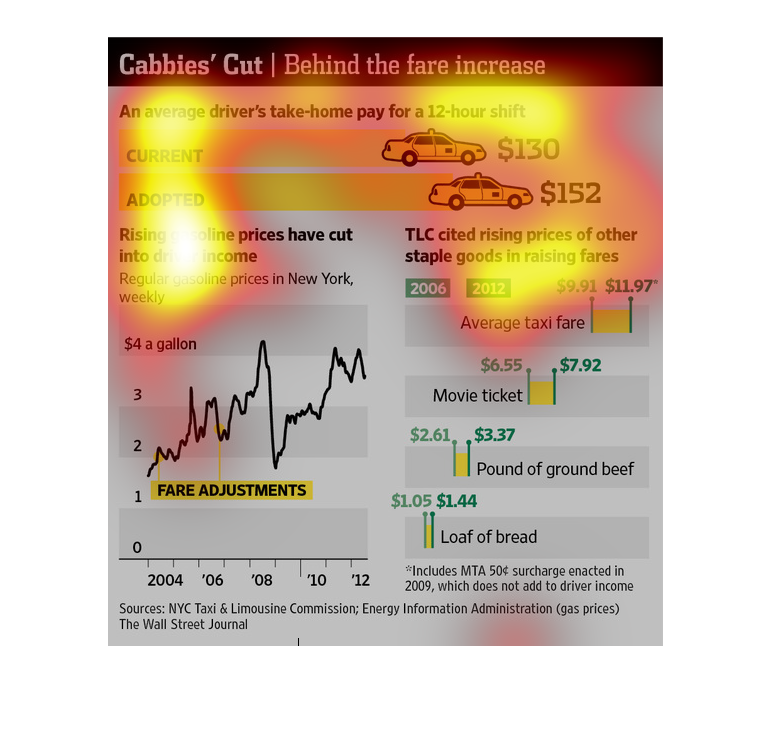
This chart describes cabbies' cut. Specifically, behind the fare increase. An average driver's
take-home  pay for a 12 hour shift.The chart contains illustrations to enhance the information
presented.
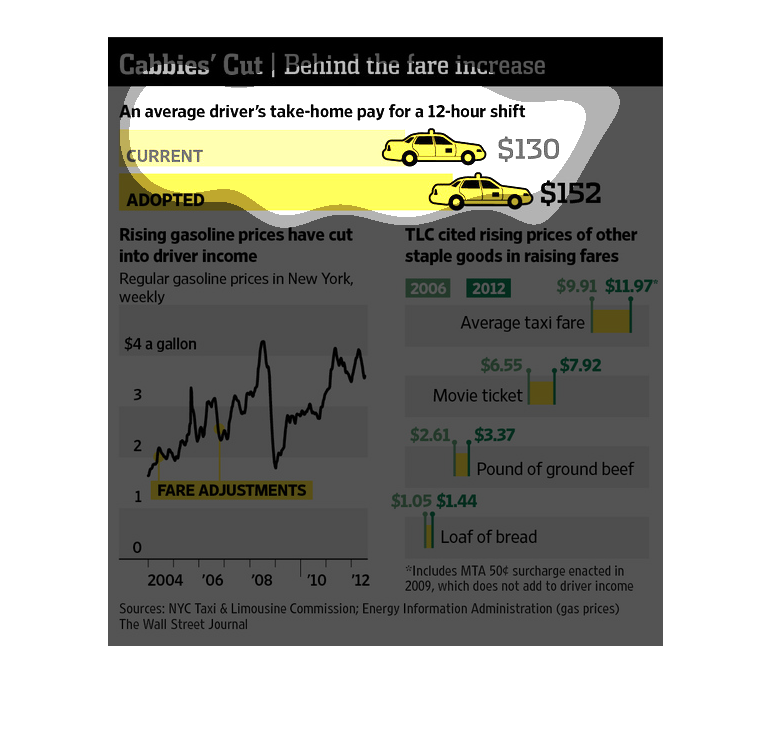
This chart from the Wall Street Journal shows how the increase in the minimum cab rates for
drivers in New York are trickling down to the actual driver
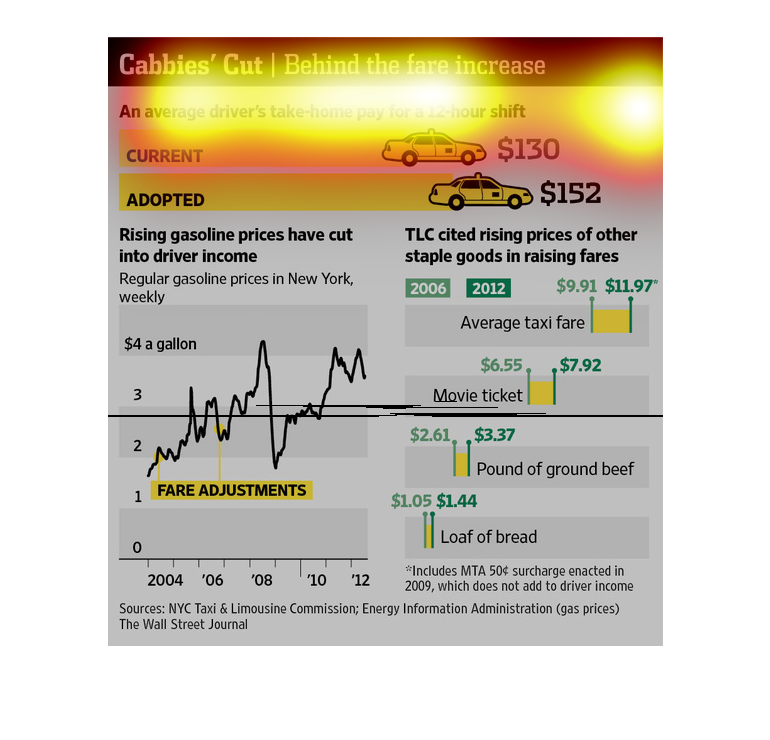
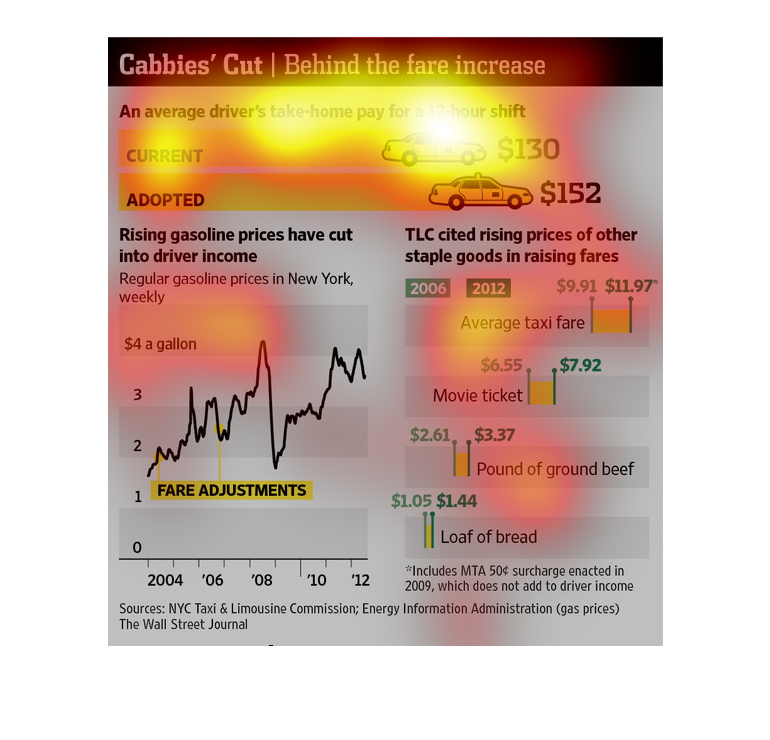
This image describes the reasoning behind cab drivers fare increase based on take home pay
they receive, rising gasoline costs, and other goods that have risen in cost.
The title of the graph is Gabbie's cut: Behind the fare increase. It shows that taxi cab employers
are paid around 130 dollars for a twelve hour shift.
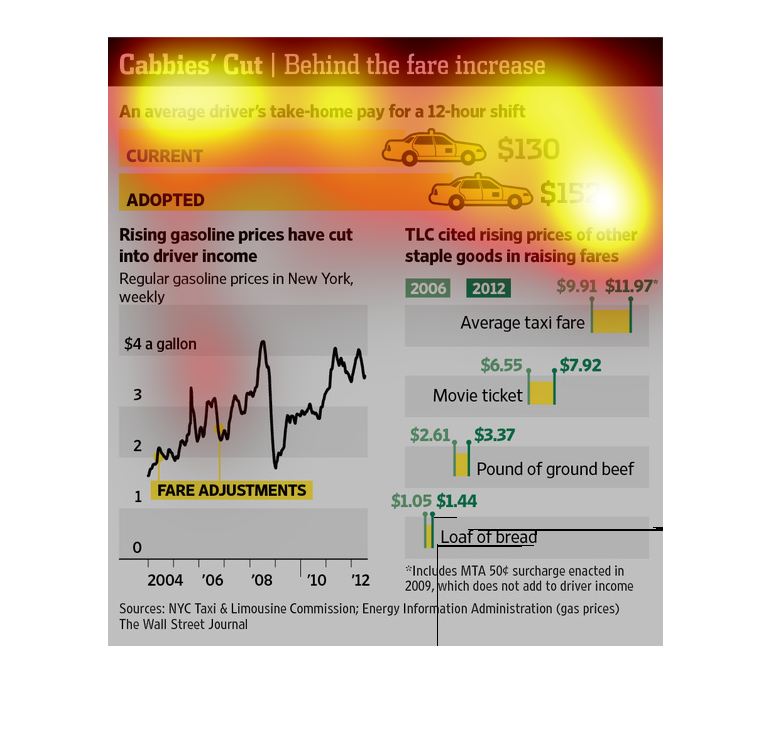
The caption for this poster is, "Cabbies Cut, Behind the fare increase".  There's an image
of two cabs in front of yellow bar graphs extending to the right.  The graphic of one cab
displays current or at the time cab fares.  The other graphic displays the newly adopted fare
which is more than the current at the time price.  There's also a graph charting rising fuel
costs and yet another graph listing other contributing factors to the rise in fares.
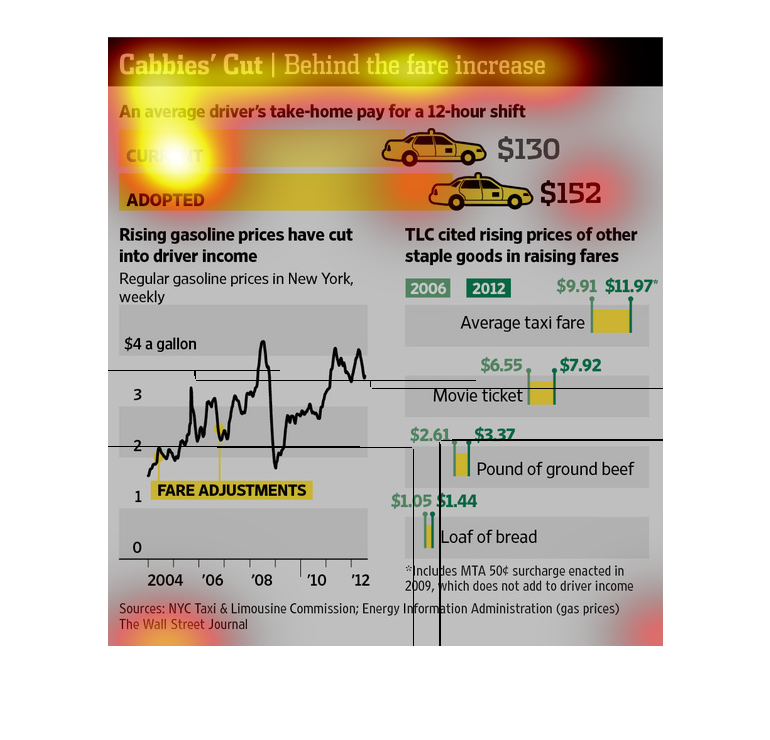
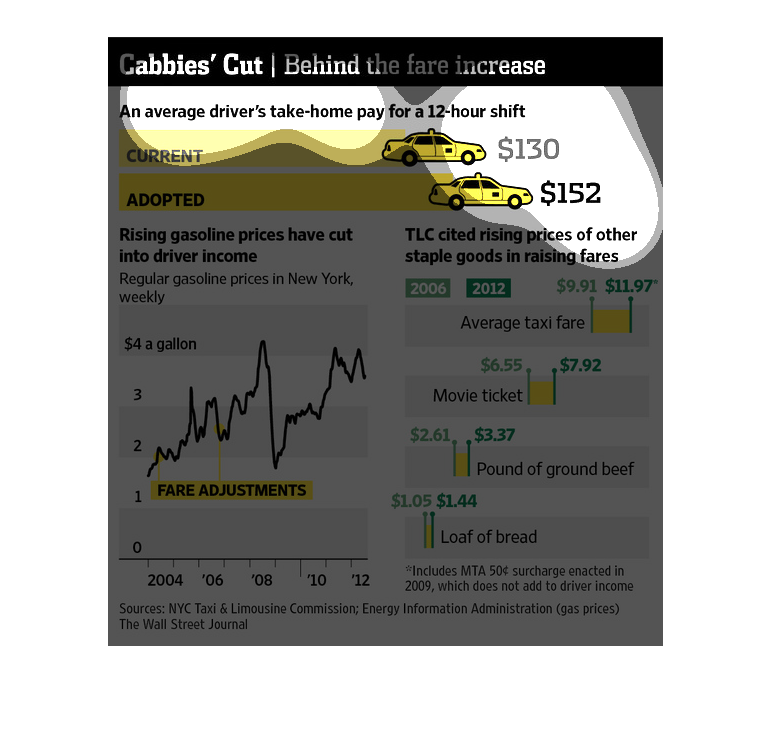
This is a series of diagrams, charts and related statistics depicting the average taxi cab
driver's take home pay after a twelve hour long shift in New York City.
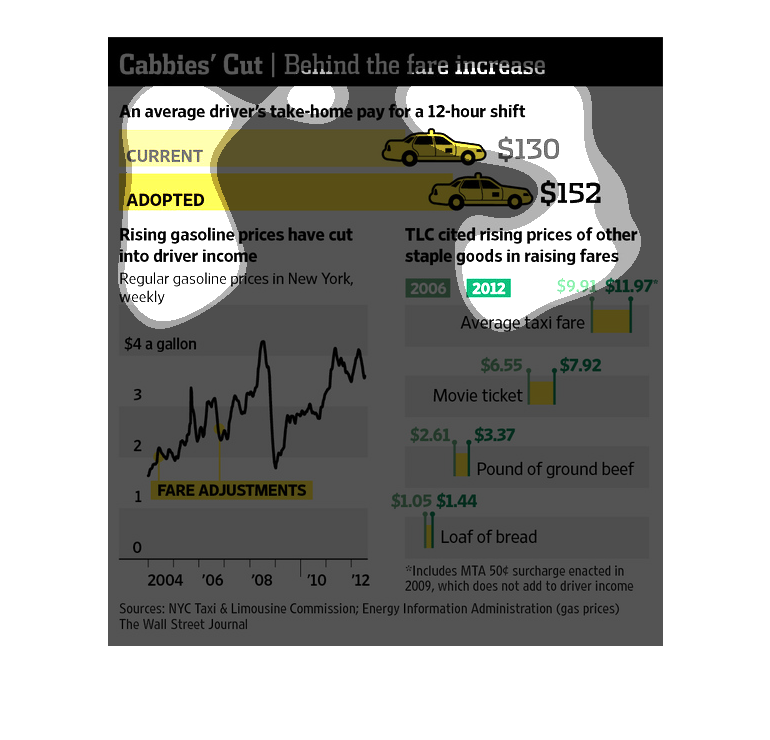
This graph illustrates factors that go into increasing cab fares such as take home pay, increasing
gasoline price, and rising prices of other staple goods.
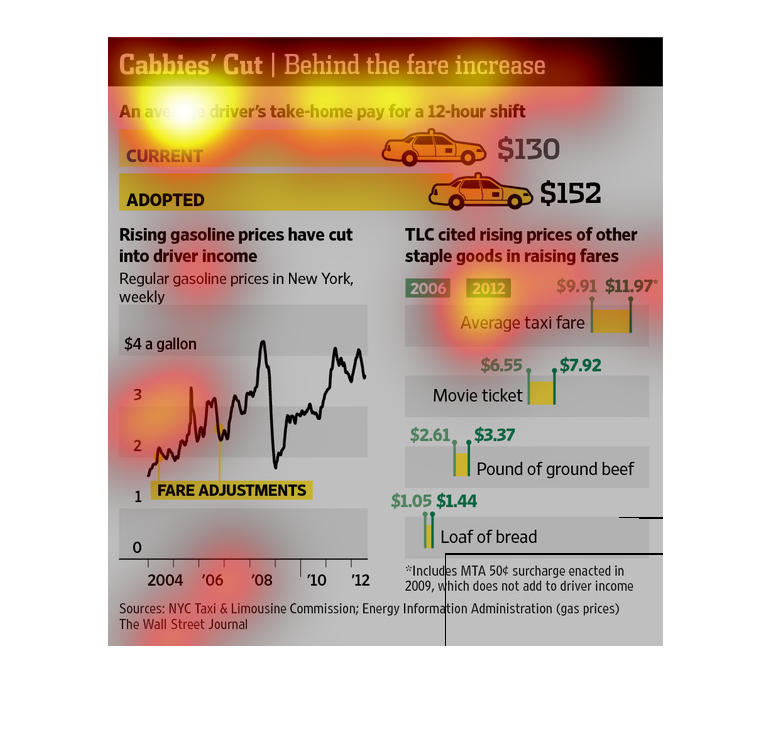
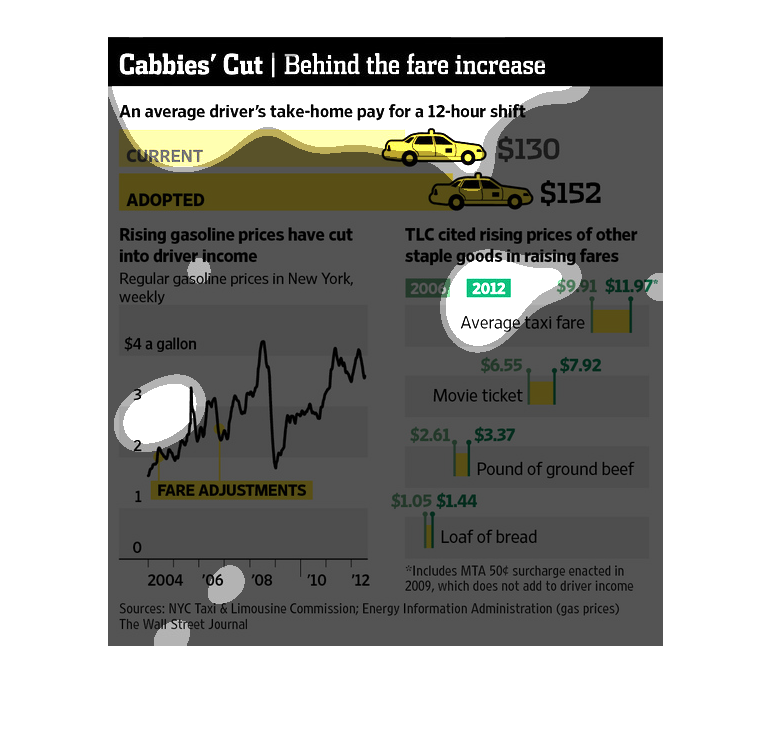
This image describes how much cab drivers get paid.  Under a new proposal, cab driver's take
home pay will increase.  Fares have also increased since 2006.  Increases in gas prices and
other staple goods have decreased cab driver's current take home pay.