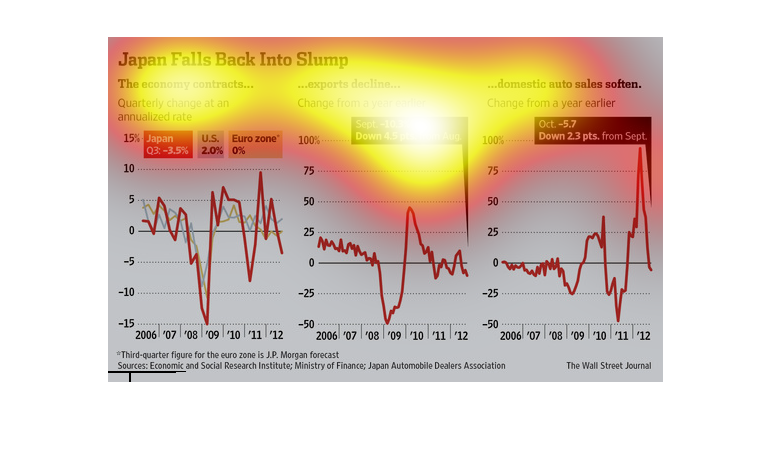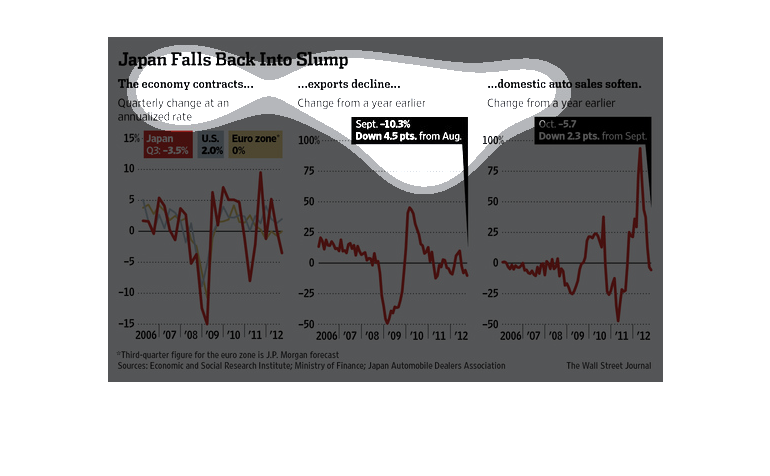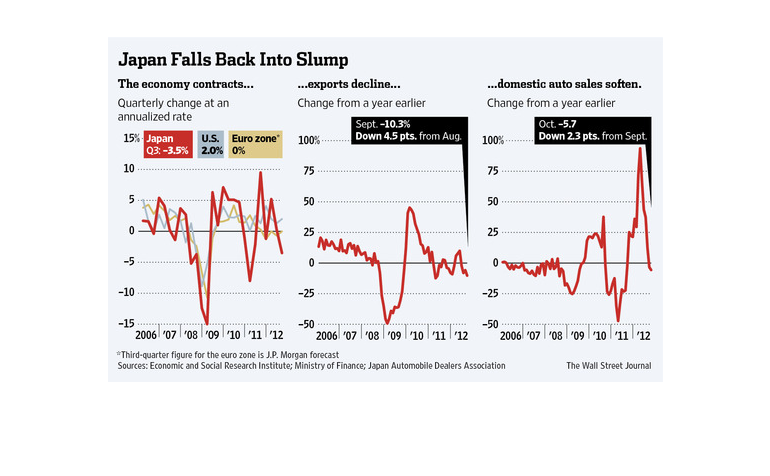
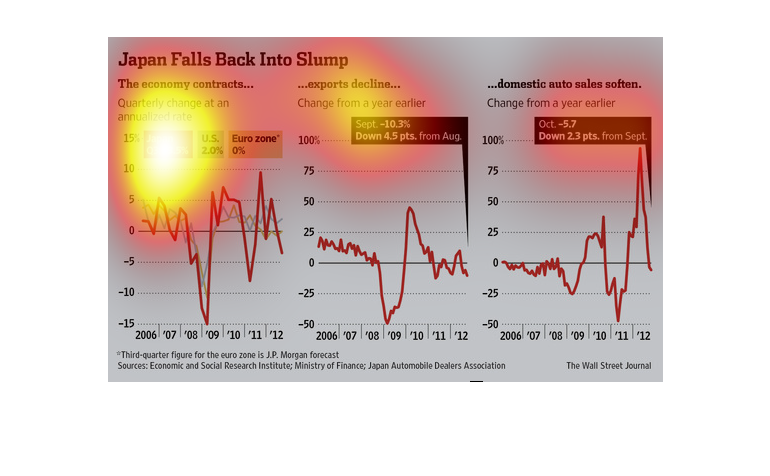
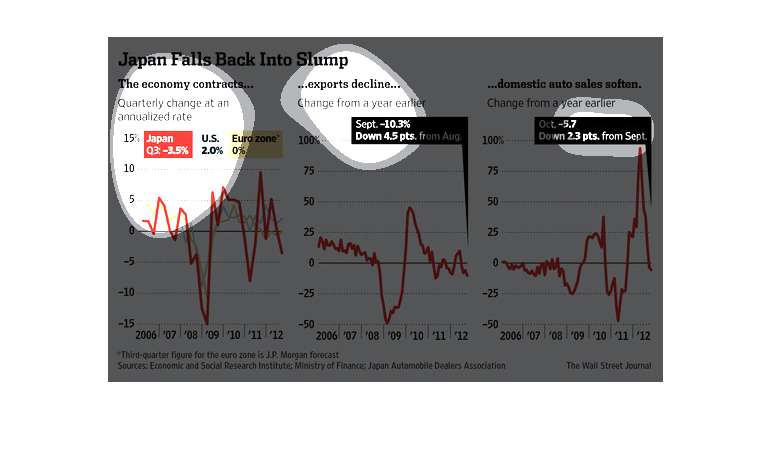
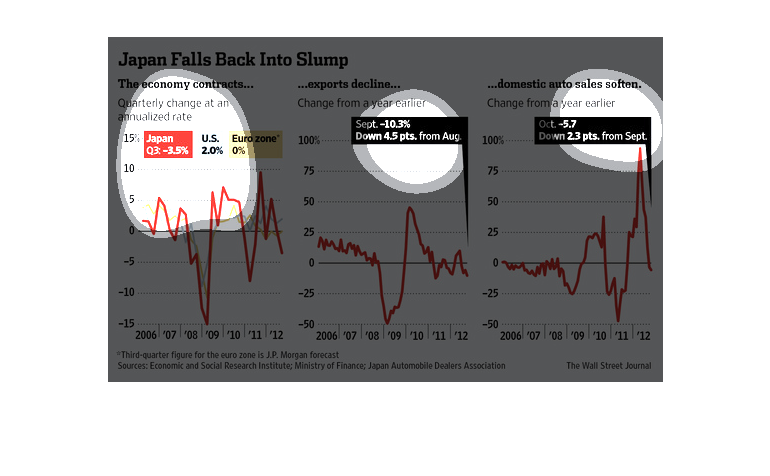
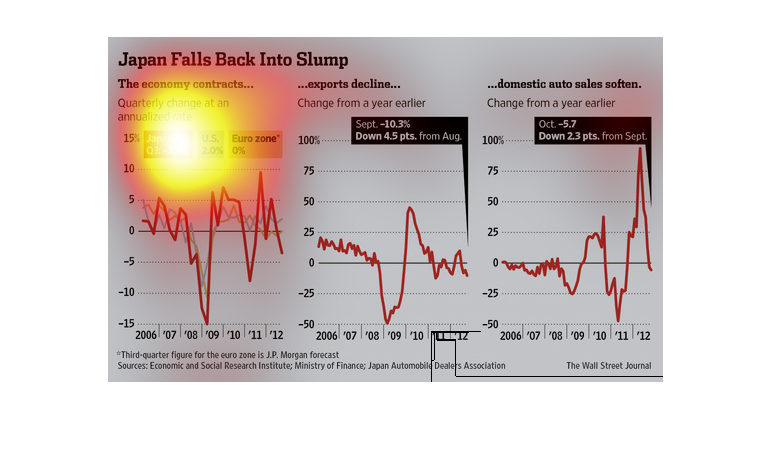
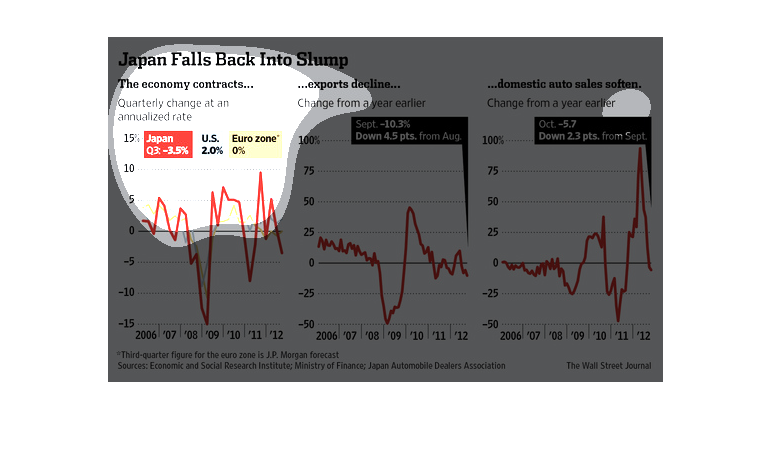
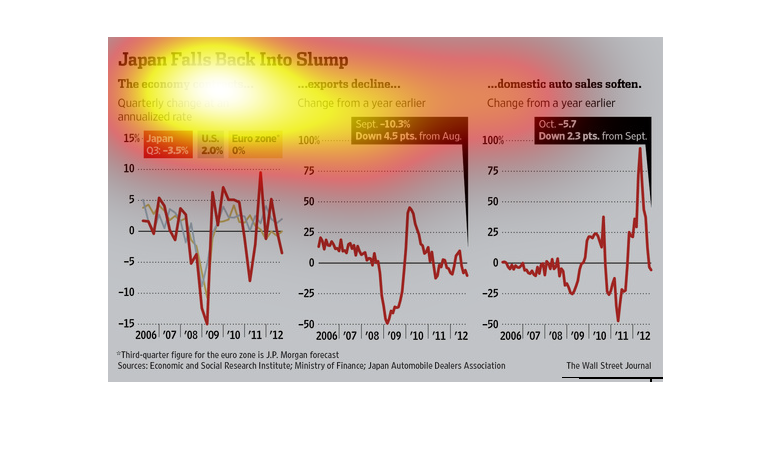
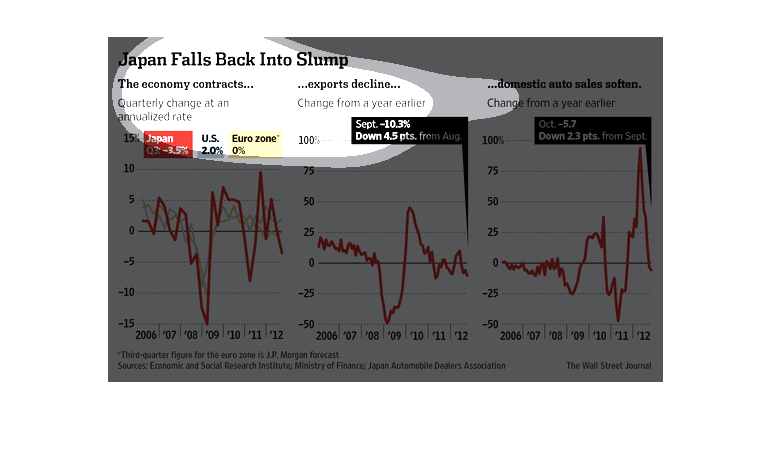
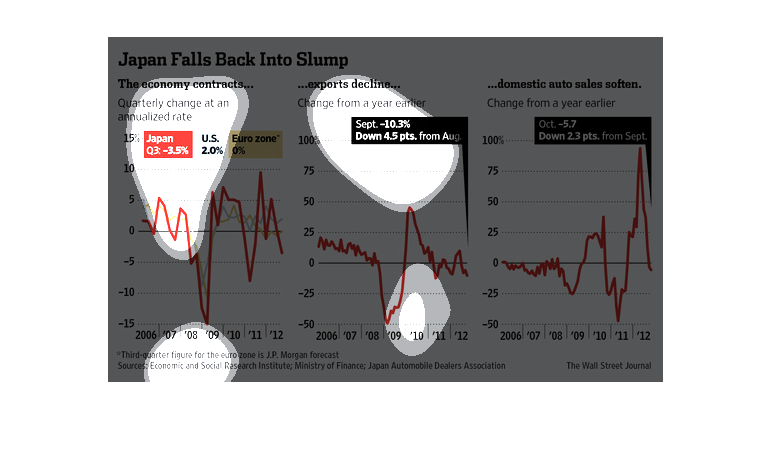
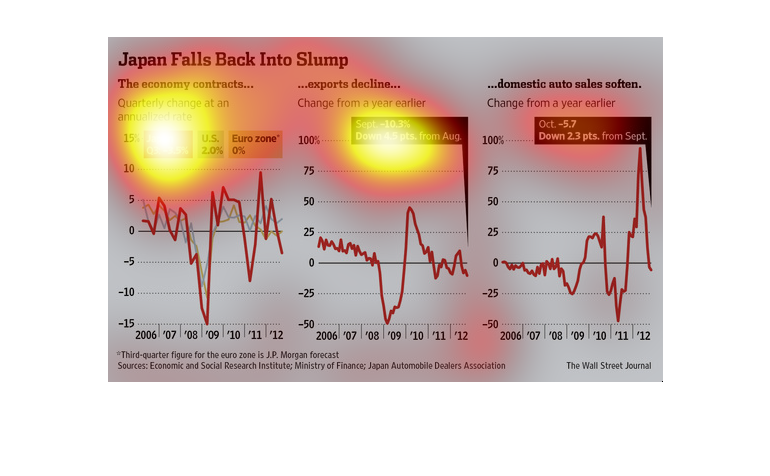
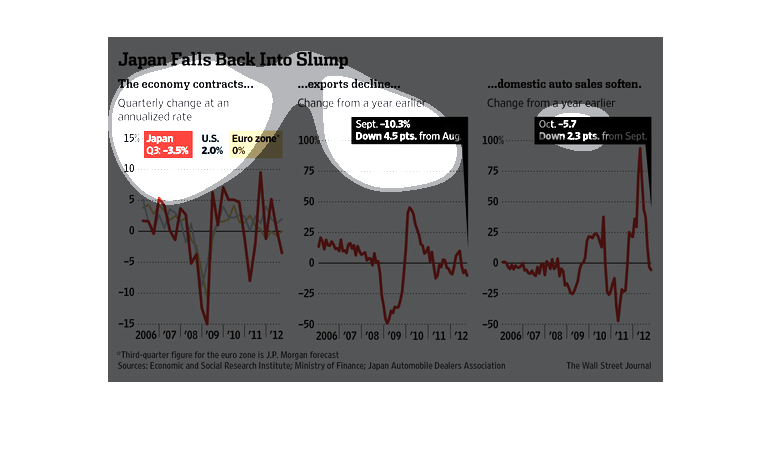
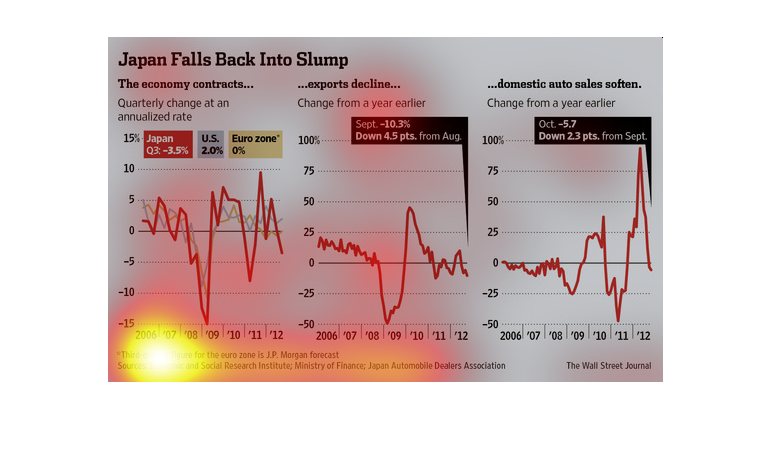
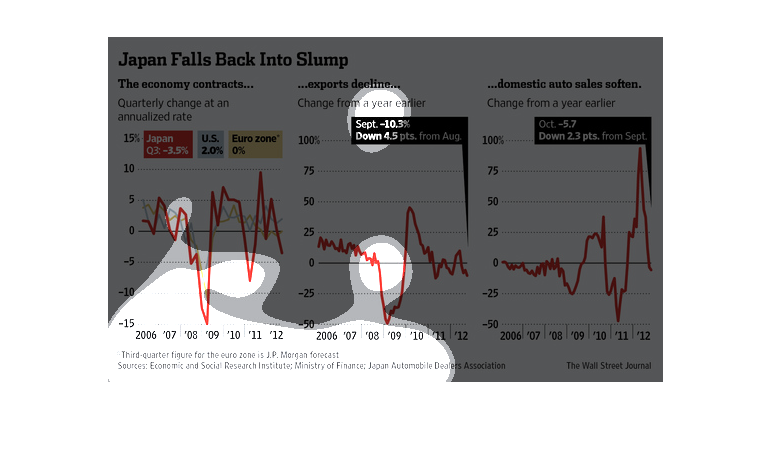
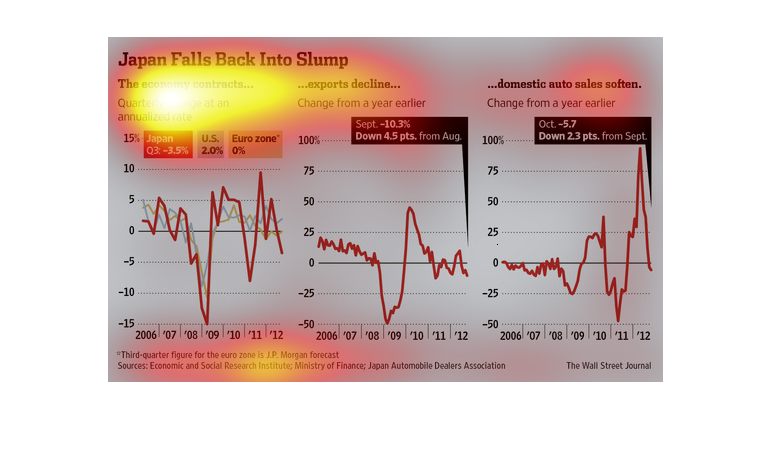
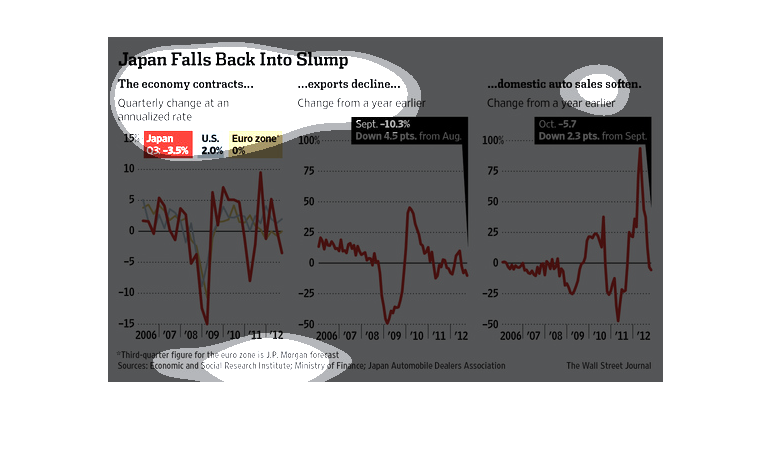
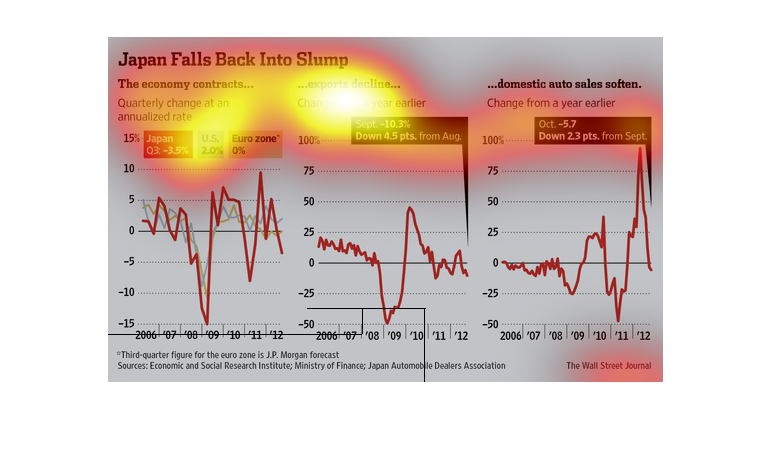
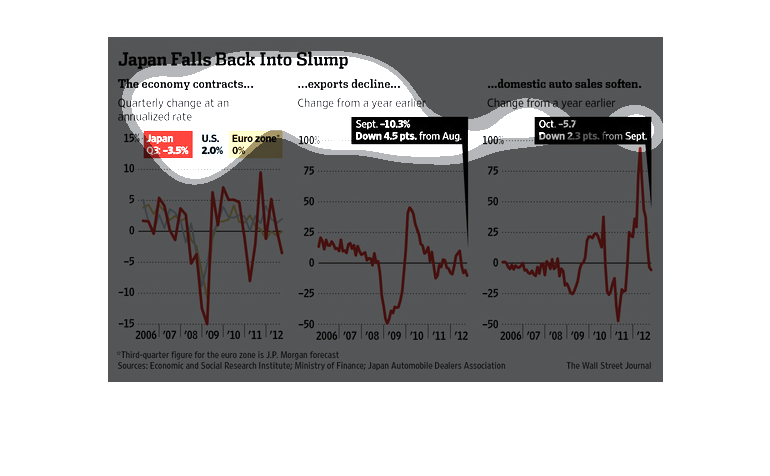
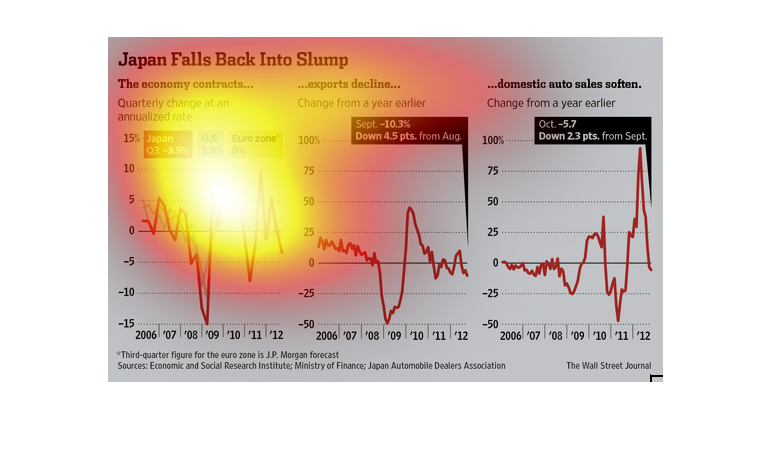
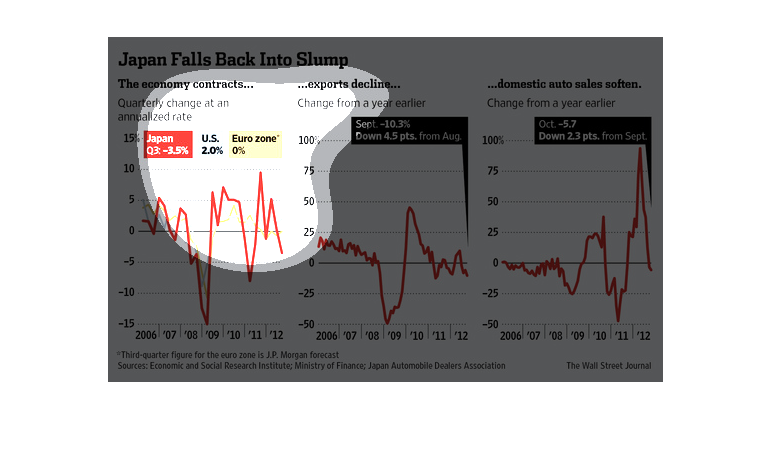
The title of the graphic is Japan falls back into slump. It says that the economy has contracted,
exports have declined dramatically, and domestic auto sales soften.
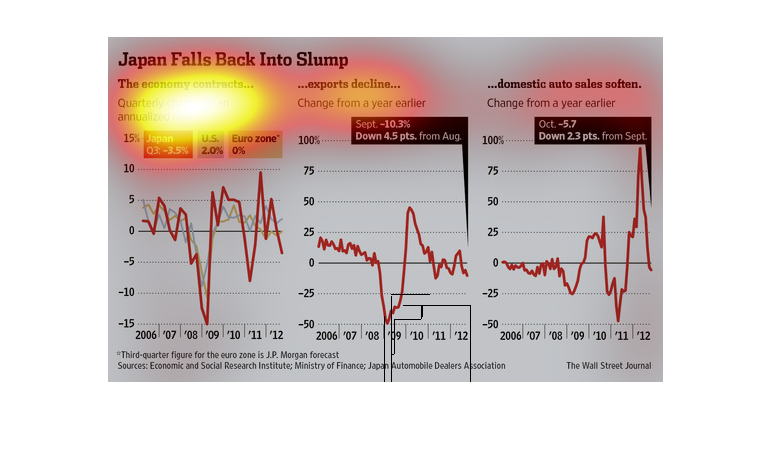
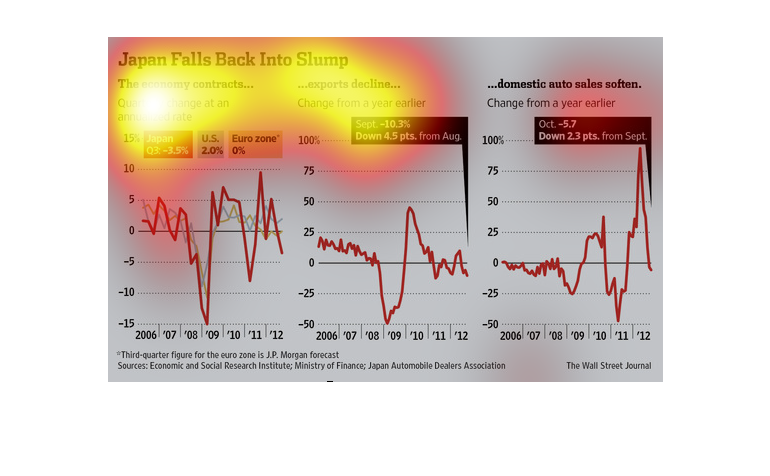
This is a chart which is telling that Japans economy is going into a slump. it says that the
economy shrinks and exports lessen. And also that the car sales in the country declined as
well.
This series of graphs shows the economy and quarterly changes for Japan US and the Euro region,
changes from the earlier year, and changes in domestic auto sales.
The image depicts the Japanese economy contracting, with exports declining, and domestic auto
sales slowly down. Japan's economy is contracting while the US grows by 2.0% and the EU stays
at 0% growth.
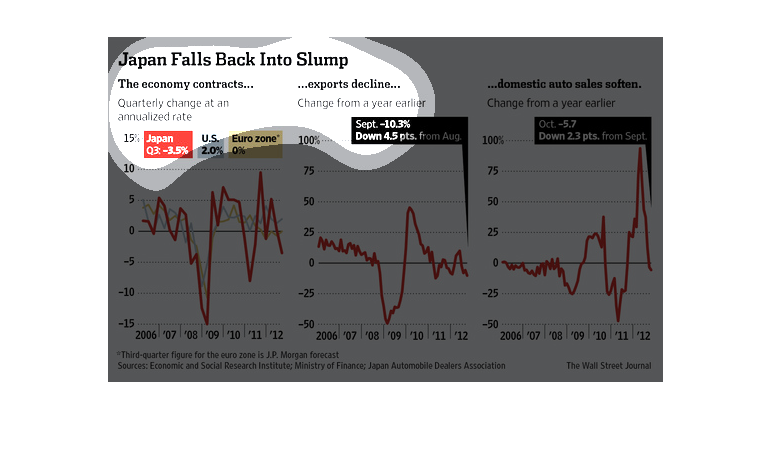
This chart describes Japan falls back into slump. Specifically, the economy contracts. Different
categories on the chart are represented by different colors.
This image details a re entry into an economic slump for Japan, where exports have declined
and domestic car sales have lessened. Three graphs within the image detail the last few years
for Japan, one displaying a comparison of Japan, the US, and Europe, where Japan's economy
had declined, the US has grown, and Europe has remained relatively constant.
This is a chart shewing Japans economy in a slump, and their exports declined. The far left
charts shows a decline in 09 to -15%, and barely above 0 in 2012. Exports were also down in
09, and barely at 0 in 12, and auto sales dipped in 11.
This is a chart about the Japanese economy. There are three graphs showing the economy contract,
and also the lowering of exports as well as the auto sales in Japan.
These charts show Japan's economic slump, with quarterly contract changes at an annualized
rate on the left, annualized change in exports in the middle, and domestic auto sales changes
from a year earlier on the right.
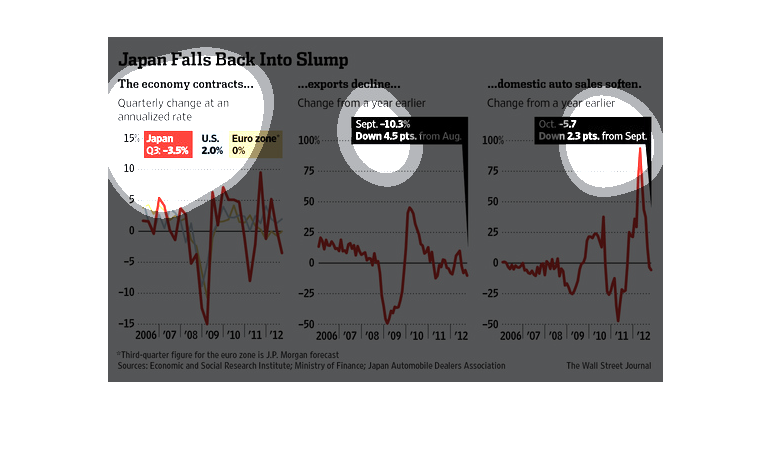
This graph shows how the economy of Japan has been contracting since 2006. Since 2006, Japan
has a change in annualized rate of -3.5% while the US was at +2.0% and the rest of Euro was
at 0%. Specifically during the year of 2012, Japan reported a loss of 10.3%. Finally, auto
sales have sharply fallen at a rate of 5.7%.
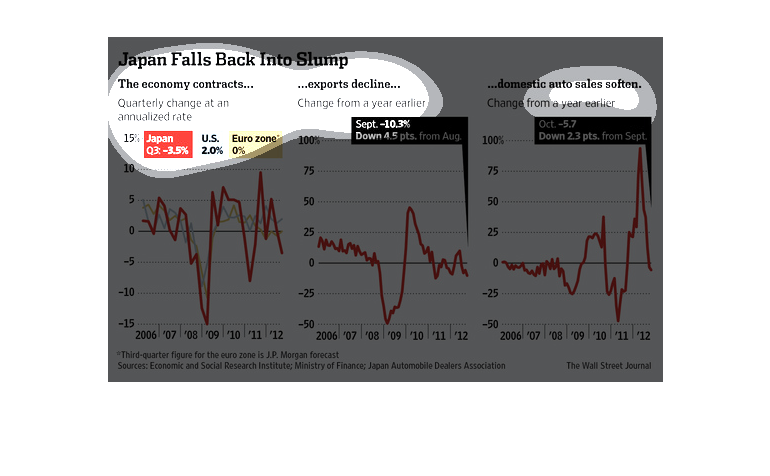
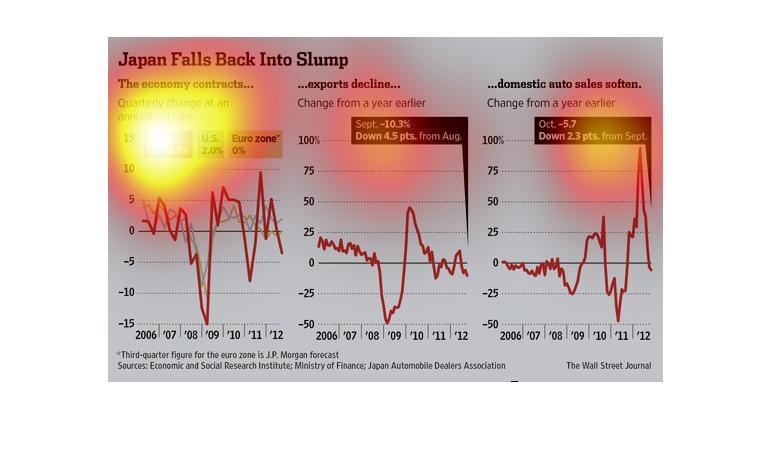
In this 2006 to 2012 study conducted by the Wall Street Journal from research obtained from
J.P Morgan and others, we can safely say that Japan has fallen into a financial slump.
According to various sources, Japan's economy is falling into a recession of some sort. More
specifically, exports have declined, and domestic auto sales are falling
This chart from the Wall Street Journal shows how the japanese economy has gone back into
a slump with exports down and GDP growth slowing down over time
This chart describes Japan falls back into slump. Specifically, the economy contracts . Categories
on the chart include Japan, the United States, and Euro Zone.
This chart from the Wall Street Journal shows how Japan has fallen back into a slump in terms
of GDP growth and inflation, which is close to 0% or deflationary