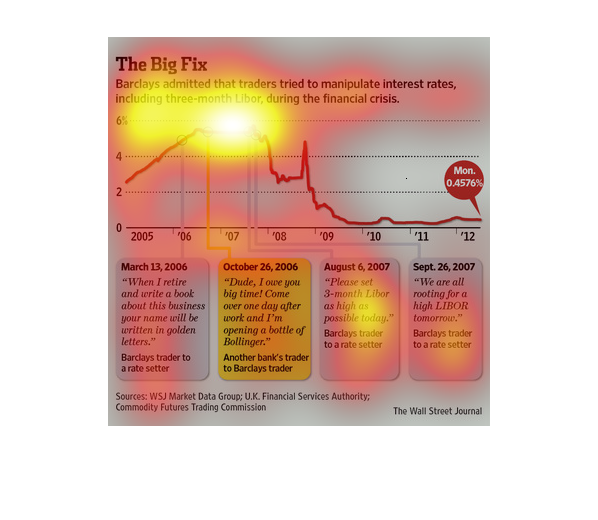
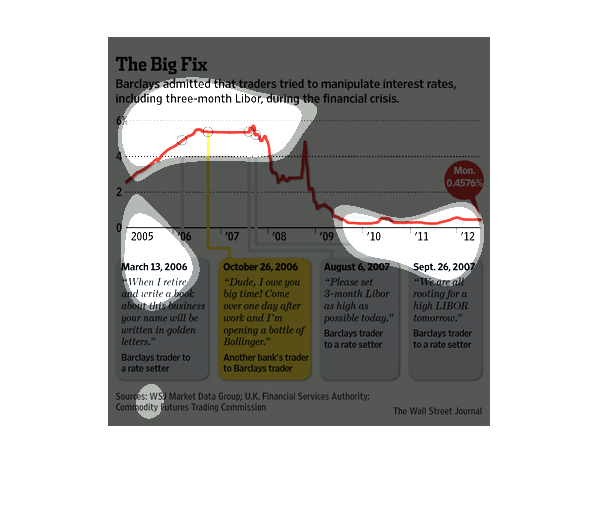
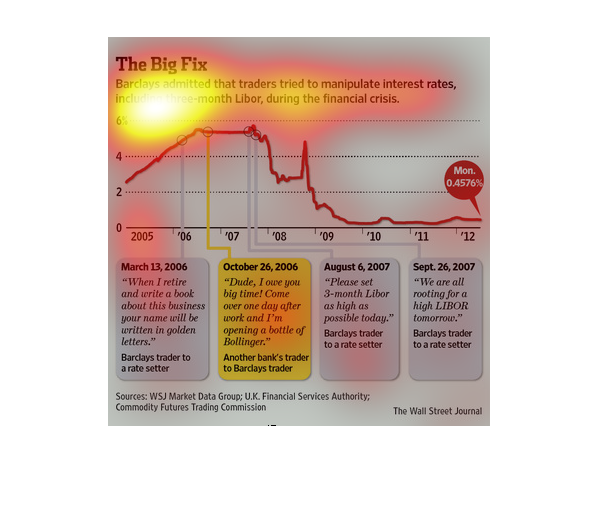
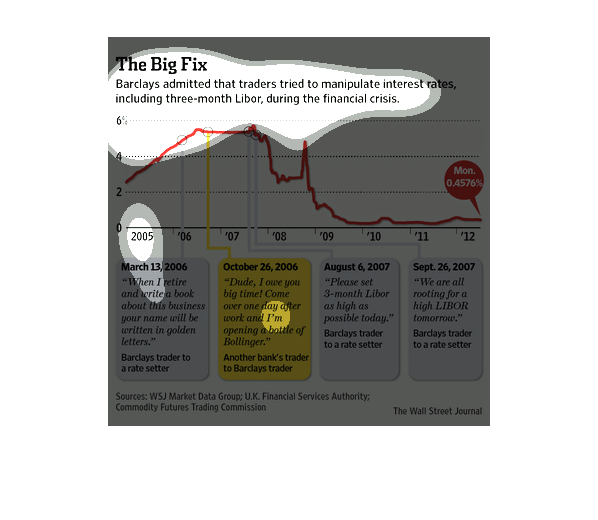
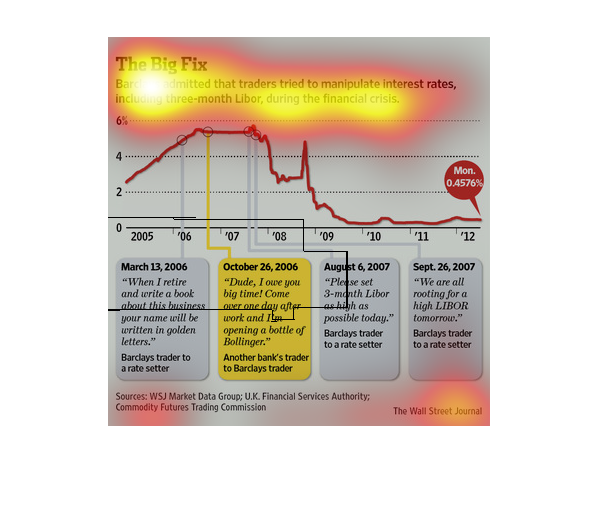
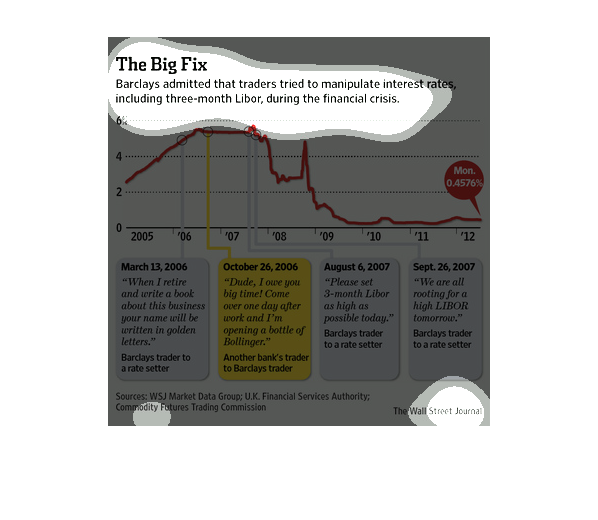
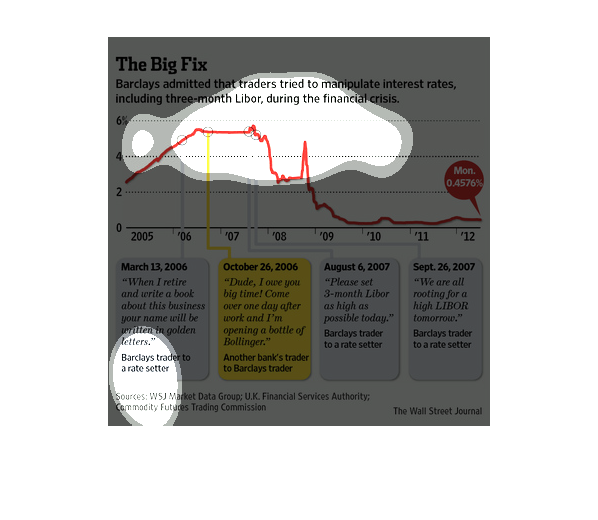
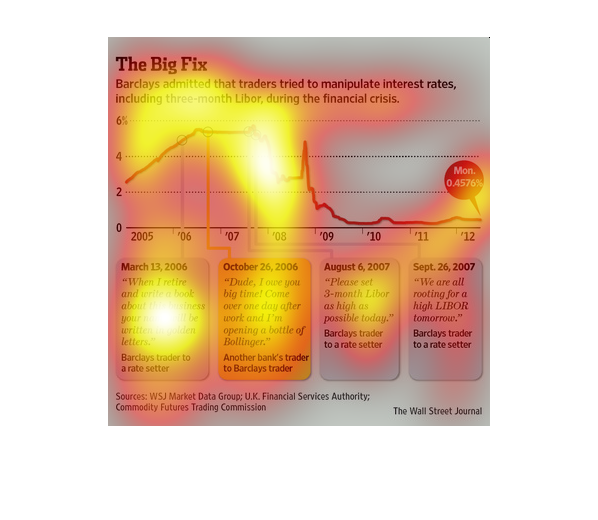
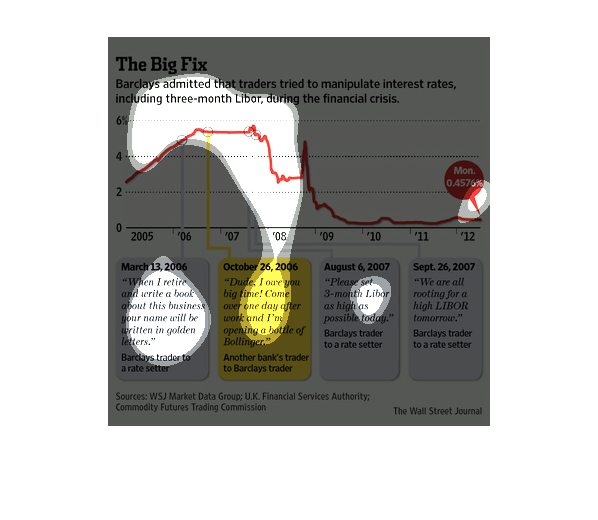
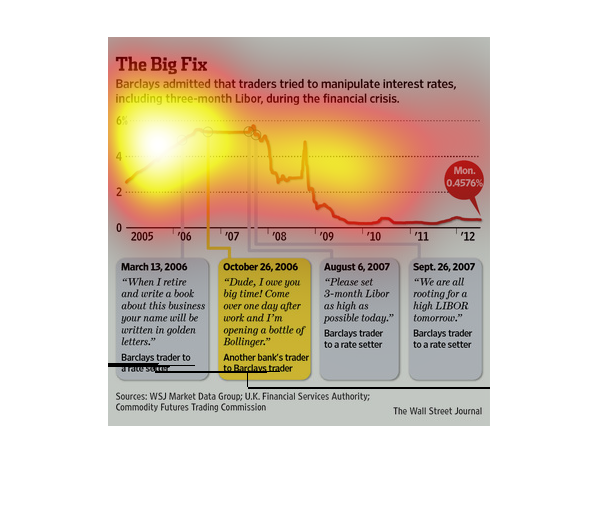
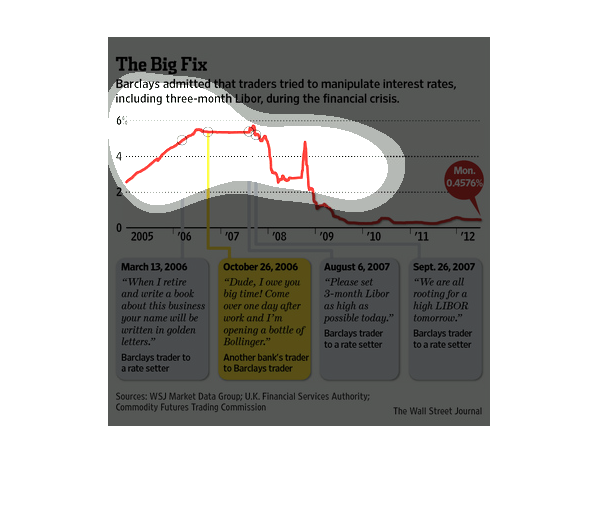
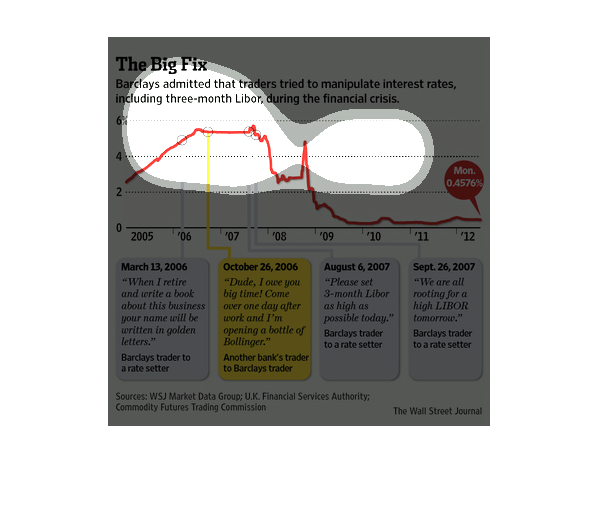
Barclay's admitted its traders tried to manipulate interest rates. The Chart shows the Libor
interest rates between 2005 and 2012, and gives examples of communication of Barclay's traders
during that time.
This infographic is showing the relationship between an interest rate of something and the
year that it was implemented. It also includes several quotes from the person who implemented
the interest rate and the time stamp of that quote is plotted along that chart.
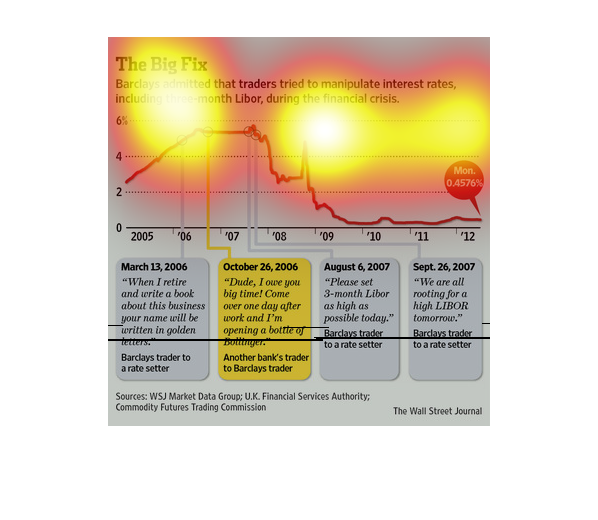
Everyone is out for a quick buck, and those type of people don't think twice about screwing
the little guy, as least that is what this report states about some Barclays operatives during
the financial crisis.
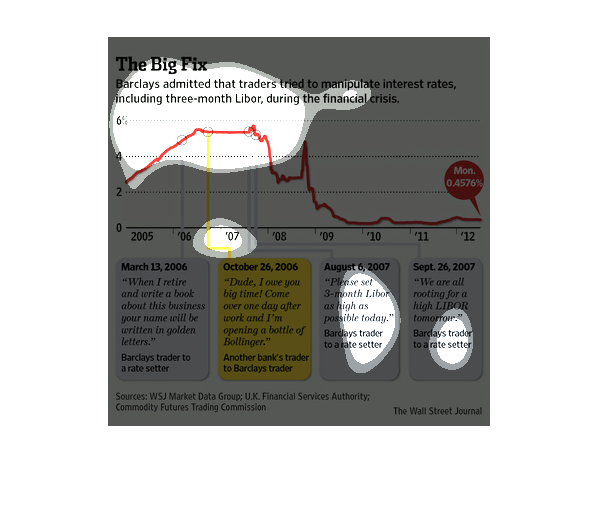
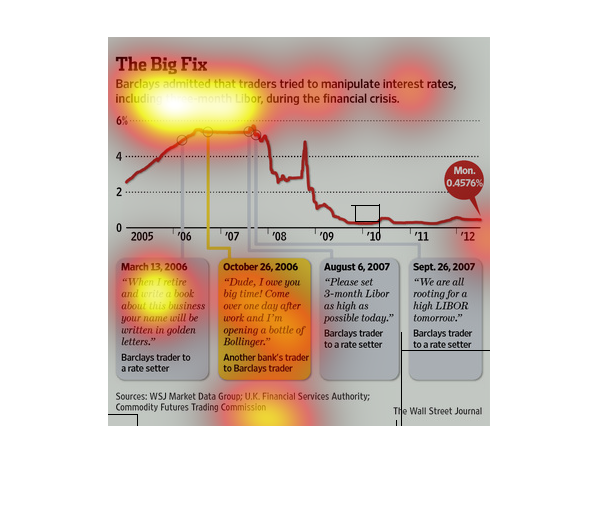
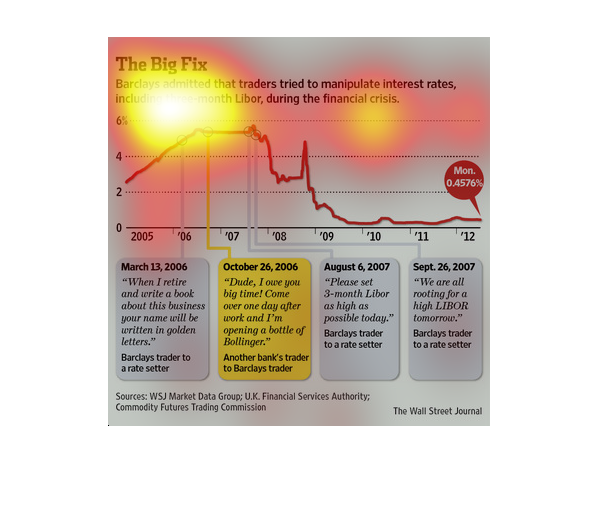
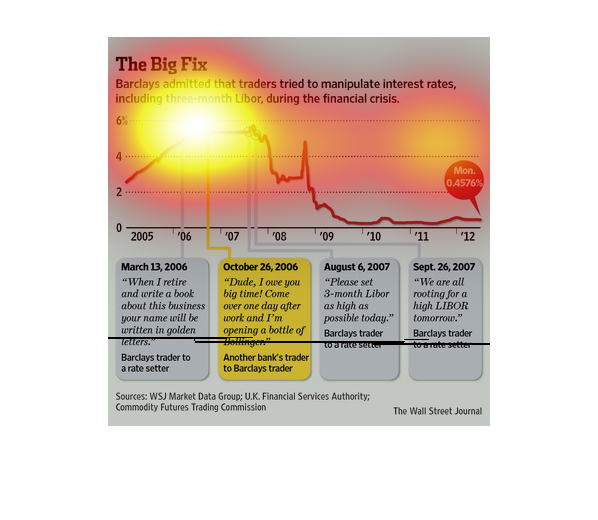
This graph shows the manipulation of interest rates including the Libor from 2005 to 2013
with milestones throughout including quotes from Barclays traders.
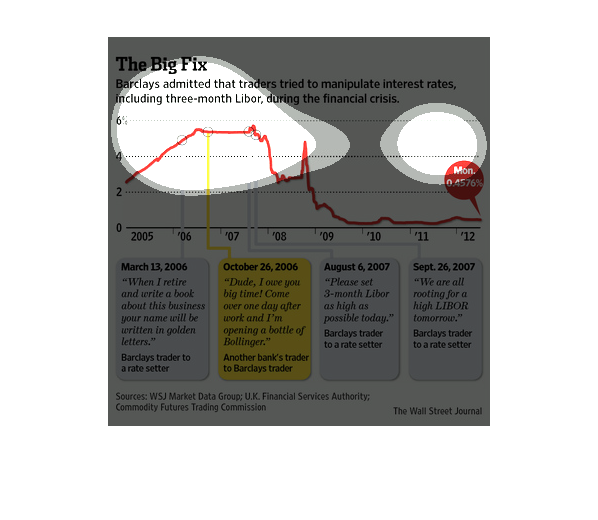
Barclays admitted that traders tried to manipulate trading rates including the Libor during
the time of financial crisis - graph represents 2005 to 2012 and timeline of events.
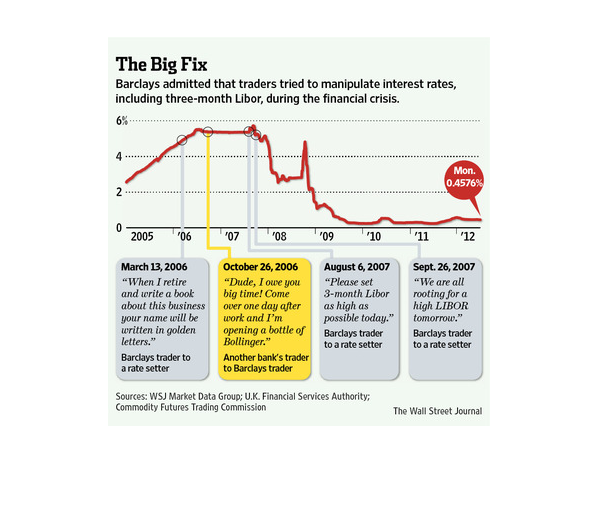
Barclays admitted that traders tried to manipulate interest rates, including three-month Libor,
during the financial crisis. This is a line graph that is titled "the big fix".
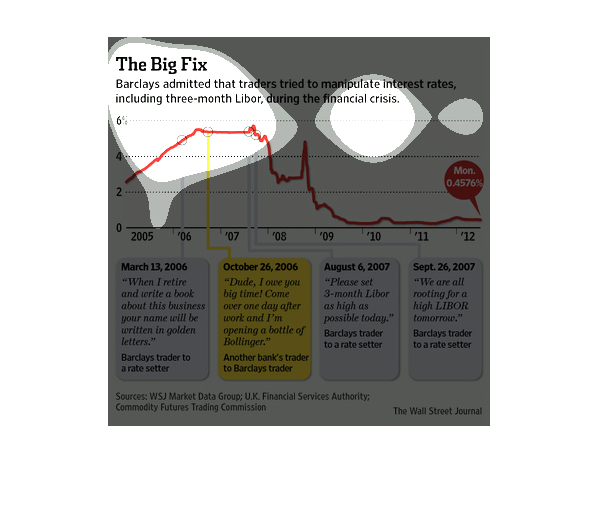
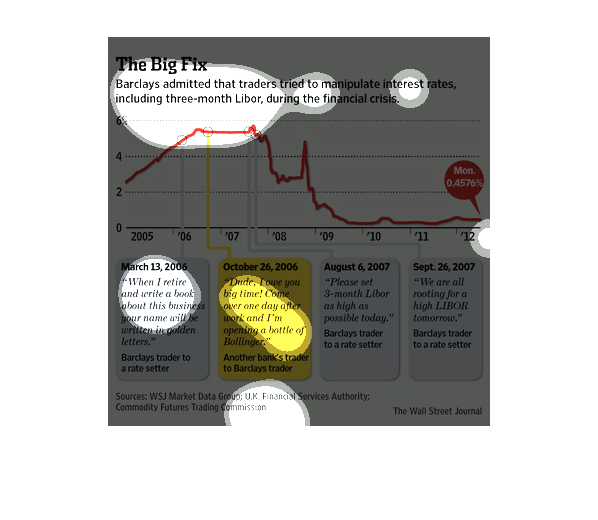
This chart describes the big fix. Specifically,Barclay's admitted that traders tried to manipulate
interest rates. Different categories are represented by different colors.
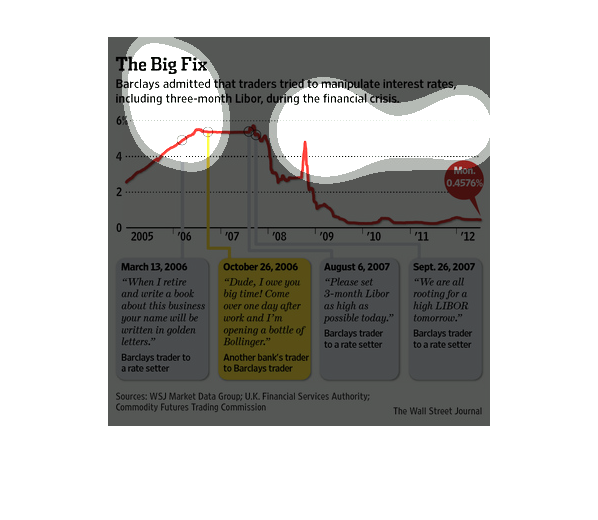
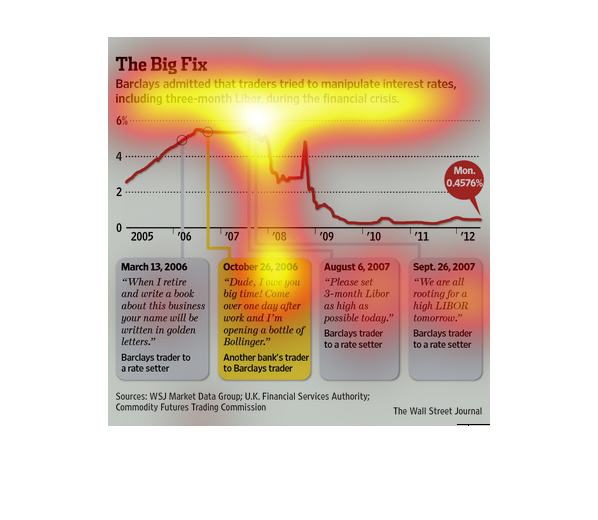
The Big Fix - Barclays admitted that traders tried to manipulate interest rates (including
the 3-mo Lipor) during the financial crisis.  The graph showed interest rates along with emails/notes
to rate setters on 4 different dates, requesting rate increases.
This chart describes the big fix. Specifically, Barclay's admitted that traders tried to manipulate
interest rates, including three-month Libor, during the financial crisis.
This chart from the Wall Street Journal shows how Barclays admitted to fixing the LIBOR rate.
It shows how they tried to fix the LIBOR rate.
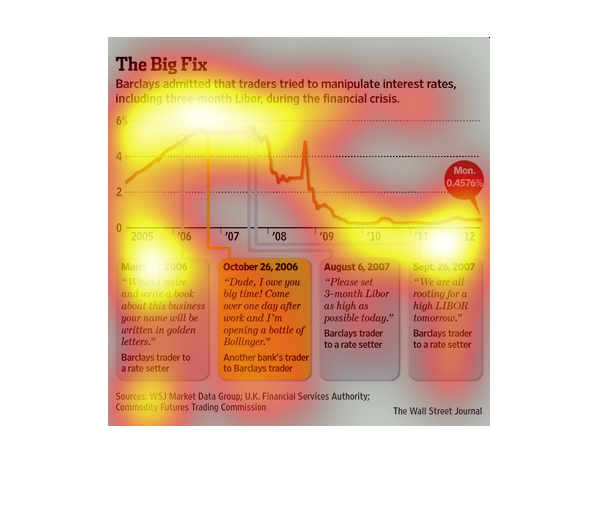
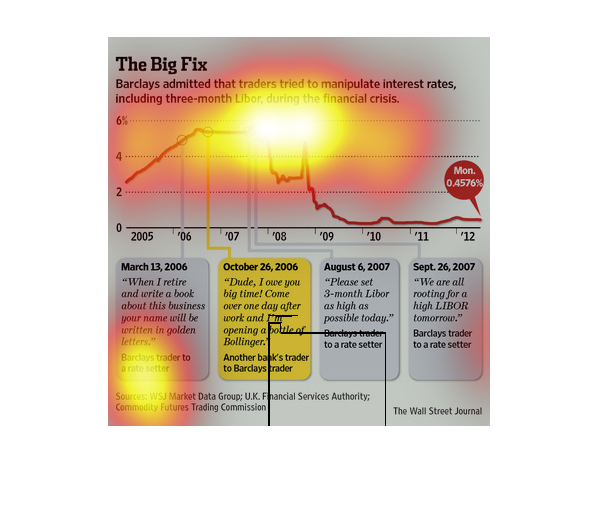
This chart from the Wall Street Journal shows how Barclays bankers tried to manipulate the
LIBOR rates and how they got caught doing this market maniuplation
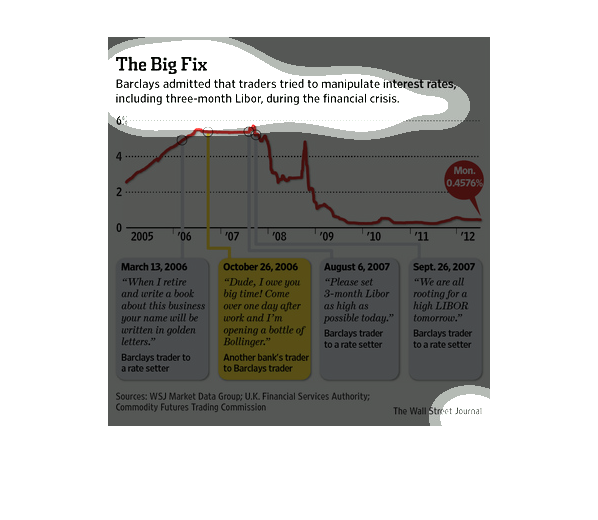
The Big Fix: Barclay's admitted that traders tried to manipulate interest rates, including
three-month Libor, during the financial crisis.  The chart begins in 2005 and shows rates
at 2%, peaking between 2006-07 at 6%. Latest figure is 0.4576%. Accompanying text for particular
years gives insight into the manipulation.
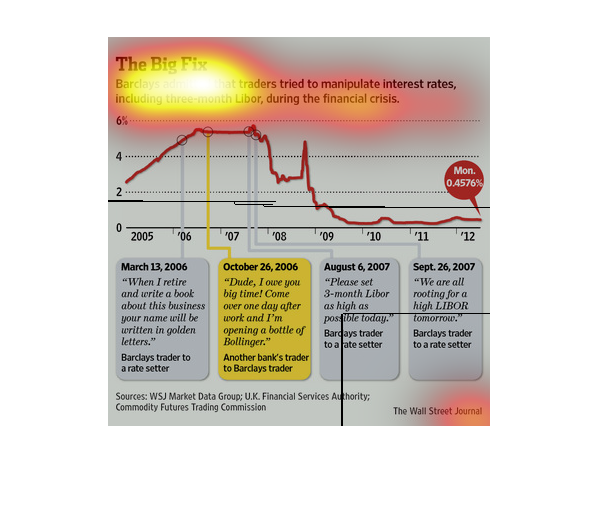
The following chart is labeled the Big Fix. Barclays bank  admitted that traders tried to
manipulate interests rates on bonds during the financial crises and it predominately revolved
around 3 month libor bonds.
The image depicts how traders at Barclay's were found to be manipulating interest rates, including
three-month libor, during the financial crisis leading into 2008.
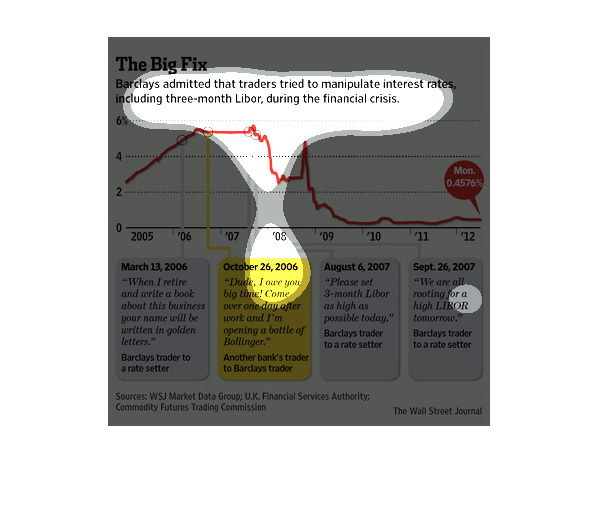
This chart shows interest rates from 2005 to 2012 with quotes from Barclay's traders who tried
to influence interest rates. Interest rates rose to almost 6% shortly before the financial
crisis.